
Summary - Remember K.I.S.S.? Not the band, but the rule "keep it simple, silly"? That's the name of the game when using our Value component to visualize data - but that doesn't diminish the value of this component.
Over the next few weeks, we're going to provide an overview for each of the components available in Klipfolio Dashboard for web and mobile. Components, sometimes called Klip types, are the data visualizations used to create dashboards (learn more about data visualization using Klipfolio). Let's start by taking a look at the Value component.
Value Component
The Value component displays two values: a primary and a secondary value. Think of this component as a table with two cells; the top cell is preformatted to display larger text, and the bottom cell is used to display smaller text. As with just about anything else in Klipfolio Dashboard, you can change this in the Klip Editor.
The Value component is ideal for monitoring a single KPI, such as stock price or a ratio. I typically use the Primary Value component to display the metric I want to be visible, while I use the Secondary Value to provide some context for Primary Value.
Key Features
- Primary Value as in text, number, currency, percentage and link
- Supports conditional indicators like text color and images
- Optional Secondary Value
- Adjustable font size, color, style, and wrap handling
- Supports suffix and prefix
Best practices for the Value component
Here are some guidelines to follow when building the Value component.
- Context
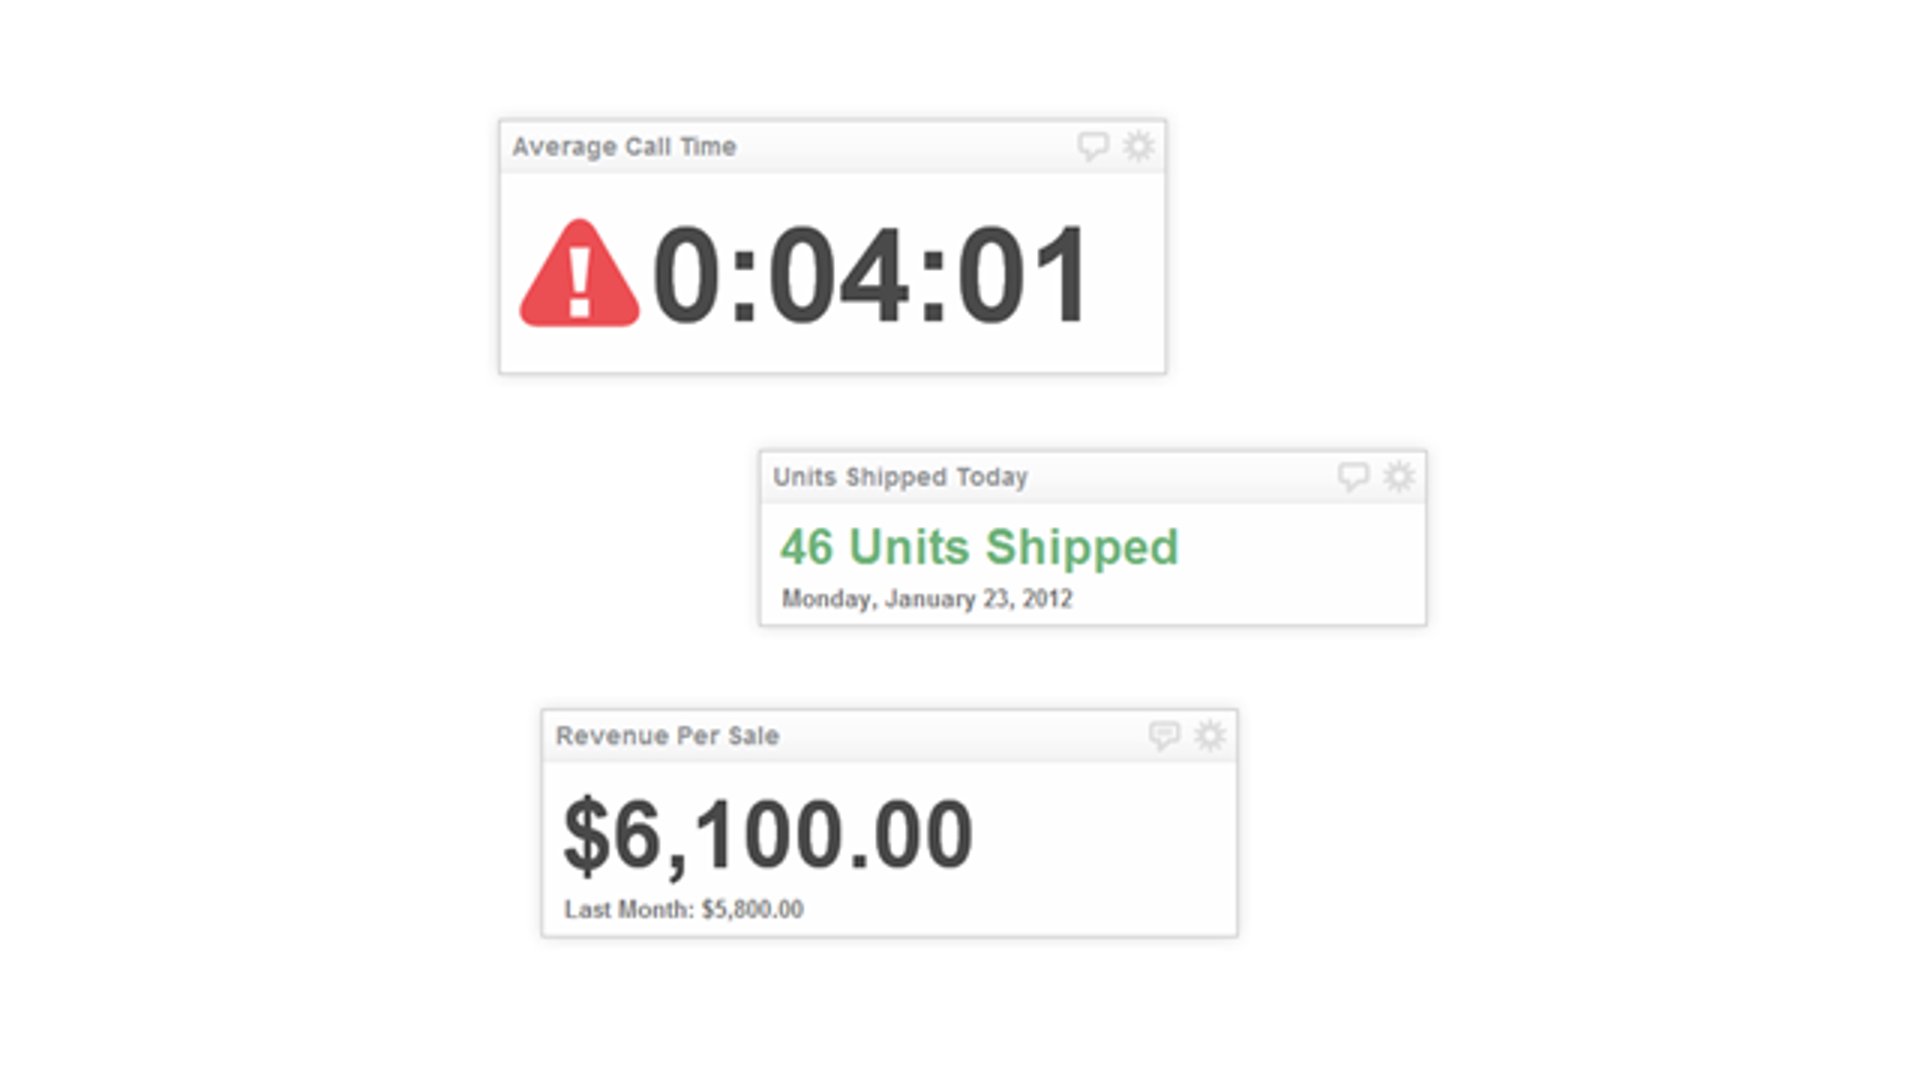
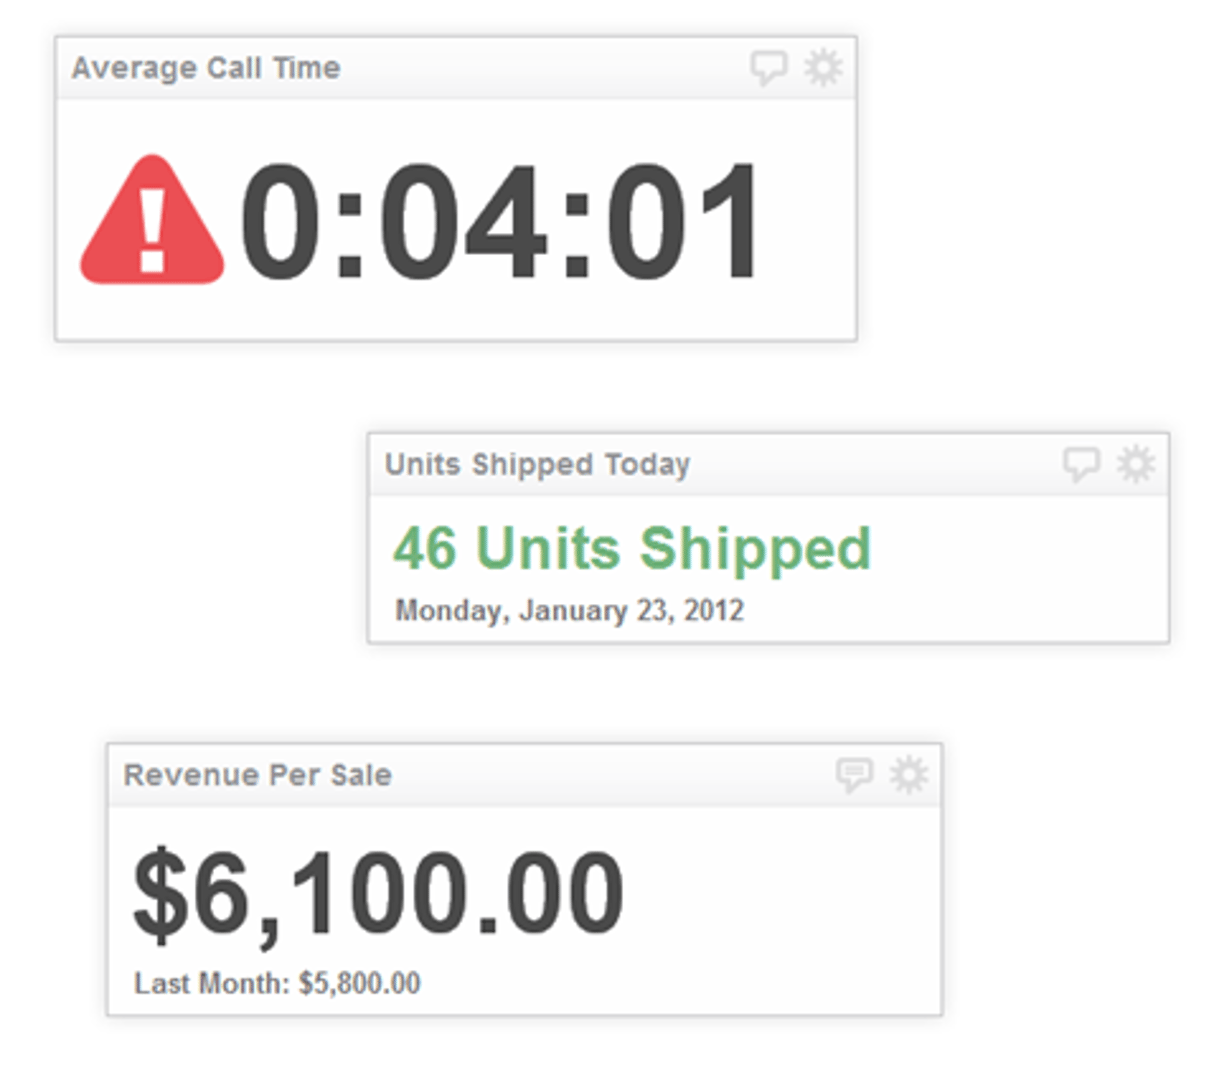
There happens to be a lot of different ways you can provide context for a KPI (not least of which is how you place it on your dashboard). One of the best ways to do this in the Klip Editor is to use the prefix and suffix fields. The reason for this is that if you hard-code a phrase like "Units Shipped" in the formula editor, those values will be included in whatever formula you are using.
- Indicators
If the metric you are monitoring has a threshold (like 4 minutes), then applying indicators to your Klip is a good idea. Let's face it, the Value component has a pretty unglamorous job (compared to gauges or fancy charts), but a simple indicator icon is often enough to get the job done. After all, your purpose with any KPI is to expose valuable business information in a way that is super easy to discern. When done right, indicators add "at a glance awareness" to your KPIs.
- Simplicity!!!
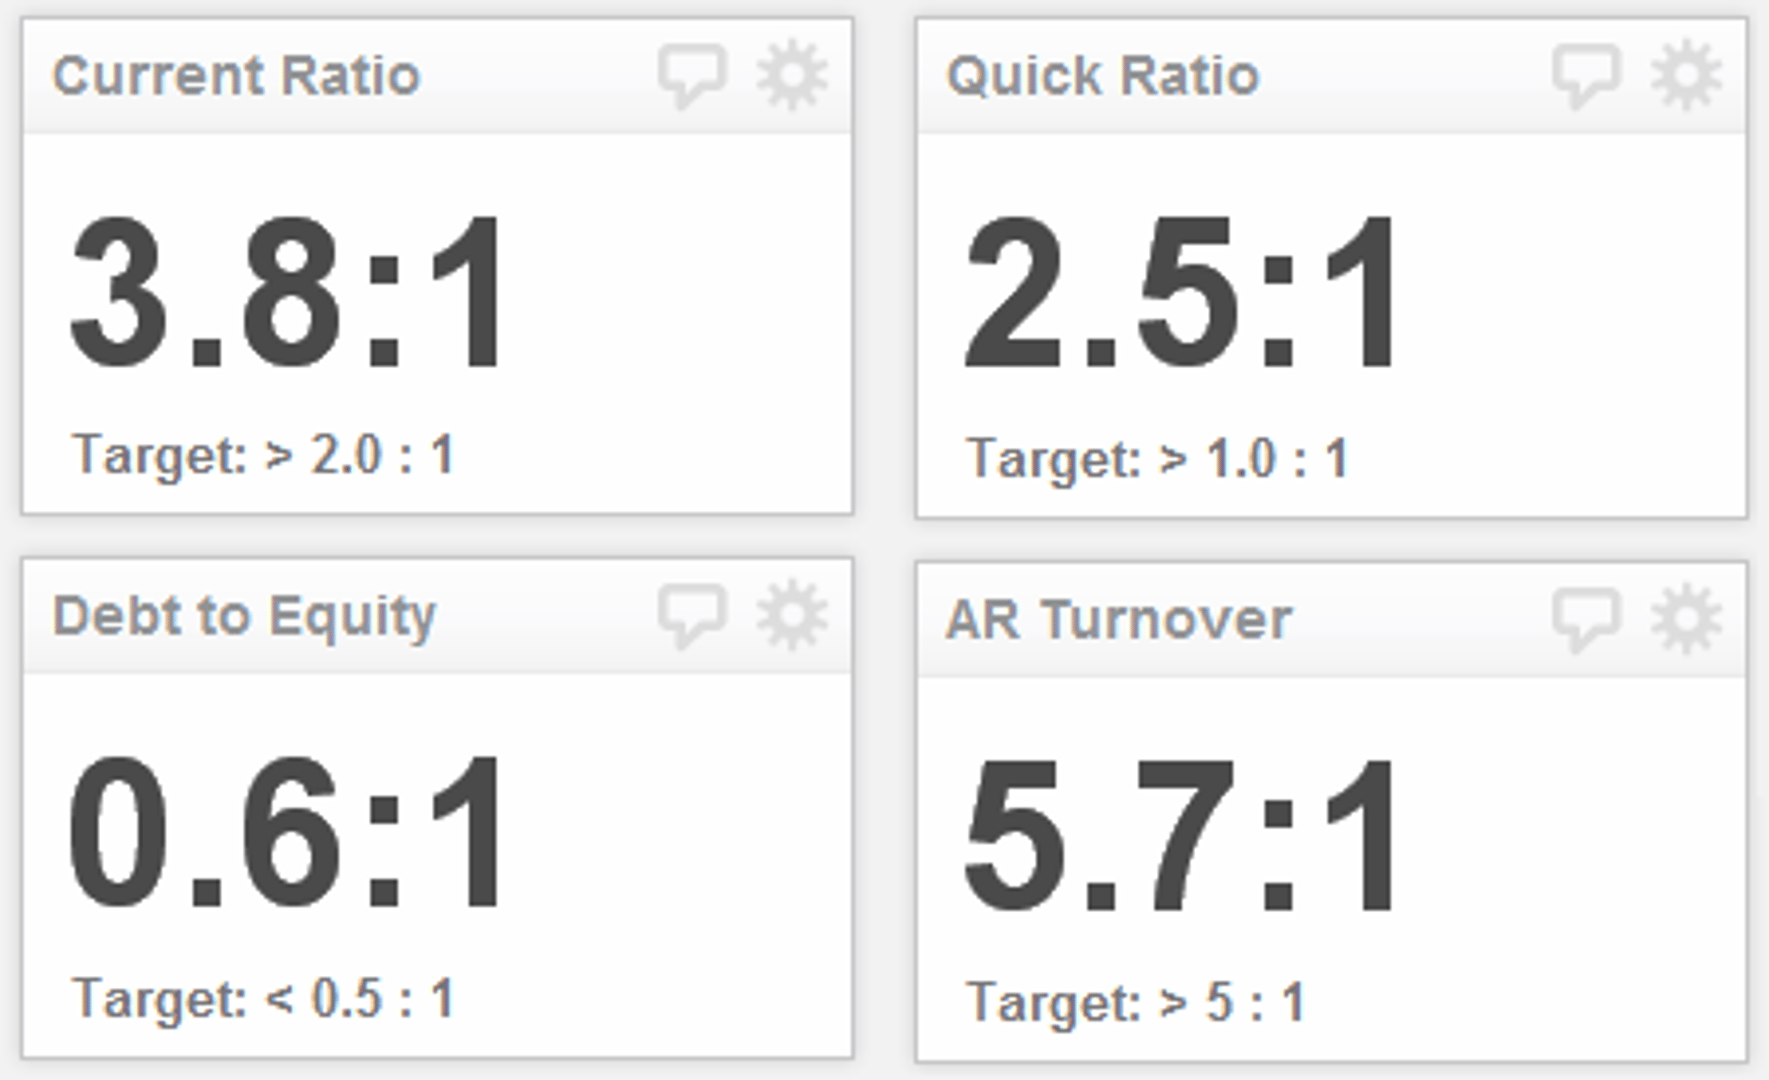
You got it - the Value component is designed to be as simple as possible. In fact, this is why this component lends itself so nicely to financial ratios. You can provide a quick, relevant view of financial metrics, as well as some context, without making people squint their eyes. I suppose I could have applied indicators to the Klips below, but to be honest, I think these Klips work fine without (personal preference, perhaps).
Related Articles

Klipfolio Partner How-To #1: Duplicating dashboards across client accounts
By Stef Reid — November 27th, 2025
The Starter Guide to Dashboard Design
By Emily Hayward — September 24th, 2025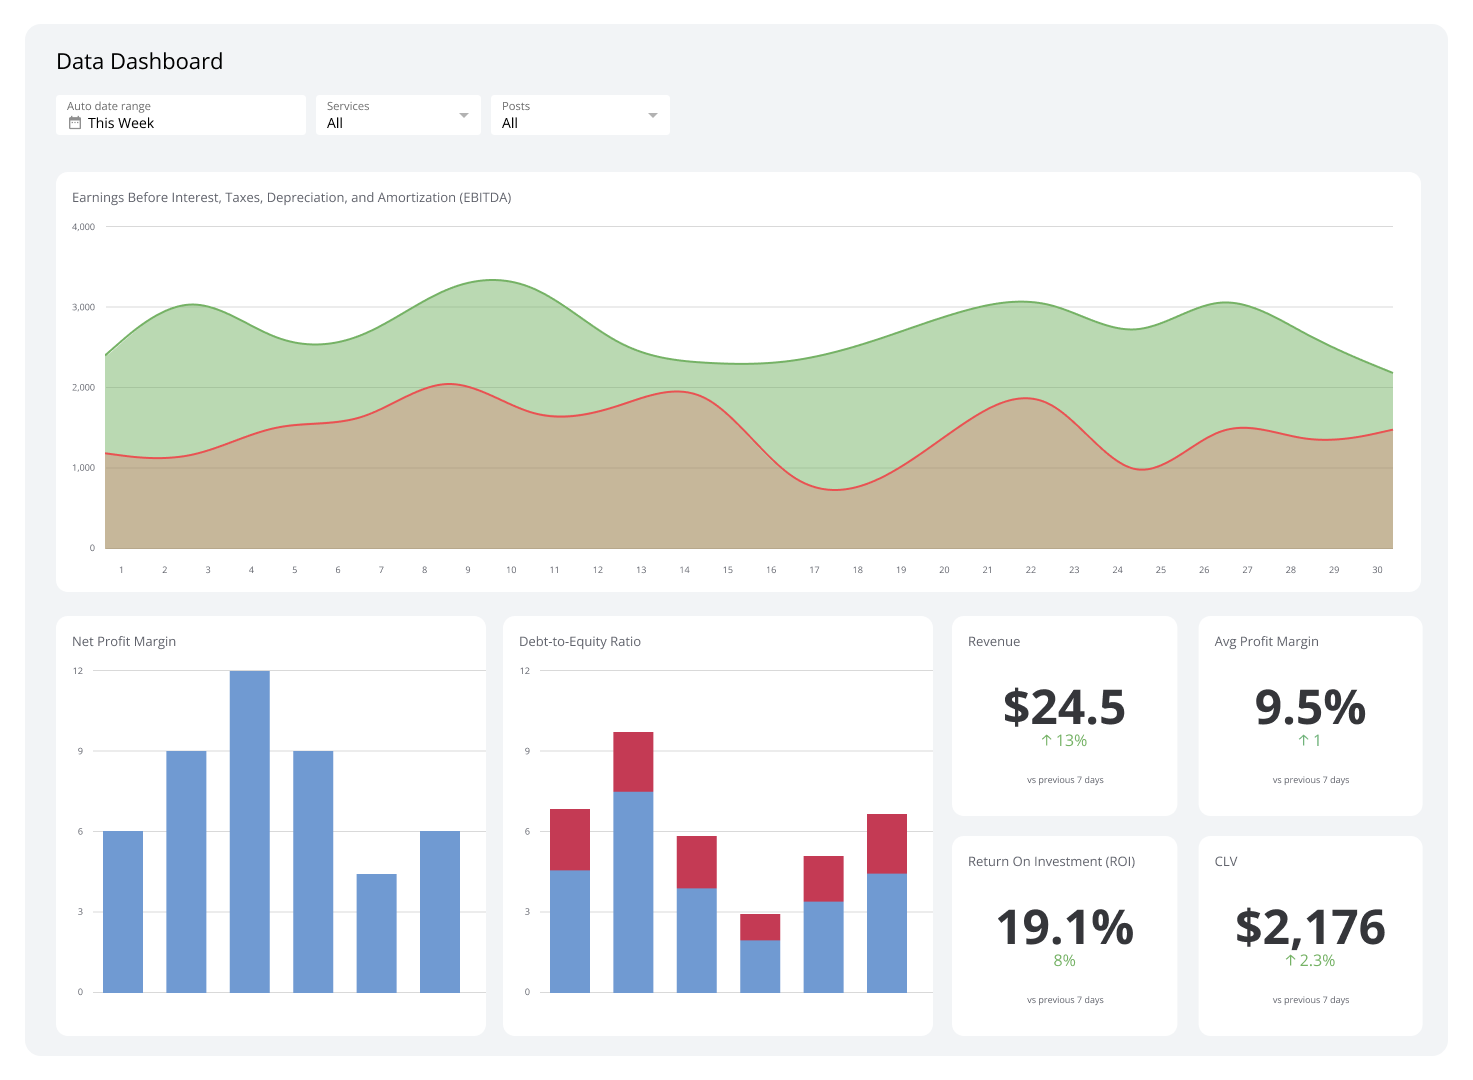
What is a data dashboard?
By Emily Hayward — August 18th, 2025