Google Analytics
Google Analytics is your go-to service for measuring customer insights. Track your advertising ROI, traffic sources, campaign conversions, user paths, pageviews and the like.
Track all your Google Analytics KPIs in one place
Sign up for free and start making decisions for your business with confidence.


Custom Google Analytics 4 dashboards
Develop custom Google Analytics 4 dashboards to create advanced dashboards and reports. Use the Google Analytics Query Explorer to bring rich data sets into Klipfolio. Combine your Google Analytics data with services like Facebook Ads, HubSpot, and more to build dashboards.
Use pre-built Google Analytics metrics
Assemble a Google Analytics dashboard by selecting pre-built metrics from the Klip Gallery.
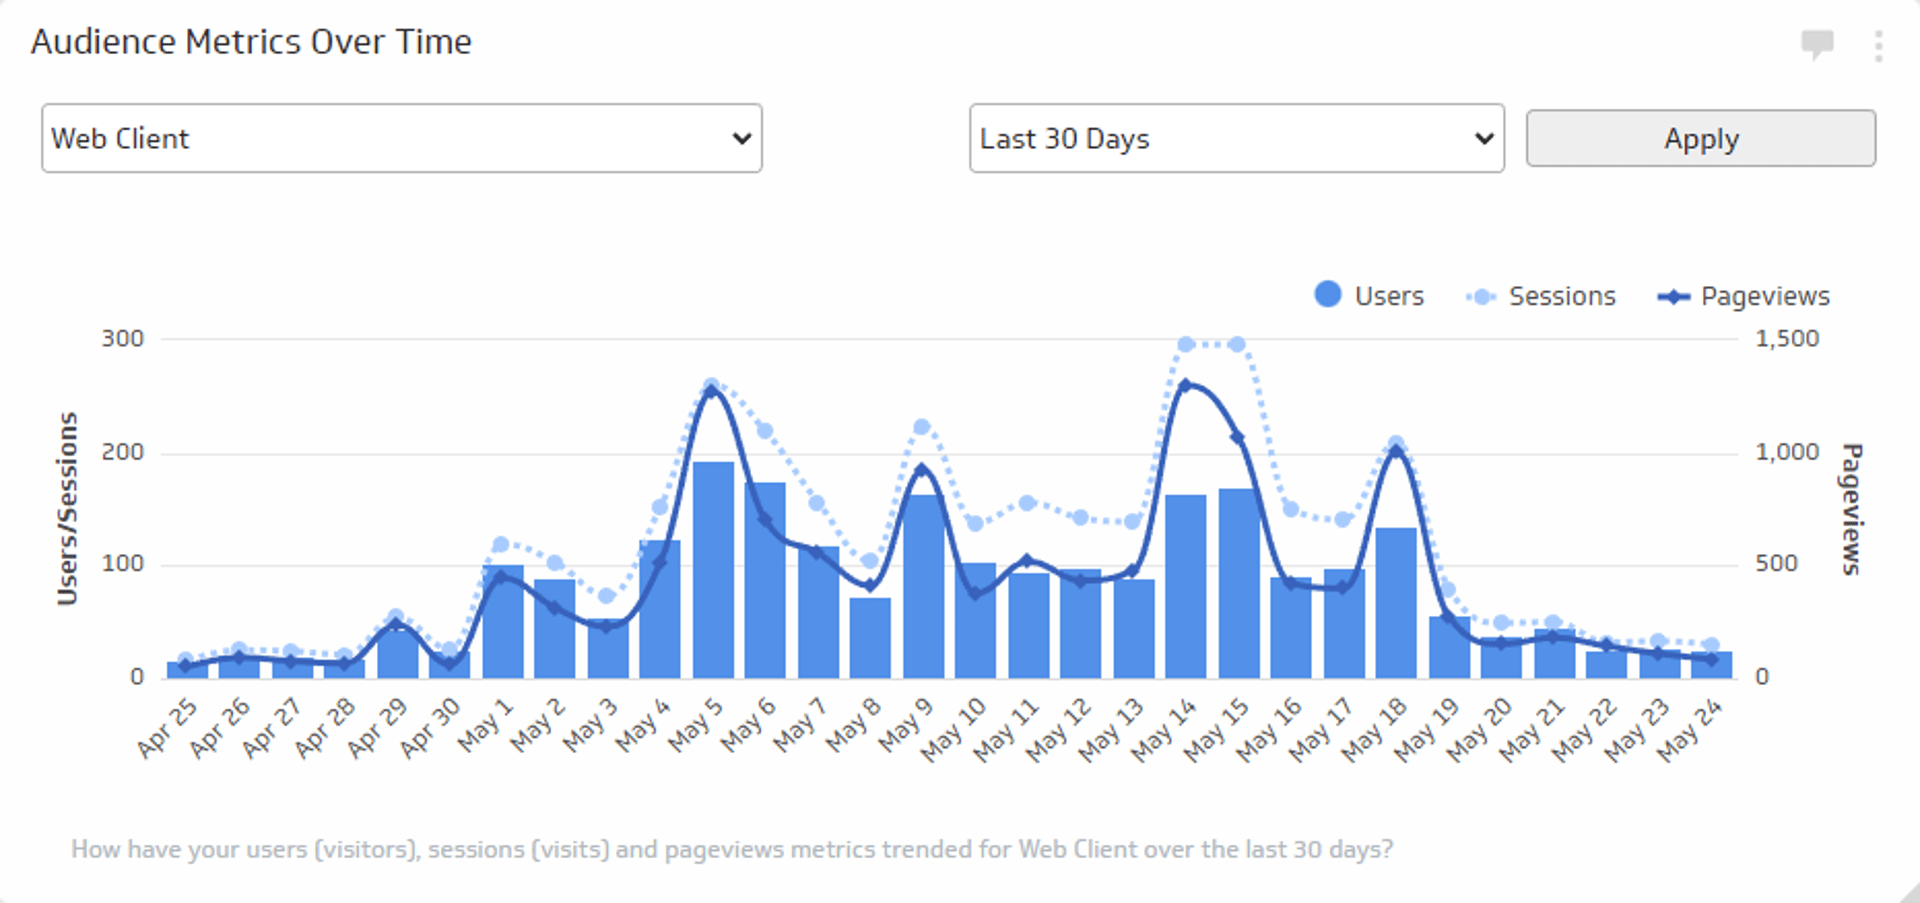
Audience Metrics Over Time
Track the total number of users, sessions, and views trend over time.
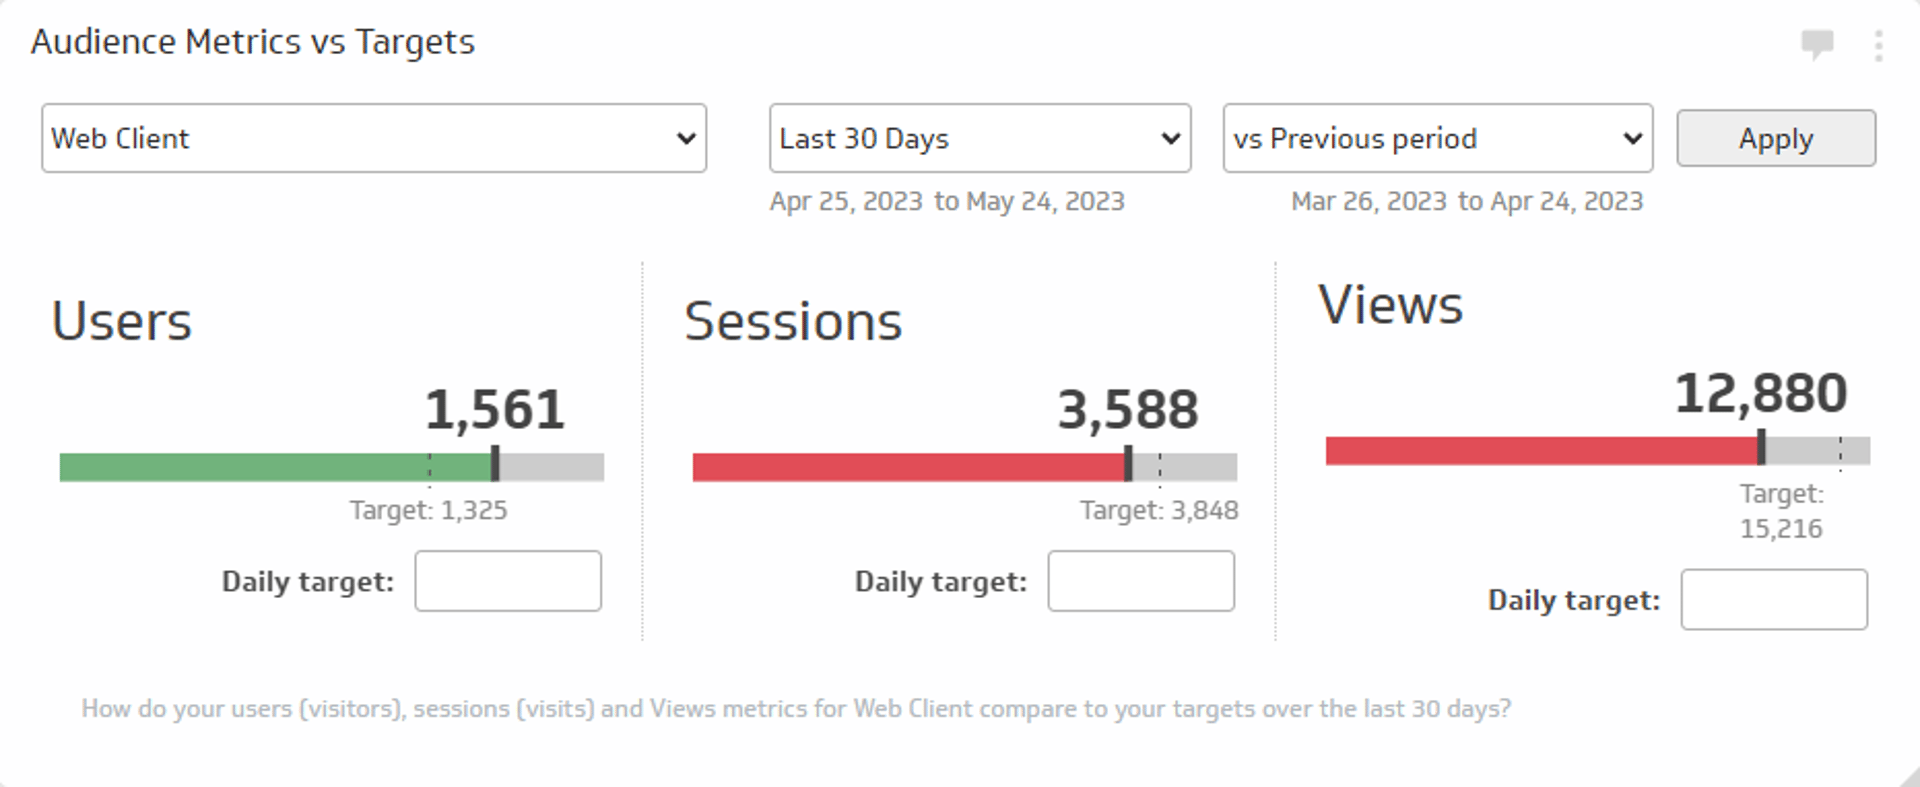
Audience Metrics vs. Targets
Track the total number of users, sessions, and views for a specific time period and compare those values to daily targets or to a previous period.
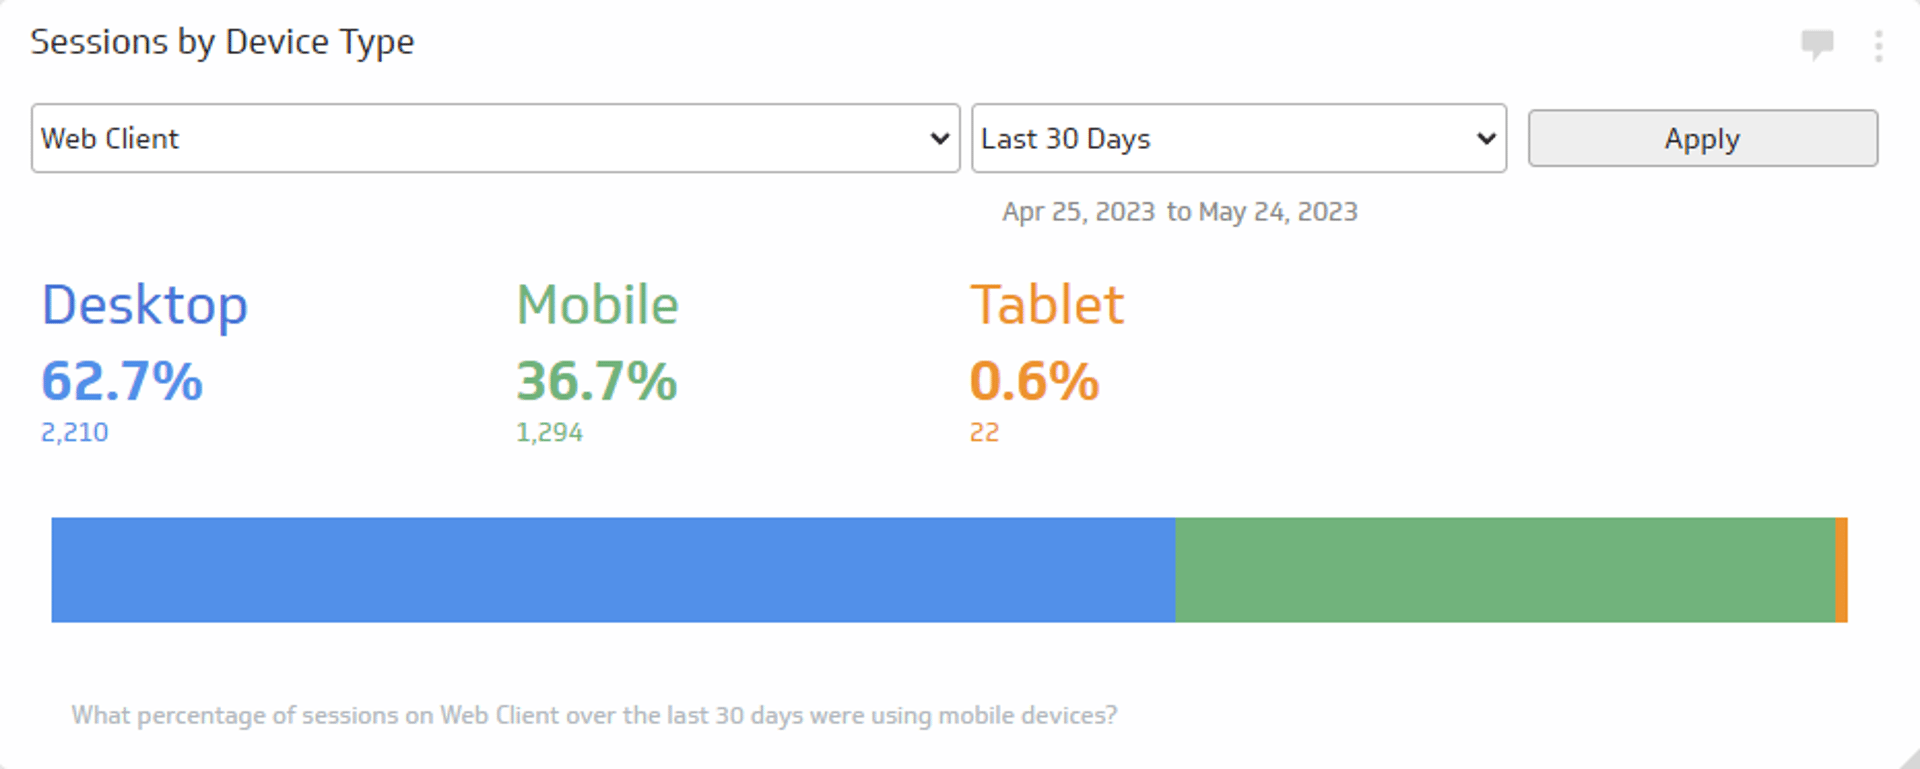
Sessions by Device Type
See what devices your website traffic is using for the time period of your choice.
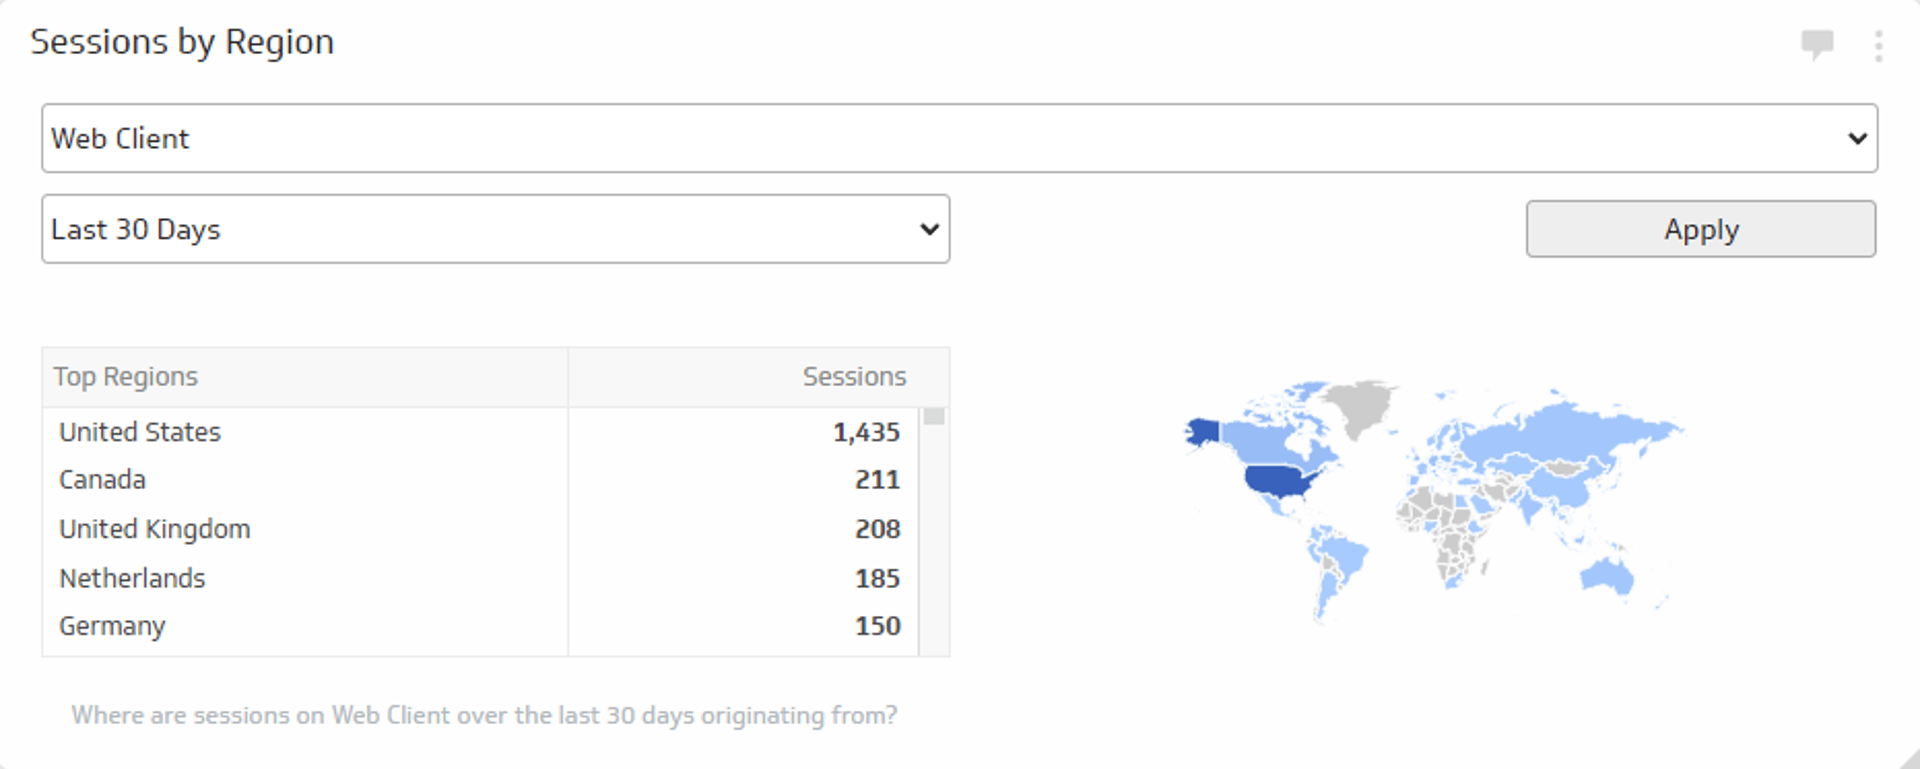
Sessions by Region
Track where around the world your website sessions are coming from during the time period of your choice.
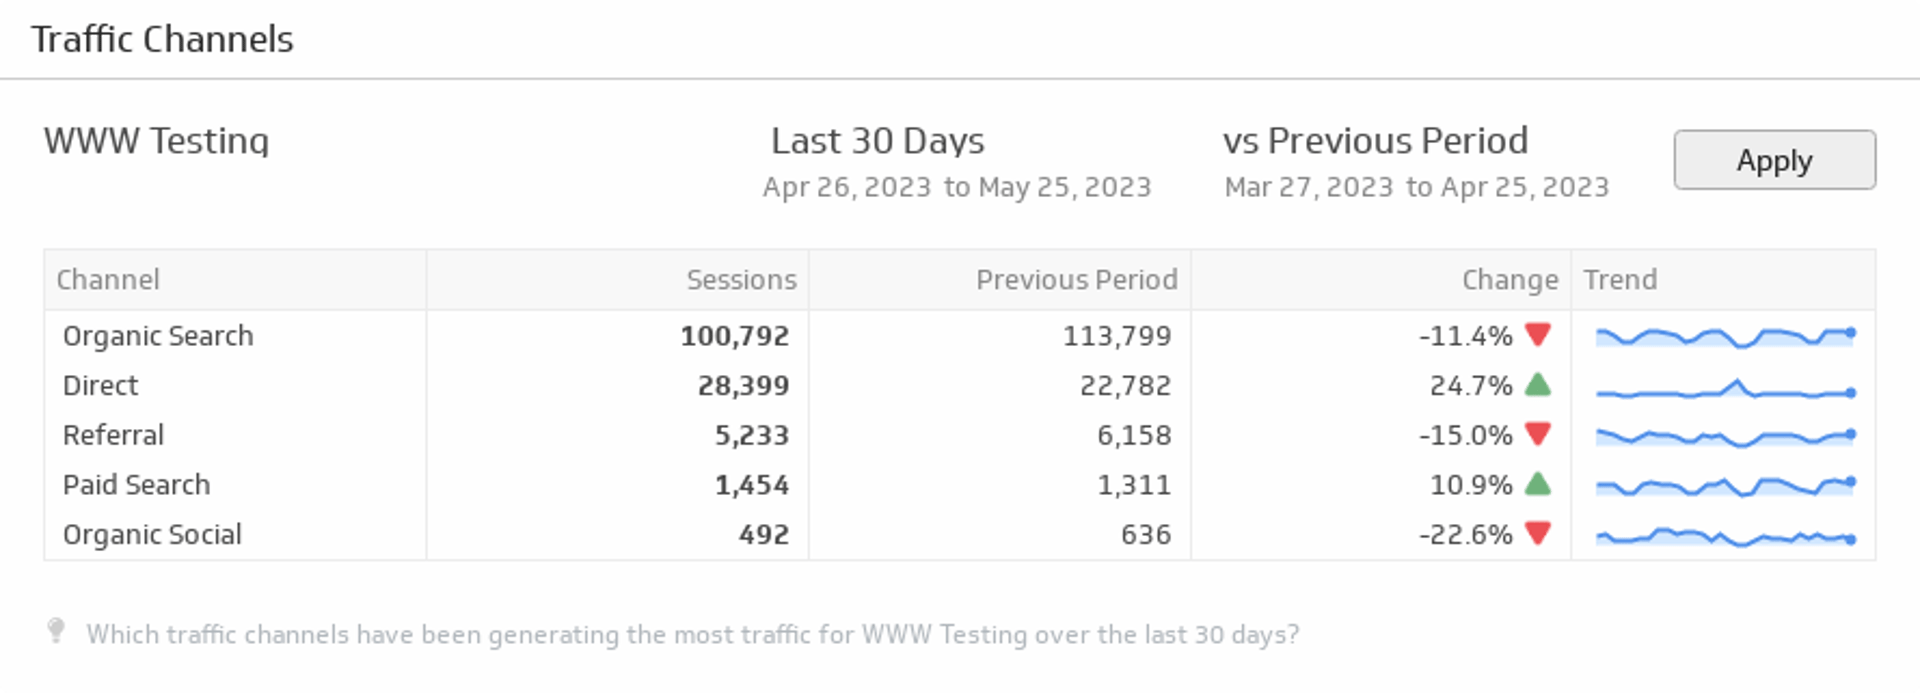
Traffic Channels
Displays the top online channels generating traffic to your website during the time period of your choice.
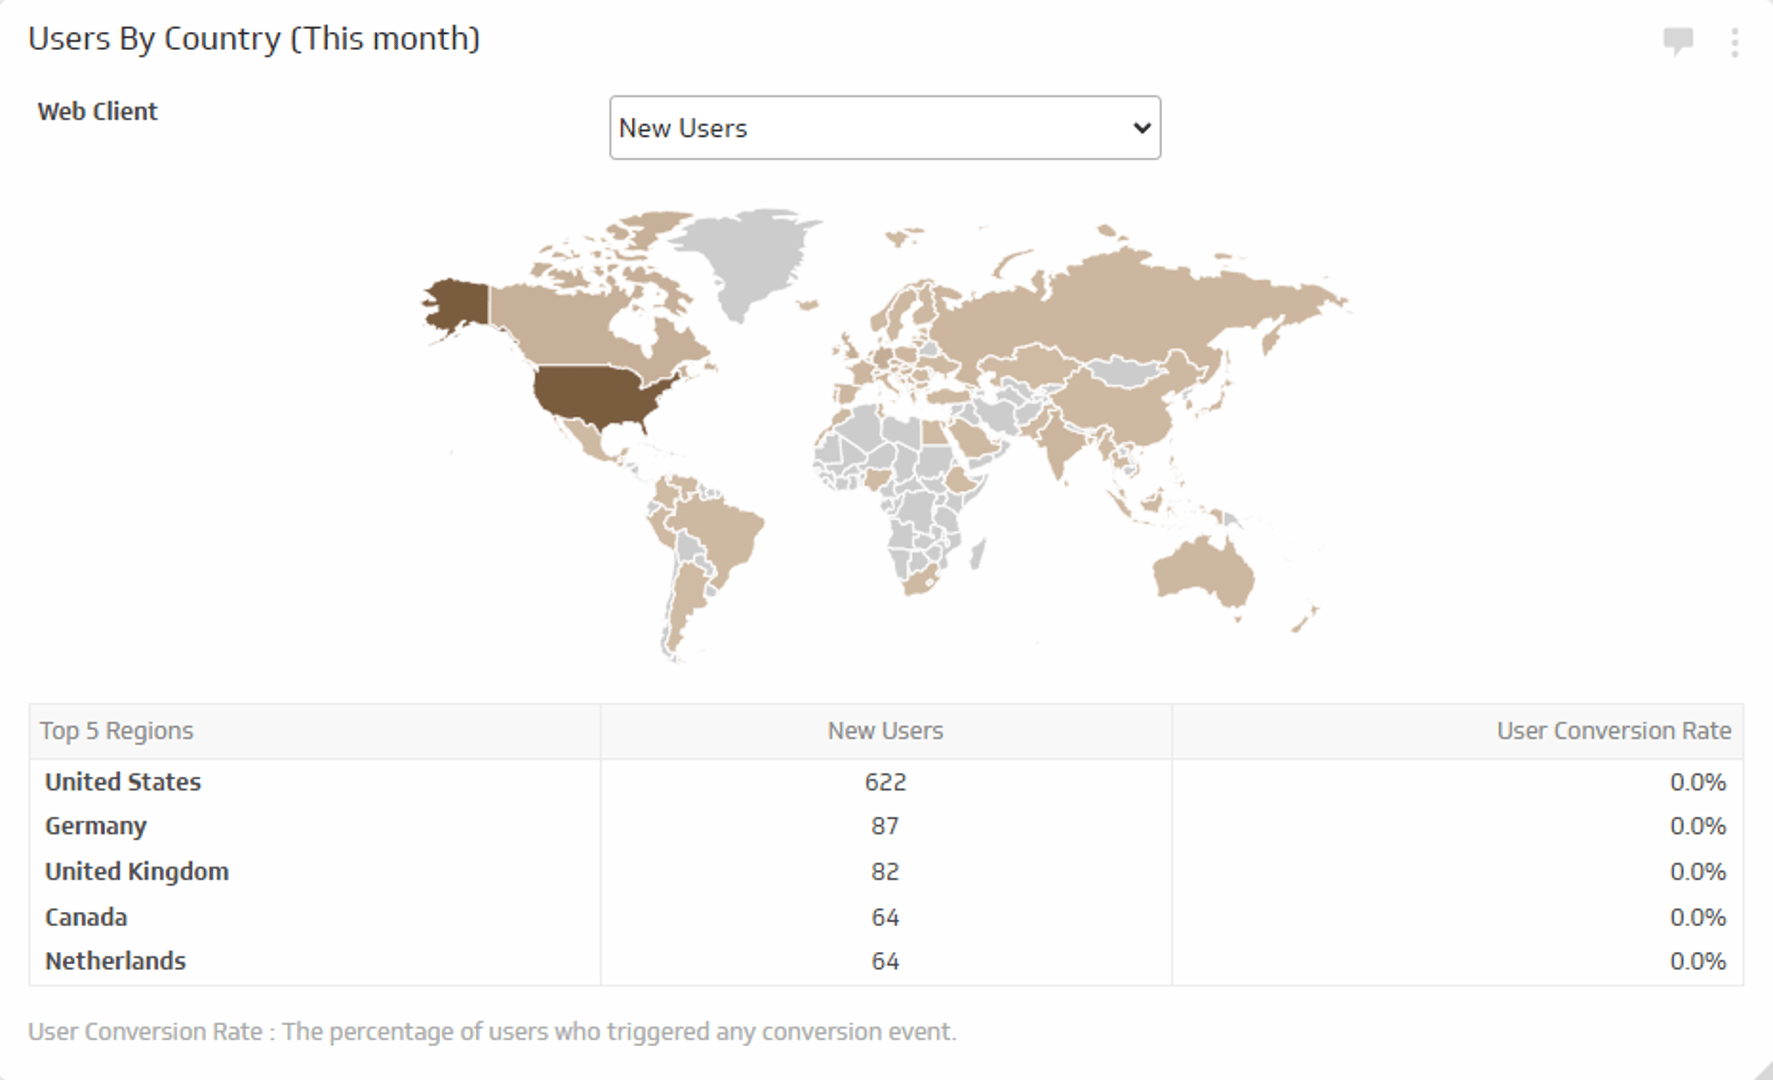
Users by Country - This Month
Track the number of new users and total users and their conversion rate for this month.
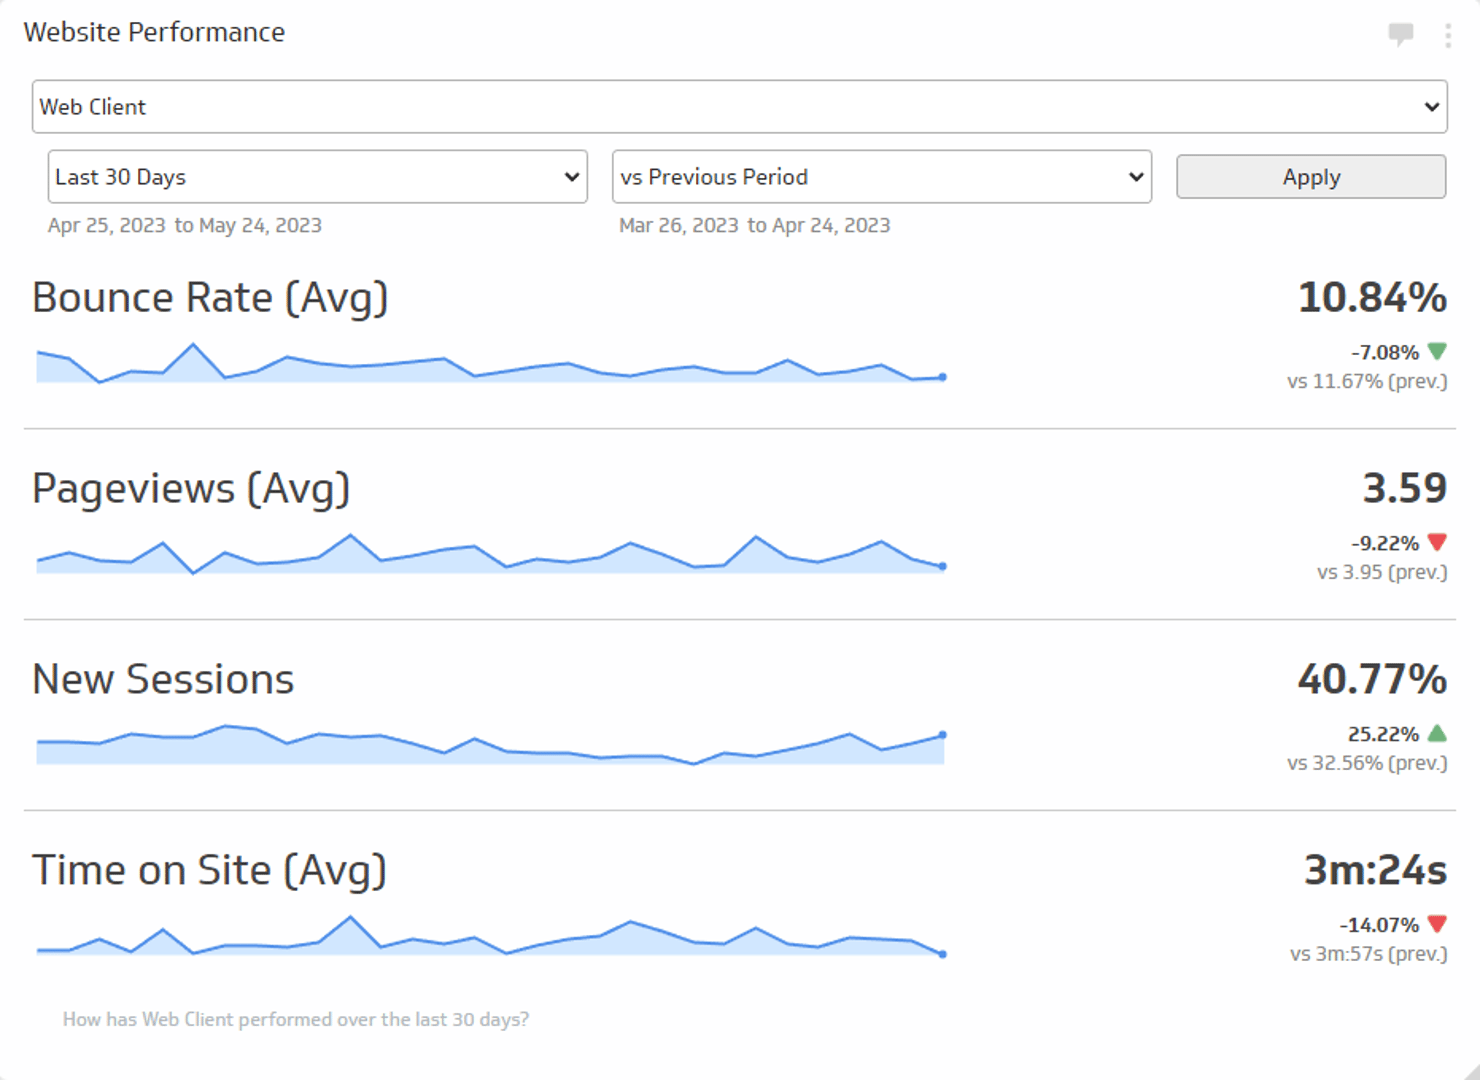
Website Performance
Track the average Bounce Rate, average Pageviews, new Sessions, and average Time on Site during the time period of your choice.

Use the Connector Gallery to create a custom Google Analytics dashboard
With our Connector Gallery, you can create custom API queries to pull in data from your Google Analytics account. Building custom queries allows you to specify the metrics and time periods that you want to track.
You can use custom queries to build out visualizations in Klipfolio. You can also combine your Google Analytics data with other relevant data to create your custom dashboard.
Learn more about working with the Google Analytics API and how you can start building your own Google Analytics queries in Klipfolio.
