The flexibility you want, the data you need.
Build a Siteimprove dashboard with Klipfolio


Build a Siteimprove dashboard with Klipfolio
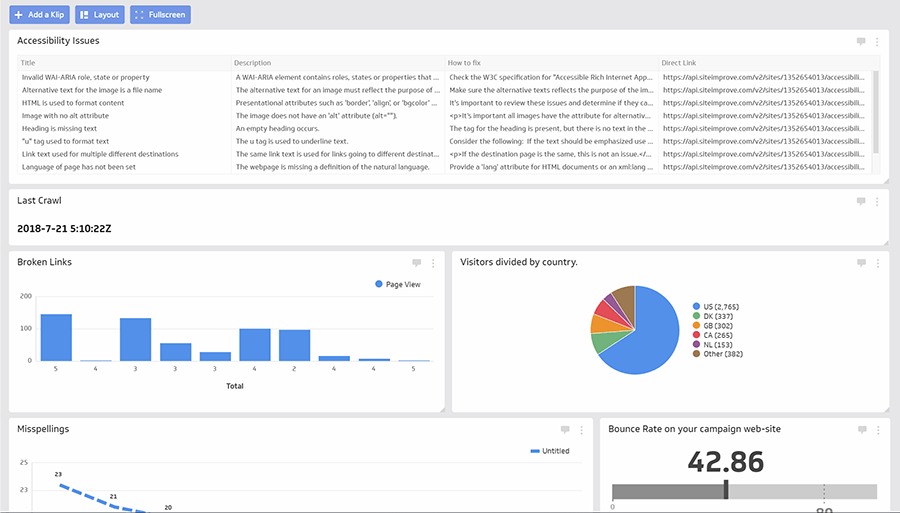
With Klipfolio, you can build custom Siteimprove dashboards to stay on top of your websites' content quality, accessibility compliance, visitor behaviour, and much more! Learn how to connect Siteimprove with your Klipfolio dashboard to monitor your website’s performance in real-time.
About Siteimprove
Siteimprove is a people-centric software company headquartered in Copenhagen, Denmark. With a worldwide customer base of more than 7,000 customers, Siteimprove serves dozens of markets from offices in Amsterdam, Berlin, Copenhagen, London, Minneapolis, Oslo, Sydney, Toronto, and Vienna. The platform transforms the way organizations manage their web presence by simplifying website management through a variety of tools.
Siteimprove’s automation software provides the clarity and direction needed to run a high-performance website. Some of their areas of expertise include Content Quality, SEO, Accessibility, Data Privacy (GDPR), and Analytics.
How to build a Siteimprove dashboard
Use the Connector Gallery to create a custom dashboard that turns Siteimprove insights into beautiful data visualizations.
Use custom Siteimprove data requests to create dashboards
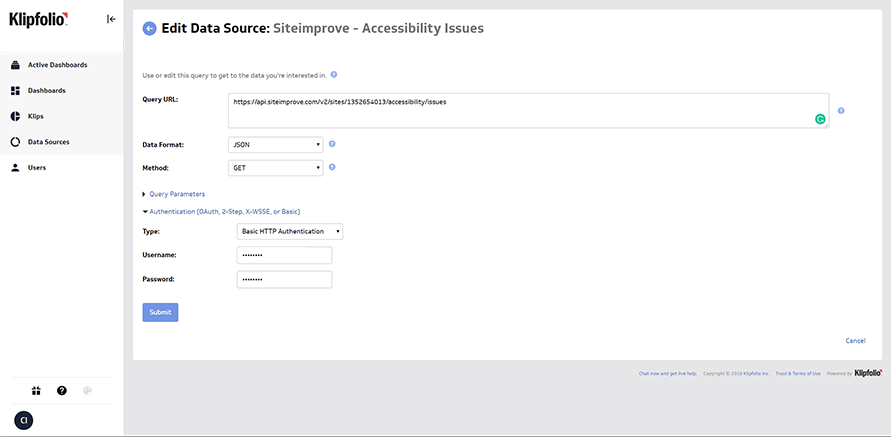
Within the Connector Gallery, you can create custom API queries to pull in data from your Siteimprove account. Building custom queries allows you to specify the metrics and time periods that you want to track.
You can use these queries to build out custom visualizations in Klipfolio. You can also combine your Siteimprove data with other relevant data sources to get a deeper understanding of how your website is performing.
Learn more about working with the Siteimprove API and how you can start building your own Siteimprove queries in Klipfolio.

