Starter Guide to LinkedIn Analytics
LinkedIn is a social media platform for professionals and businesses to share and consume business-oriented content. While LinkedIn earned its reputation as a place to network and look for a job, it’s evolved into a valuable content sharing platform for people and businesses.
Track all your LinkedIn Analytics KPIs in one place
Sign up for free and start making decisions for your business with confidence.

LinkedIn is a powerful platform for businesses, especially B2B companies, to reach their target audiences. Just like any other social media channel, you need to keep track of performance metrics and analytics on LinkedIn to know whether you’re getting returns on your marketing efforts.
Let’s explore the importance of LinkedIn analytics, the key metrics to track, and how you can use dashboards to enhance your strategy.
What is LinkedIn analytics?
LinkedIn analytics is a set of metrics and data that help you understand the performance of your LinkedIn content and activities. It includes detailed insights into how your posts, updates, and overall presence on the social platform are received by your audience.
It shows data on your followers, the engagement rate of your posts, and the demographics of your audience. As you do LinkedIn analytics, you can see which types of content resonate most with your audience, how often your posts are viewed, and how users interact with your page. This way, you can optimize your strategy for the most return on your efforts.
Why is it important to track LinkedIn analytics?
Tracking LinkedIn analytics is important since it allows you to gain deep insights into how your content performs, understand your audience, and measure the success of your marketing efforts.
Improved data-driven decision-making
Using LinkedIn analytics helps you make better decisions for your business. When you track metrics like post impressions, engagement rates, and follower growth, you get valuable data on what works and what doesn’t.
This data-driven approach allows you to refine your content strategy and target the right audience. Instead of guessing what might work, you rely on concrete data to guide your decisions, leading to more successful outcomes.
Enhanced target audience engagement and interaction
Staying on top of metrics such as likes, comments, and shares allows you to see which types of content resonate most with your followers. This information helps you tailor your content to meet the interests and needs of your audience, resulting in higher engagement rates.
Moreover, when your audience interacts more with your content, it increases your visibility and strengthens your connection with potential clients or partners.
Optimized marketing strategies and ROI
LinkedIn analytics also shows you trends and patterns that indicate which strategies are most effective. This continuous analysis allows you to adjust your tactics to improve performance and maximize return on investment (ROI).
For instance, if you notice that video posts generate more engagement, you can focus more on creating video content. Additionally, LinkedIn profile analytics tools can help you measure the effectiveness of paid campaigns to make sure that your advertising budget is spent wisely.
Best LinkedIn metrics to track
Followers, job applications, and demographics are just a few of the top LinkedIn metrics you should monitor. Let’s dive into 14 essential LinkedIn metrics and how they can benefit your strategy:
Followers
Tracking follower growth and demographics lets you see how your audience is expanding and identify key characteristics so you can tailor your content to better engage with your followers and attract new ones.
This offers valuable insights into how far your content reaches and how engaged your audience is. With this metric, you can refine your content strategy and boost overall performance on LinkedIn.
Job applications
LinkedIn known for being a powerful tool for recruitment. When you track job application metrics, you can measure how effectively LinkedIn helps you attract and hire talent. These metrics include the number of applications received, the quality of applicants, and the conversion rate from application to hire.
To optimize your recruitment efforts, use LinkedIn analytics tools to track the source of your applicants, their demographics, and the success rate of your job postings. Adjust your recruitment strategies based on this data to attract better candidates and improve your hiring process.
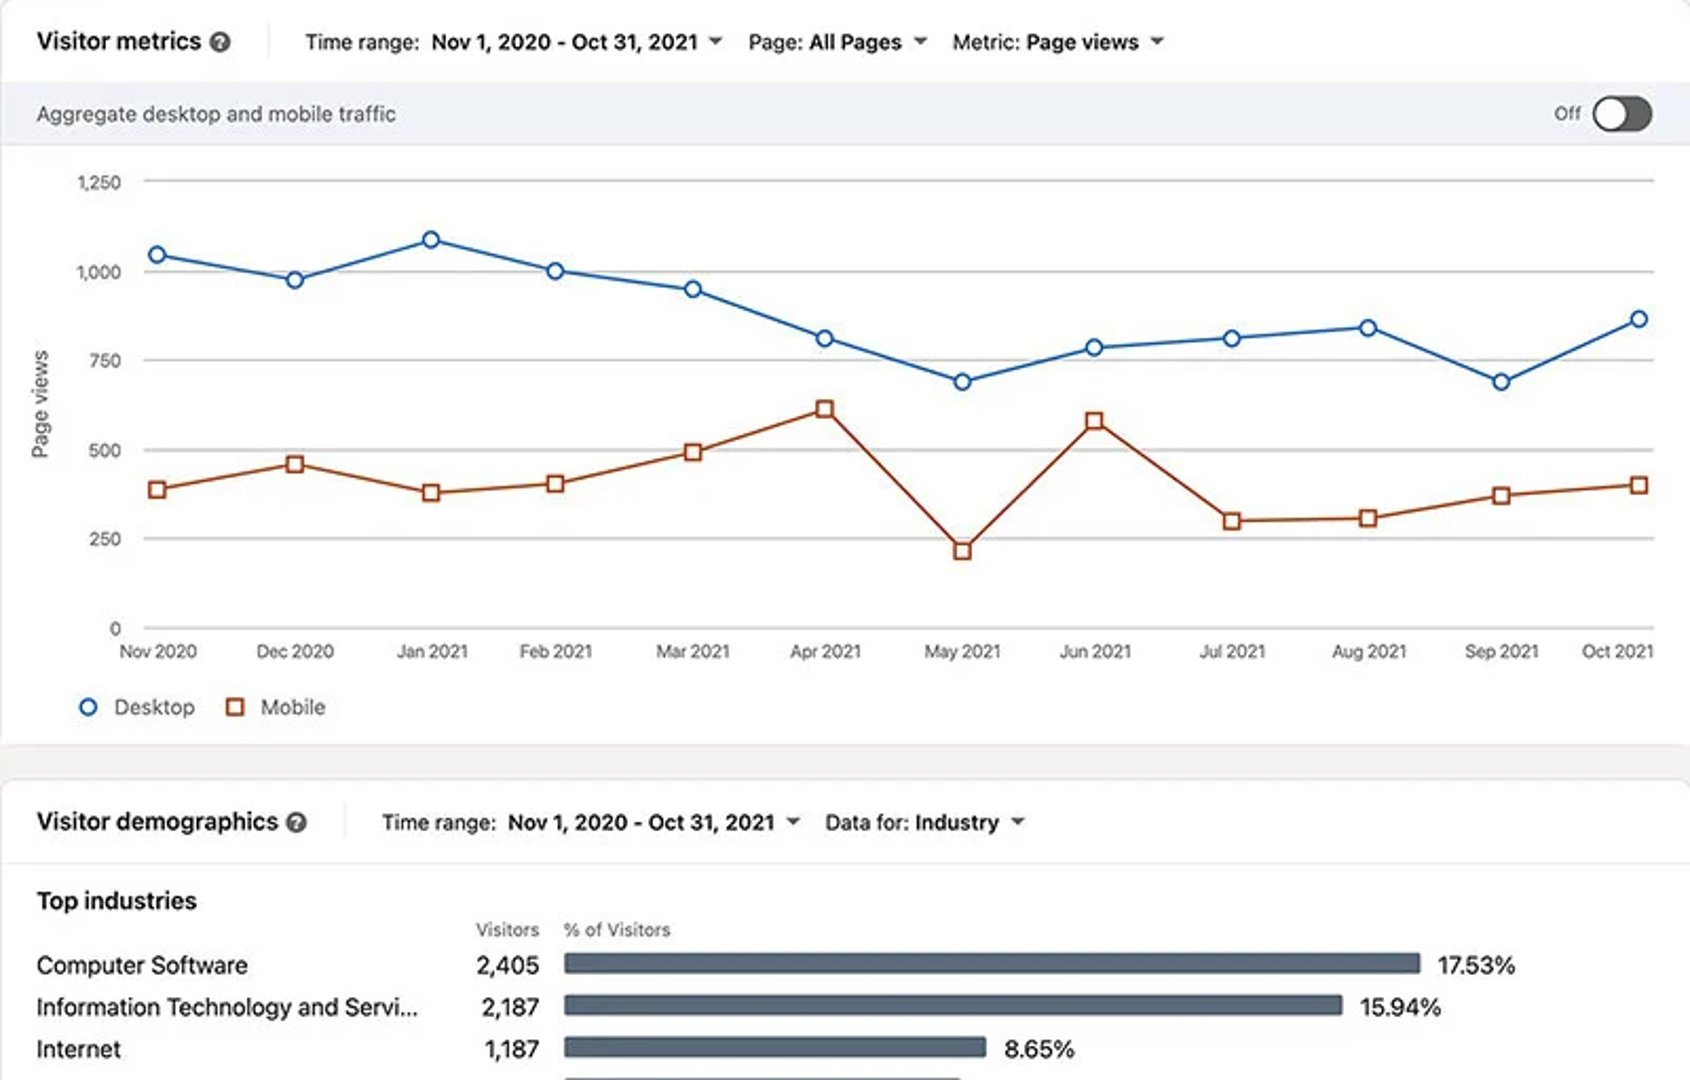
Demographics
Knowing the job functions, industries, and locations of your followers and visitors allows you to approach your content marketing in a data-driven way.
For example, if a large portion of your audience works in the tech industry, you can create posts addressing the need to stay up-to-date with the latest innovations and cybersecurity threats. You can also discuss insights on emerging technologies like artificial intelligence and blockchain in relation to your products and services.
Comments
Comments are a direct indicator of how your audience interacts with your content. As you track the number and nature of comments on your posts, you can gauge the level of engagement and understand what topics generate discussion.
The comments section is a great place to find questions from your target audience that need answers. This data is helpful in creating your content plan, especially if you feel you’ve run out of ideas.
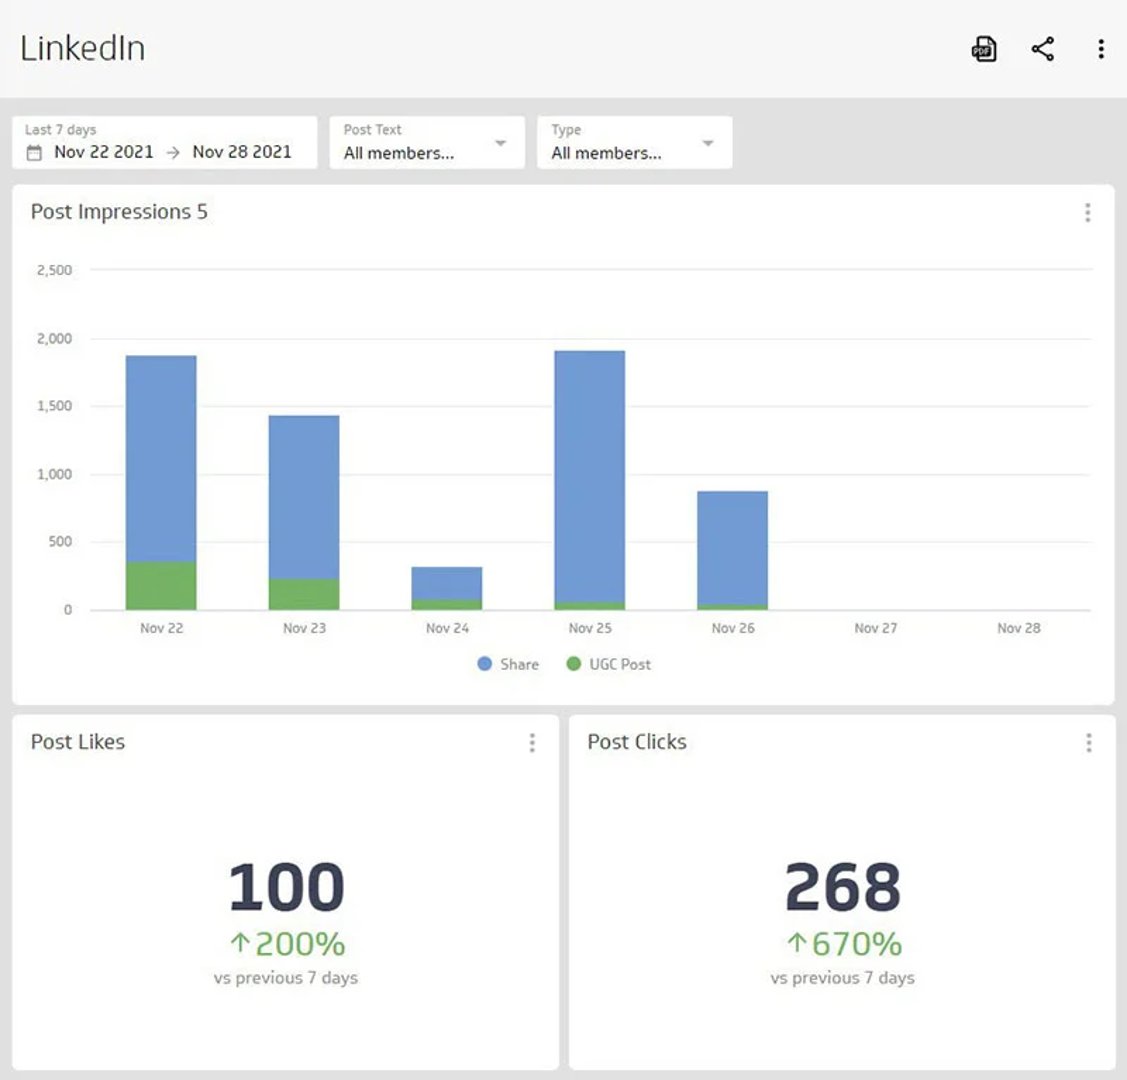
Page views
By tracking your LinkedIn page views, you can see how many distinct individuals visit your page and become interested in your content. High page views indicate that your content is attracting attention and generating interest. Use this data to identify which posts and topics are most popular and focus on creating similar content to maintain and grow your audience.
Video views
Last year, LinkedIn reported that videos increase engagement by up to five times more than other content types. That’s why you should track the number of views your videos garner to see how well they capture your audience’s attention. Analyze video metrics such as view duration and engagement rates to gain insights into your audience's preferences.
Leads generated
Lead generation metrics show how effective your posts and campaigns are at attracting potential customers and generating business opportunities. Use LinkedIn analytics tools to track leads generated from your content and campaigns and discover the strategies that are most effective.
Conversions
Conversion rates are a direct measure of how well your LinkedIn marketing efforts are turning prospects into customers. With these metrics, you can see the impact of your campaigns and identify areas for improvement.
To improve conversion rates, optimize your content and campaigns based on analytics data. Plus, make sure you’re creating clear calls-to-action, targeting the right audience, and providing valuable content that addresses your prospects' needs.
Clickthrough rate
Clickthrough rate (CTR) shows how many people clicked on your links compared to the number of impressions. This indicates the relevance and appeal of your posts.
To improve CTR, check which types of content generate the most clicks. Set time to experiment with different formats, headlines, and calls-to-action to see what works best.
Cost-per-acquisition
Cost-per-acquisition (CPA) measures how much you’re spending to get a customer through your LinkedIn advertising efforts. This is an important metric for evaluating the efficiency and ROI of your ad campaigns.
Track CPA using LinkedIn analytics tools to understand how much you’re spending to gain new customers. Optimize your campaigns by checking if you’re targeting the right audience. Then, improve your ad creatives and enhance your bidding strategy to lower your CPA and increase your ROI.
Ad clicks
Ad clicks measure the number of times users have clicked on your LinkedIn ads. Tracking this metric on your LinkedIn ads analytic dashboard helps you understand whether your ads are compelling and relevant to your target audience. Use the data you get from this metric to optimize your ad content, call-to-action, and targeting strategies.
Ad impressions
Ad impressions count the number of times your ads are displayed to users on LinkedIn. By monitoring the reach of your campaigns, you can make sure that your ads are reaching the right audience.
Campaign engagement
Campaign engagement measures the total interactions, such as likes, shares, and comments, that your ads receive. This is important for evaluating whether to continue allocating resourcing to a LinkedIn social campaign or not.
If you notice a campaign with high engagement rates, check the content and strategies that contributed to its success. Conversely, if a campaign is underperforming, review the elements that may be hindering its effectiveness.
Linkedin analytics tools
LinkedIn offers a free analytics tool that allows page admins to monitor their performance on the platform. There are also dedicated tools such as Inlytics, Keyhole, and SocialPilot. Let’s check them out:
LinkedIn Page analytics
LinkedIn provides a free analytics tool that lets page admins access various metrics to determine their content performance and audience engagement.
To access LinkedIn Page analytics, just go to your Page admin view and click “Analytics” in the left menu. You can then choose whether to check Visitors, Followers, Leads, Content, Competitors, Employee Advocacy, or Talent Brand to see specific metrics.
You can export LinkedIn analytics data as an XLS file for detailed analysis. This is useful for creating comprehensive reports and tracking performance over time. The tool also offers competitor analysis, which helps you understand where you stand and what you can do to improve your LinkedIn presence.
Inlytics
Inlytics provides a detailed LinkedIn analytics dashboard where you can view your most important LinkedIn metrics at a glance, including default LinkedIn analytics such as post impressions and views, reactions, comments, and engagement rate.
Additionally, it also helps you track these metrics:
- Timeline Content Table: Visualize your content performance over time to see when most interactions occur.
- Search Appearances: See how often you appear in LinkedIn search results.
- Connections: Monitor your current connections and how they change over time. You can also track how many new connections you have added in the last 90 days.
- Followers: View the number of followers you have and how this number changes over time.
This LinkedIn analytics tool provides real-time insights into your page’s performance. Inlytics offers a free 14-day trial and two pricing plans. The Analyze Plan costs $120/year, while the Professional Plan is priced at $200/year.
The main difference is that the Professional Plan offers unlimited data storage for historical data, while the Analyze Plan lets you track your data for up to 180 days (6 months) only.
Keyhole
One of Keyhole’s main benefits is its LinkedIn Audience Insights, which identifies the industries your followers belong to. This information can help you curate content that appeals directly to your audience.
Additionally, Keyhole lets you compare your LinkedIn account with your other social media accounts. You can see where you are receiving the most views, followers, and clicks.
Keyhole also provides insights into the average company size of your followers. You can create content specifically for small and medium-sized businesses (SMBs) or enterprises.
The tool has six pricing tiers (billed annually):
- Individual Plan - $66.75/month
- Team Plan - $141.75/month
- Pro Plan - $194.25/month
- Advanced Plan - $411.75/month
- Enterprise Plan - Starts at $833/month
- Campaign Plan - Custom Pricing
With Keyhole, you can fine-tune your content to match your audience's preferences. It helps you see where you're performing best across different social media platforms and tailor your approach accordingly.
SocialPilot
SocialPilot is a more comprehensive social media management tool that also offers LinkedIn analytics. It lets you schedule LinkedIn posts and track how well your content engages your audience.
The tool boasts an intuitive interface that makes it a breeze to onboard team members and a 360-degree view of performance for easy access to complete analytics, including for LinkedIn.
It also has a free 14-day trial and four pricing tiers (billed annually):
- Professional Plan - $25.50/month
- Small Team Plan - $42.50/month
- Agency Plan - $85.00/month
- Agency+ Plan - $170.00/month
SocialPilot's platform simplifies team collaboration and offers a comprehensive overview of analytics for LinkedIn content. It allows scheduling posts and monitoring LinkedIn engagement metrics for a streamlined social media management process.
Using dashboards to track LinkedIn metrics
A well-designed dashboard lets you monitor key metrics such as engagement, impressions, and follower growth in one centralized location. This helps you understand how your content is performing and make data-driven decisions to improve your LinkedIn strategy.
To set up a LinkedIn analytics dashboard, you must first choose a LinkedIn analytics tool. Klipfolio PowerMetrics offers a user-friendly interface and powerful features that help you track and optimize your LinkedIn performance.
Here’s how Klipfolio PowerMetrics can enhance your LinkedIn analytics:
- Curated metrics: PowerMetrics provides a catalog of predefined metrics that you can use to track your LinkedIn performance.
- Self-serve data access: Business users can access and analyze data independently, reducing reliance on data teams.
- No-code visualization: Create visualizations and dashboards without writing any code, making it accessible to everyone.
- Integration capabilities: PowerMetrics integrates with various data sources, making sure your LinkedIn metrics are accurate and up-to-date.
PowerMetrics lets you monitor LinkedIn metrics in real-time for up-to-date insights. It also lets you store and manage your metrics in one place and tailor your dashboard to display the metrics you want to track.
Once you’ve downloaded PowerMetrics, connect your LinkedIn account and customize the dashboard. What’s best is that you don’t need extensive technical knowledge to display relevant metrics on PowerMetrics. As such, users can analyze data independently without relying on technical teams.
Leveraging LinkedIn analytics
LinkedIn analytics can help you expand your reach on the professional networking platform by providing valuable insights into your content performance and audience engagement. With Klipfolio PowerMetrics, you can track key metrics and visualize data trends to grow your following. More importantly, PowerMetrics can help increase your chances of converting followers into customers.
FAQs
How far back can you see LinkedIn analytics?
LinkedIn analytics provides various timeframes for different types of content. Video performance analytics and demographic breakdowns are available for 180 days, while article performance analytics and demographic breakdowns are available for 730 days.
For all other content types, impression counts and engagement counts are available for 1,000 days, while demographic breakdowns are available for 180 days. Additionally, you can review audience analytics for up to 365 days.
What is considered a “good” reach on LinkedIn?
A “good” reach on LinkedIn can vary depending on your industry and the size of your network. Generally, a post reach that engages at least 2-3% of your followers is considered effective. High engagement rates, such as likes, comments, and shares, also indicate a successful reach, showing that your content resonates with your audience.
What's the most important metric on LinkedIn?
While several metrics are crucial, engagement rate is often considered the most imnce by measuring interactions such as likes, comments, and shares. High engagement rates indicate that your content is relevant and compelling to your followers.
How often does LinkedIn’s algorithm refresh?
LinkedIn's algorithm refreshes regularly, typically every few hours. This frequent updating ensures that the most relevant and engaging content is shown to users, based on their interactions and preferences.
Staying active and consistently posting high-quality content can help you benefit from these algorithm updates.
Does LinkedIn have post analytics?
Yes, LinkedIn provides post analytics that offers insights into the performance of your individual posts. You can see metrics such as impressions, clicks, reactions, comments, and shares. This data helps you understand which types of content are most effective and how your audience is engaging with your posts.
Additional LinkedIn Analytics Resources
- Video: How to use the LinkedIn Pages API
- Blog: Top 10 LinkedIn Analytics Metrics
- Article: Adding LinkedIn Pages Metrics
- Article: Adding LinkedIn Ads Metrics