LinkedIn Analytics Dashboard
Measure your organic LinkedIn content strategy.
What is a LinkedIn Analytics Dashboard?
A LinkedIn Analytics Dashboard displays the metrics and KPIs for your organic LinkedIn content strategy. Building one helps you understand how your content performs, whether you're reaching your target audience, and how people engage with what you share.
A LinkedIn Analytics Dashboard answers questions like:
How many people are seeing my content? Track reach and impressions over time.
How does my audience engage? Distinguish between active engagement (comments) and passive engagement (likes).
What content performs best? Identify which post types and topics drive the most interaction.
Use these insights to shape LinkedIn as a meaningful part of your organic social media marketing strategy.
What metrics should you include on a LinkedIn dashboard?
The metrics below give you a clear picture of your LinkedIn performance. Each one reveals a different dimension of reach, audience growth, or engagement.
.png)
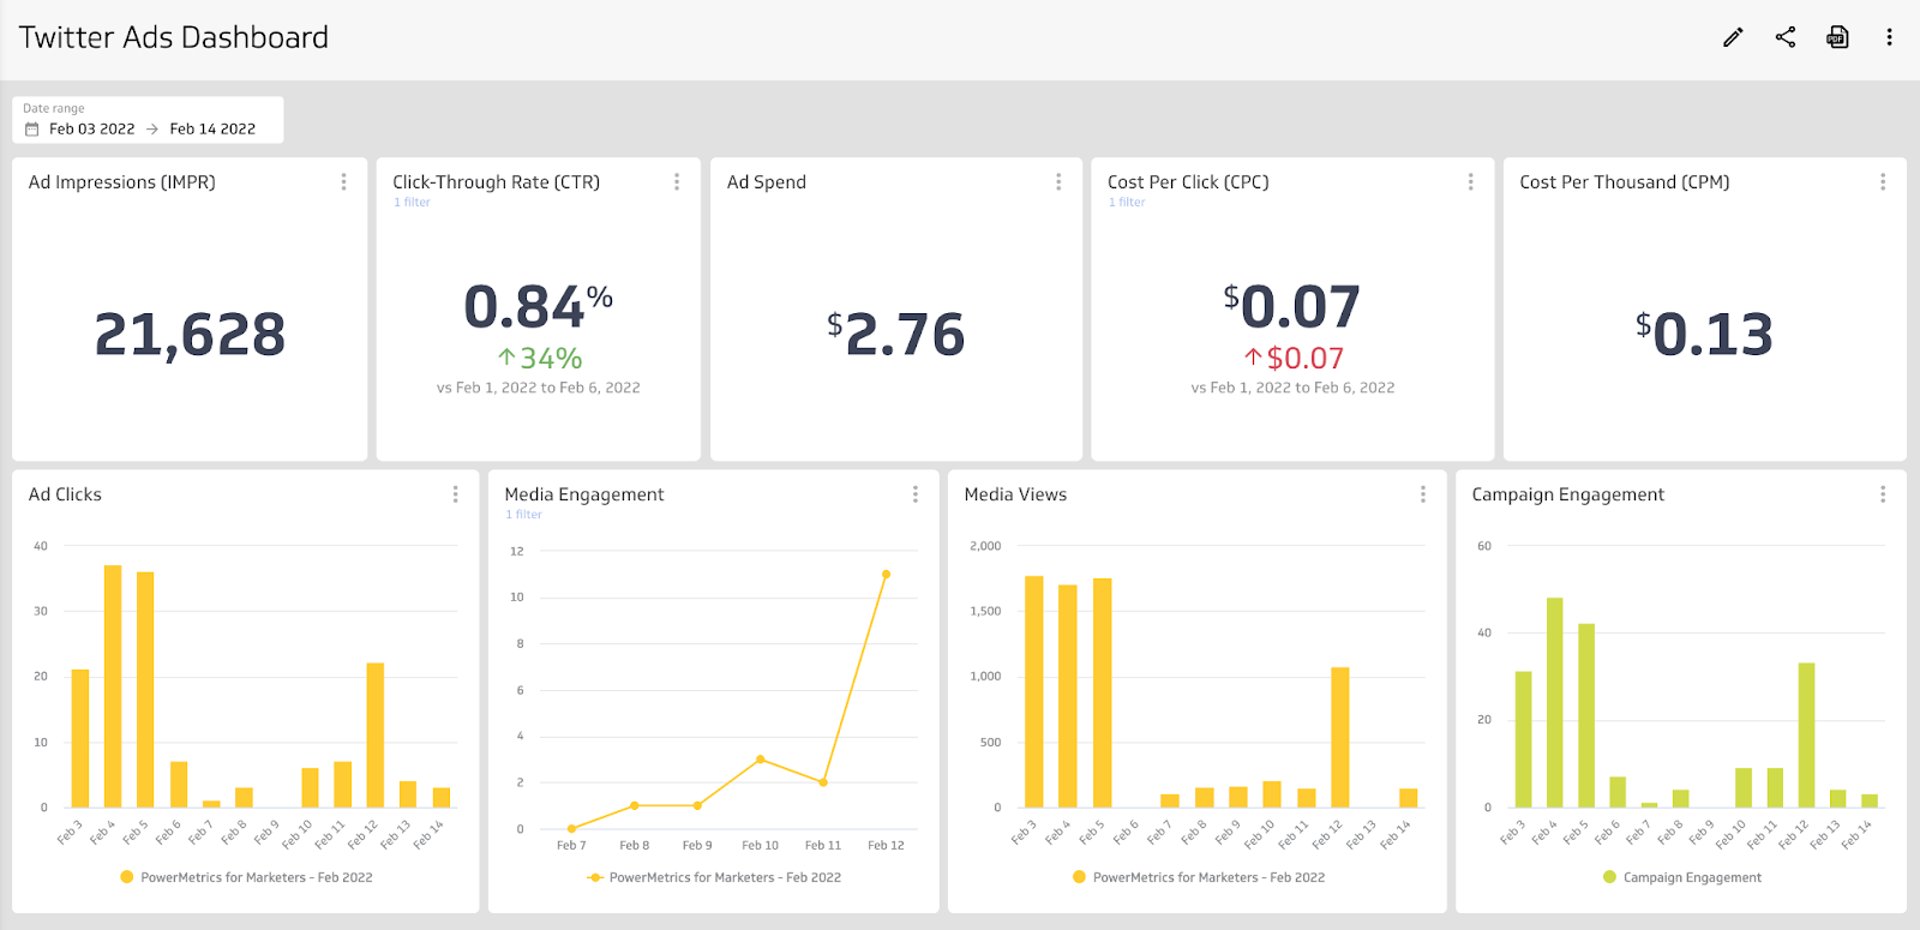
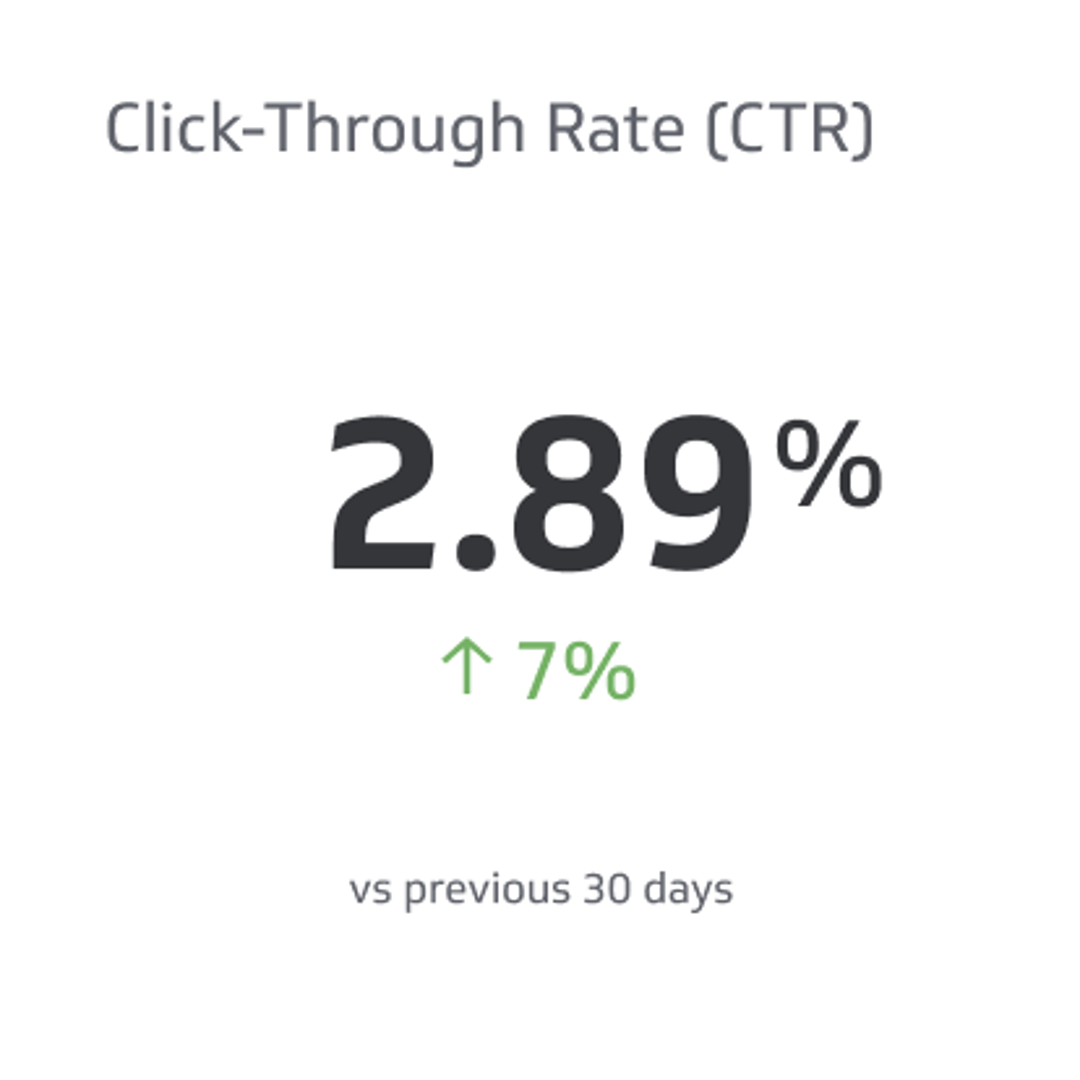
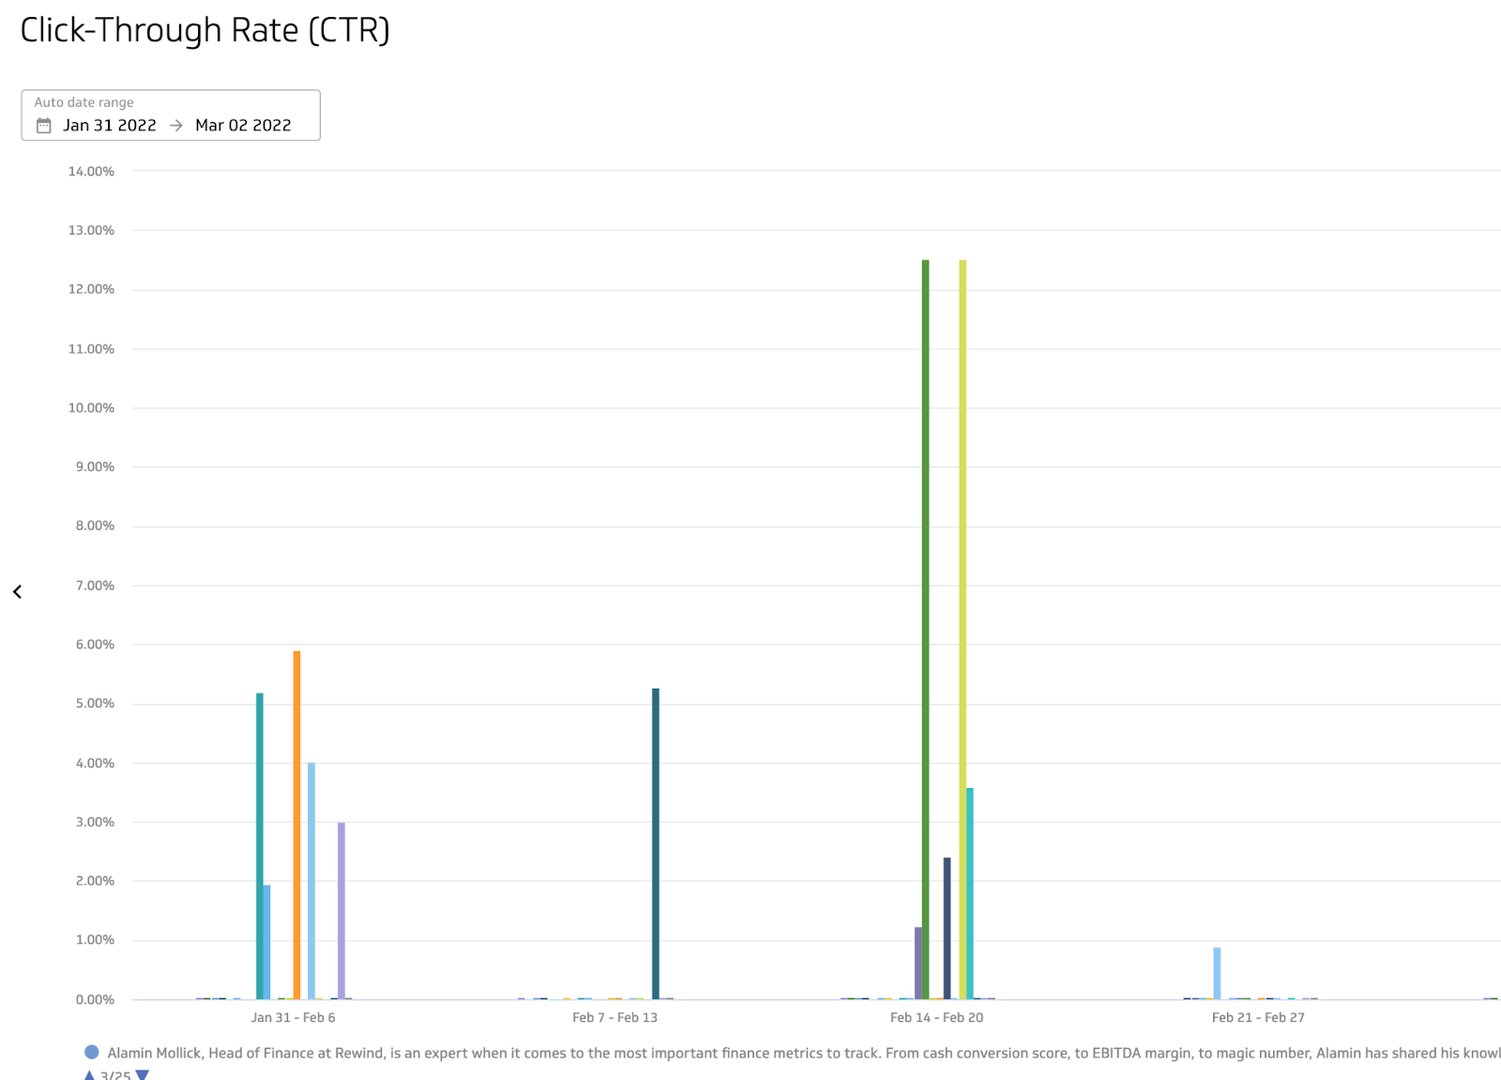
Click-Through Rate (CTR)
Click-Through Rate (CTR) is the percentage of impressions that result in a click on your link. A rising CTR signals that your content is compelling enough to drive action.
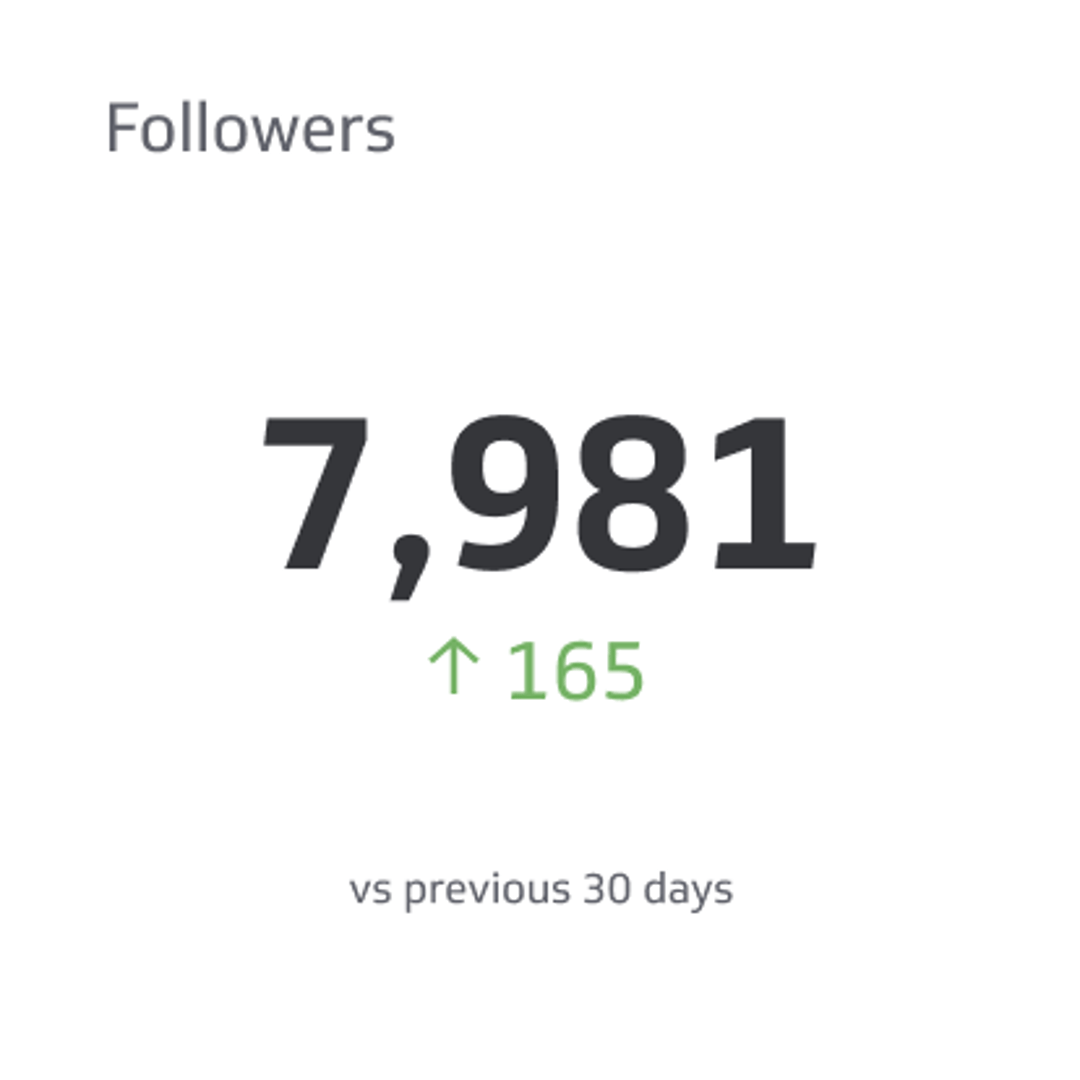
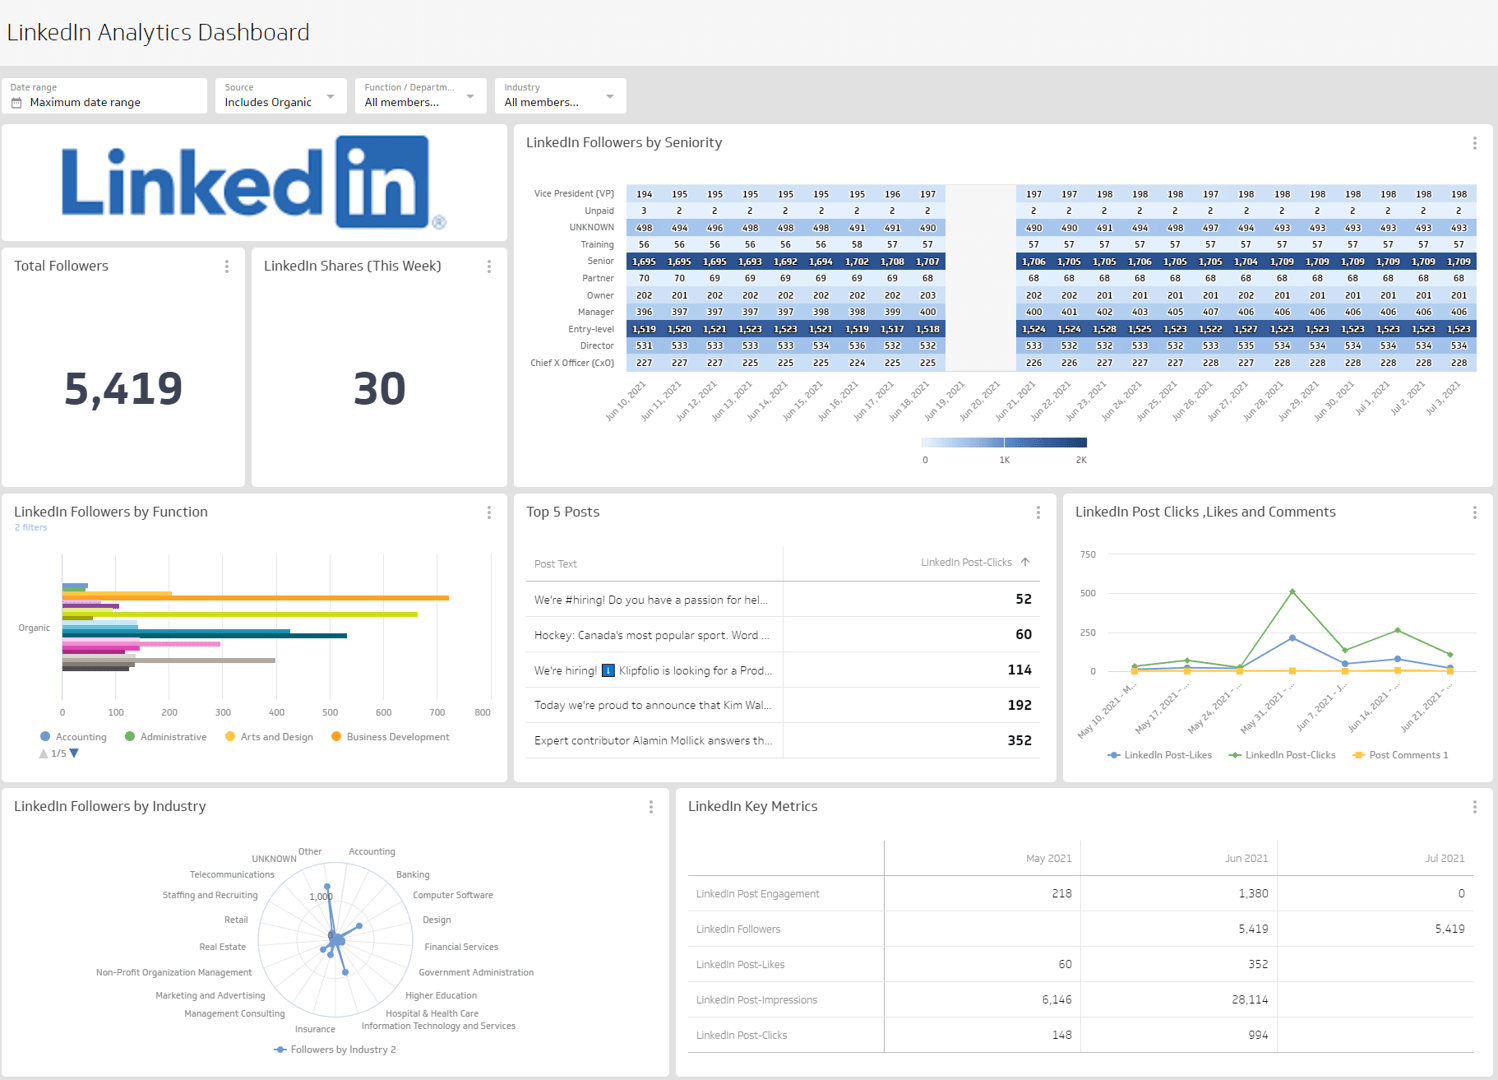
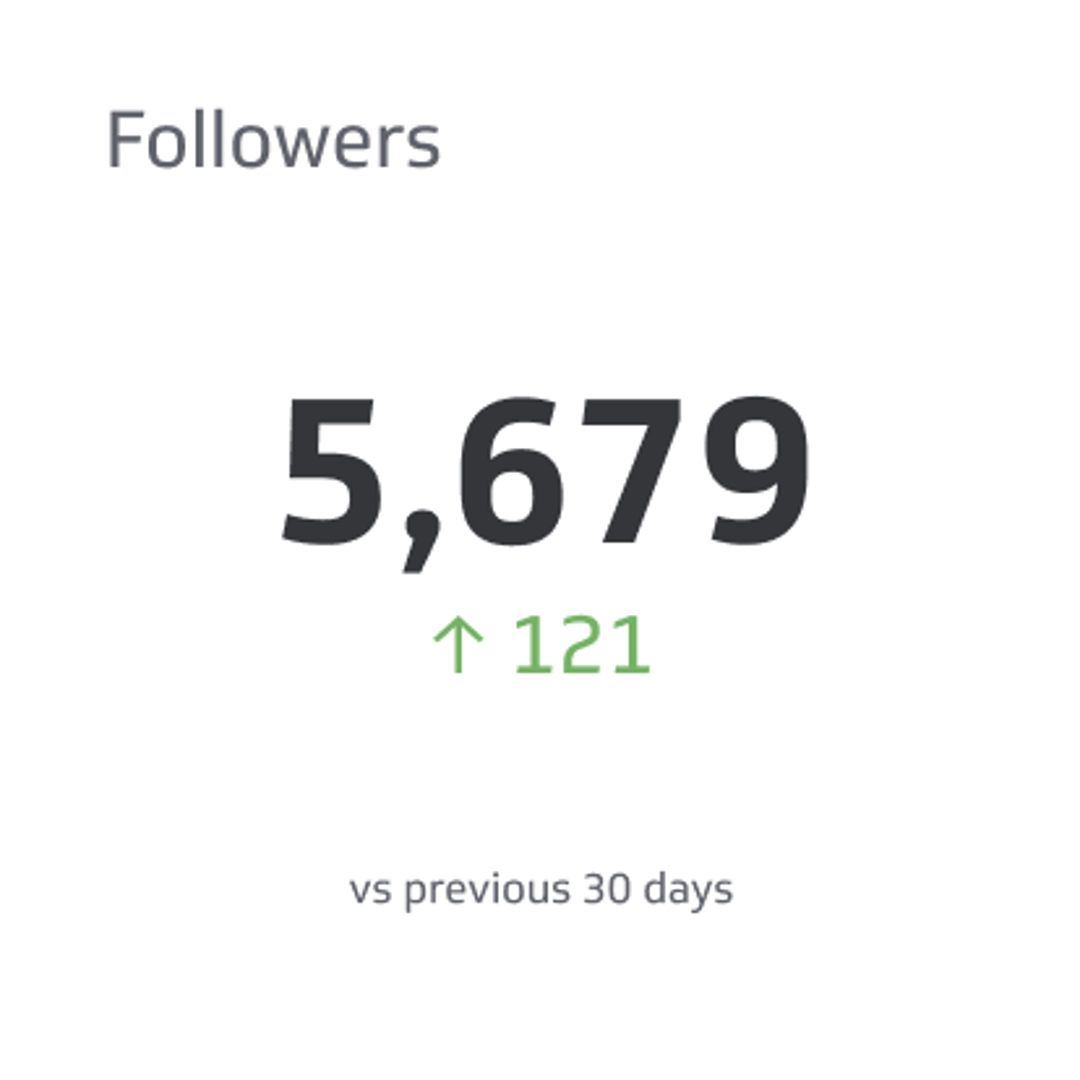
Followers
Followers is the number of users who have chosen to follow your company's posts. Tracking follower growth over time shows whether your brand is building an audience on the platform.
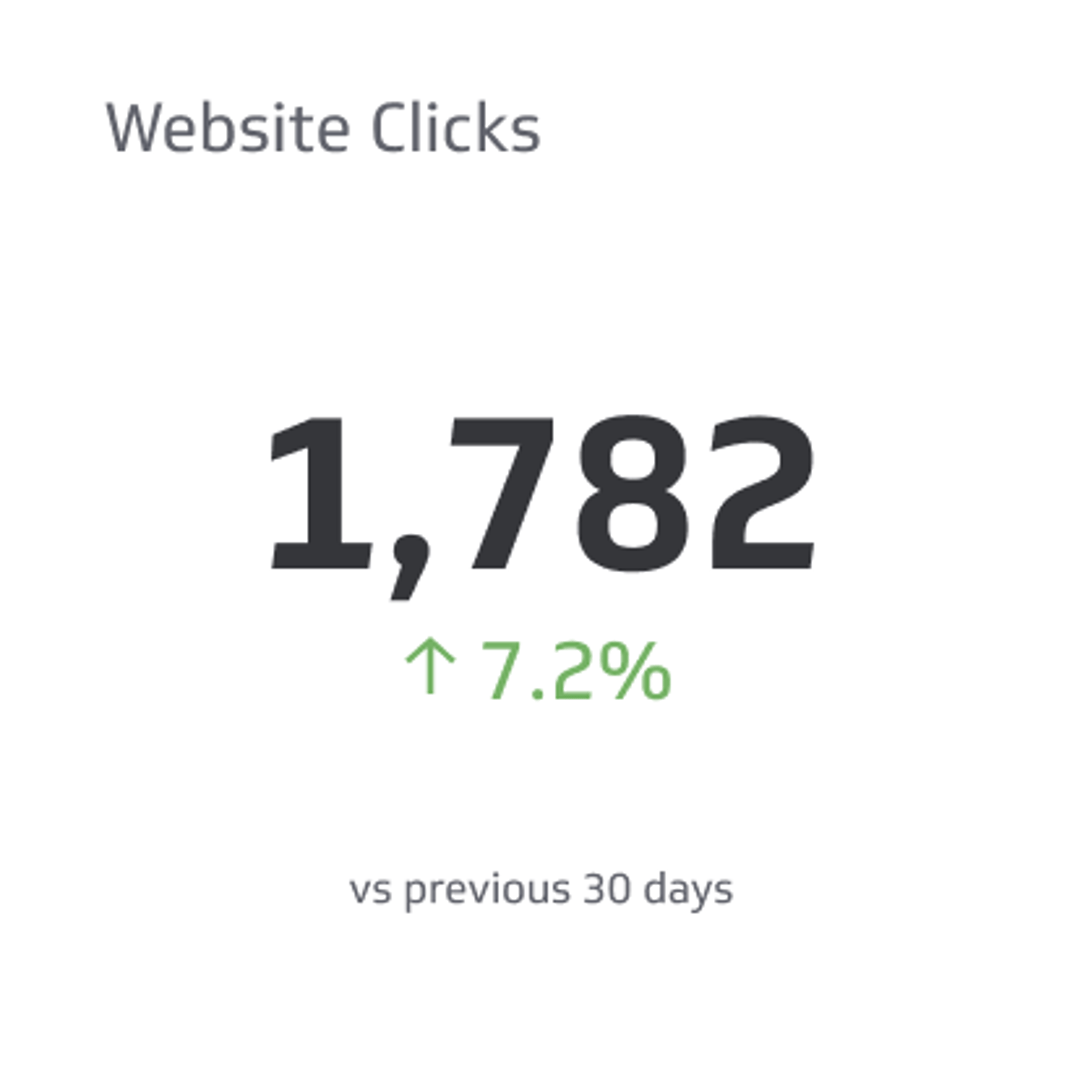
Website clicks
Website Clicks counts the number of times people clicked the link to your website from your LinkedIn profile. It connects your LinkedIn presence directly to traffic and downstream conversions.
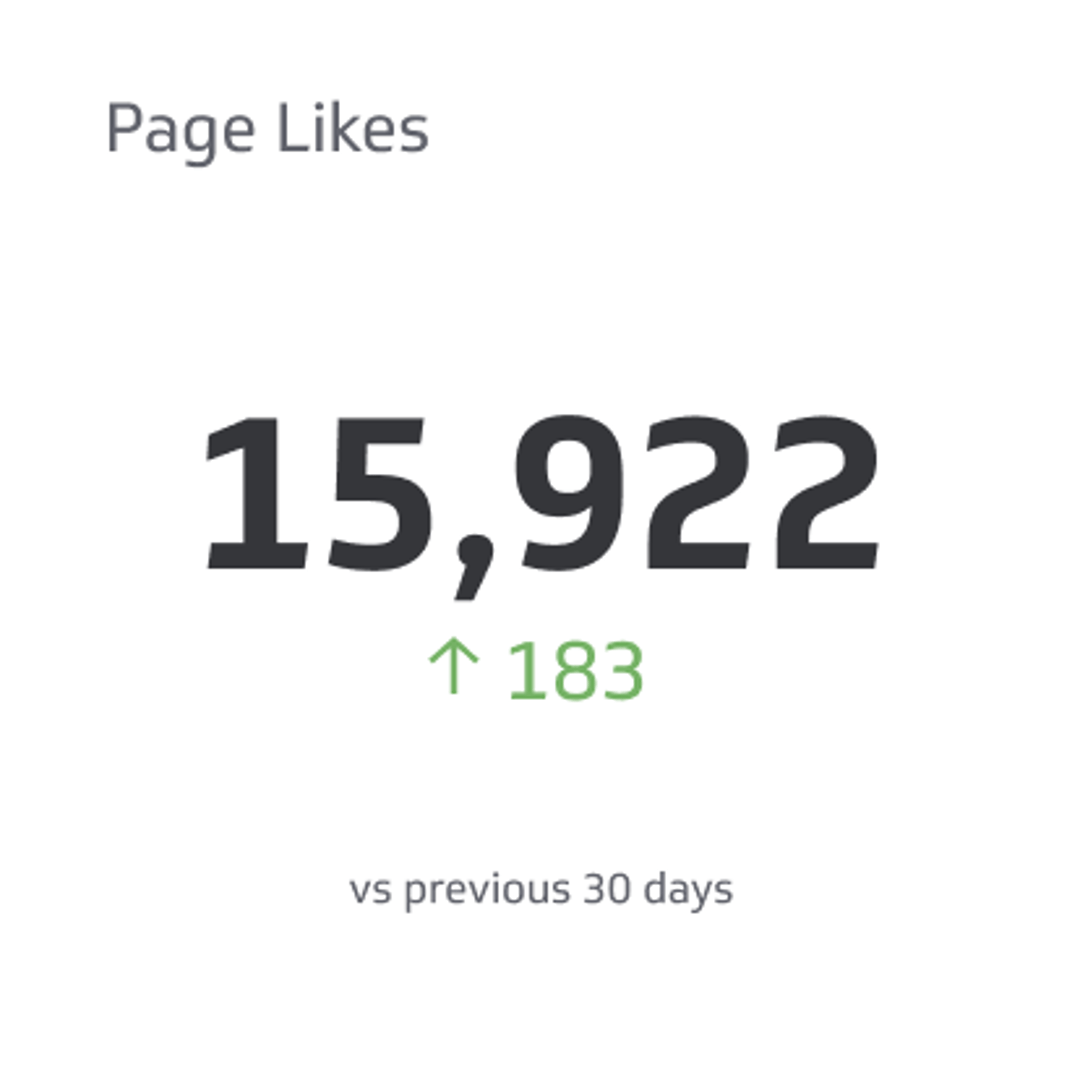
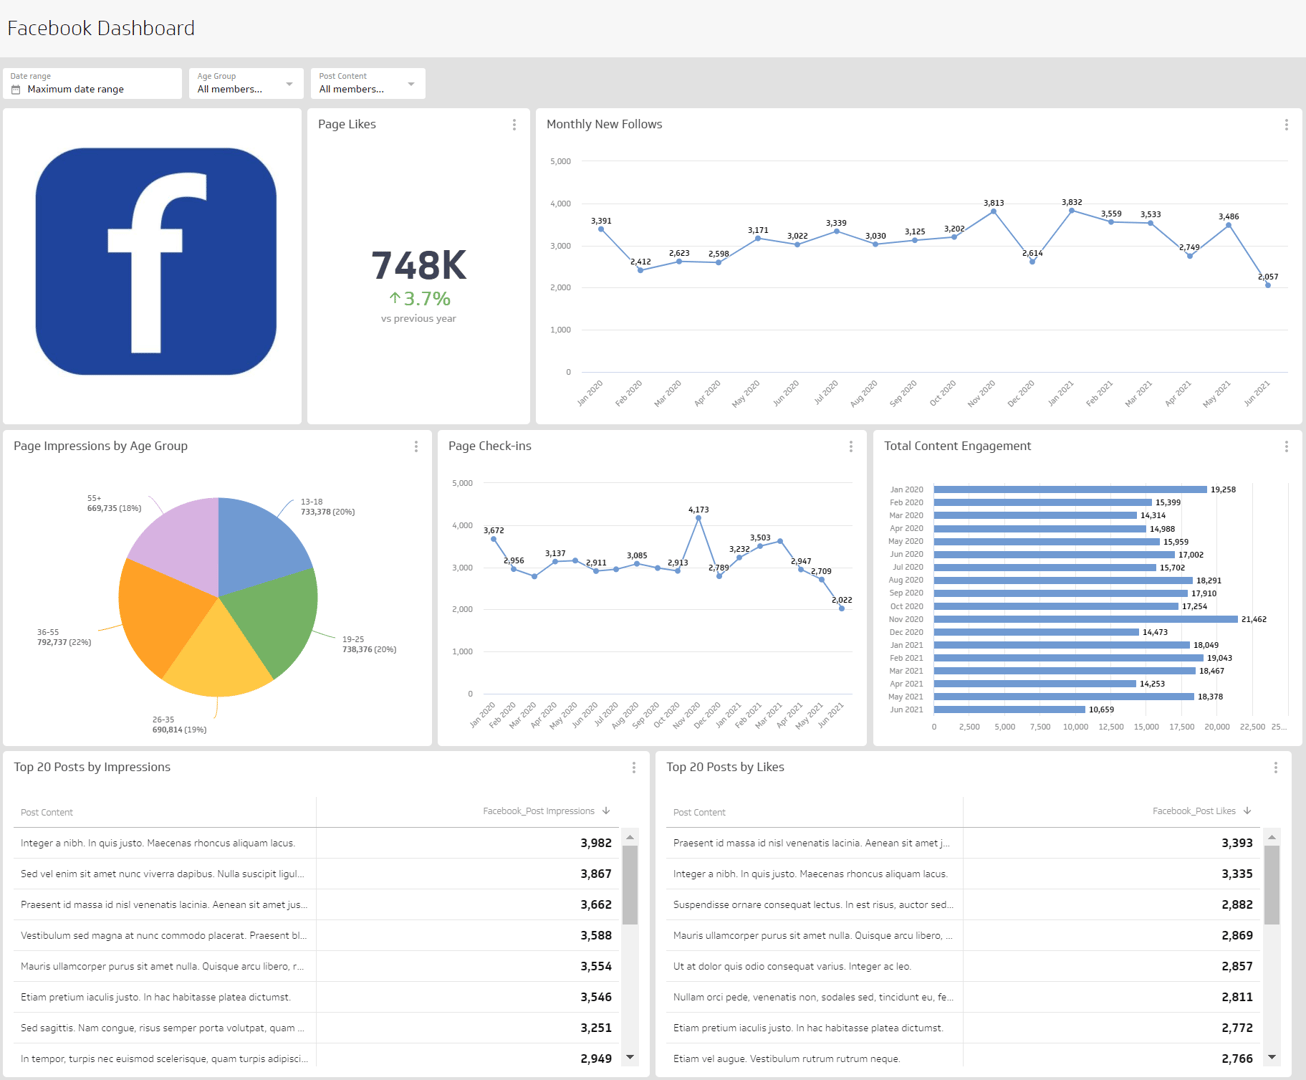
Page likes
Page Likes counts the number of unique visitors who have liked your page. It's a lightweight signal of brand affinity.
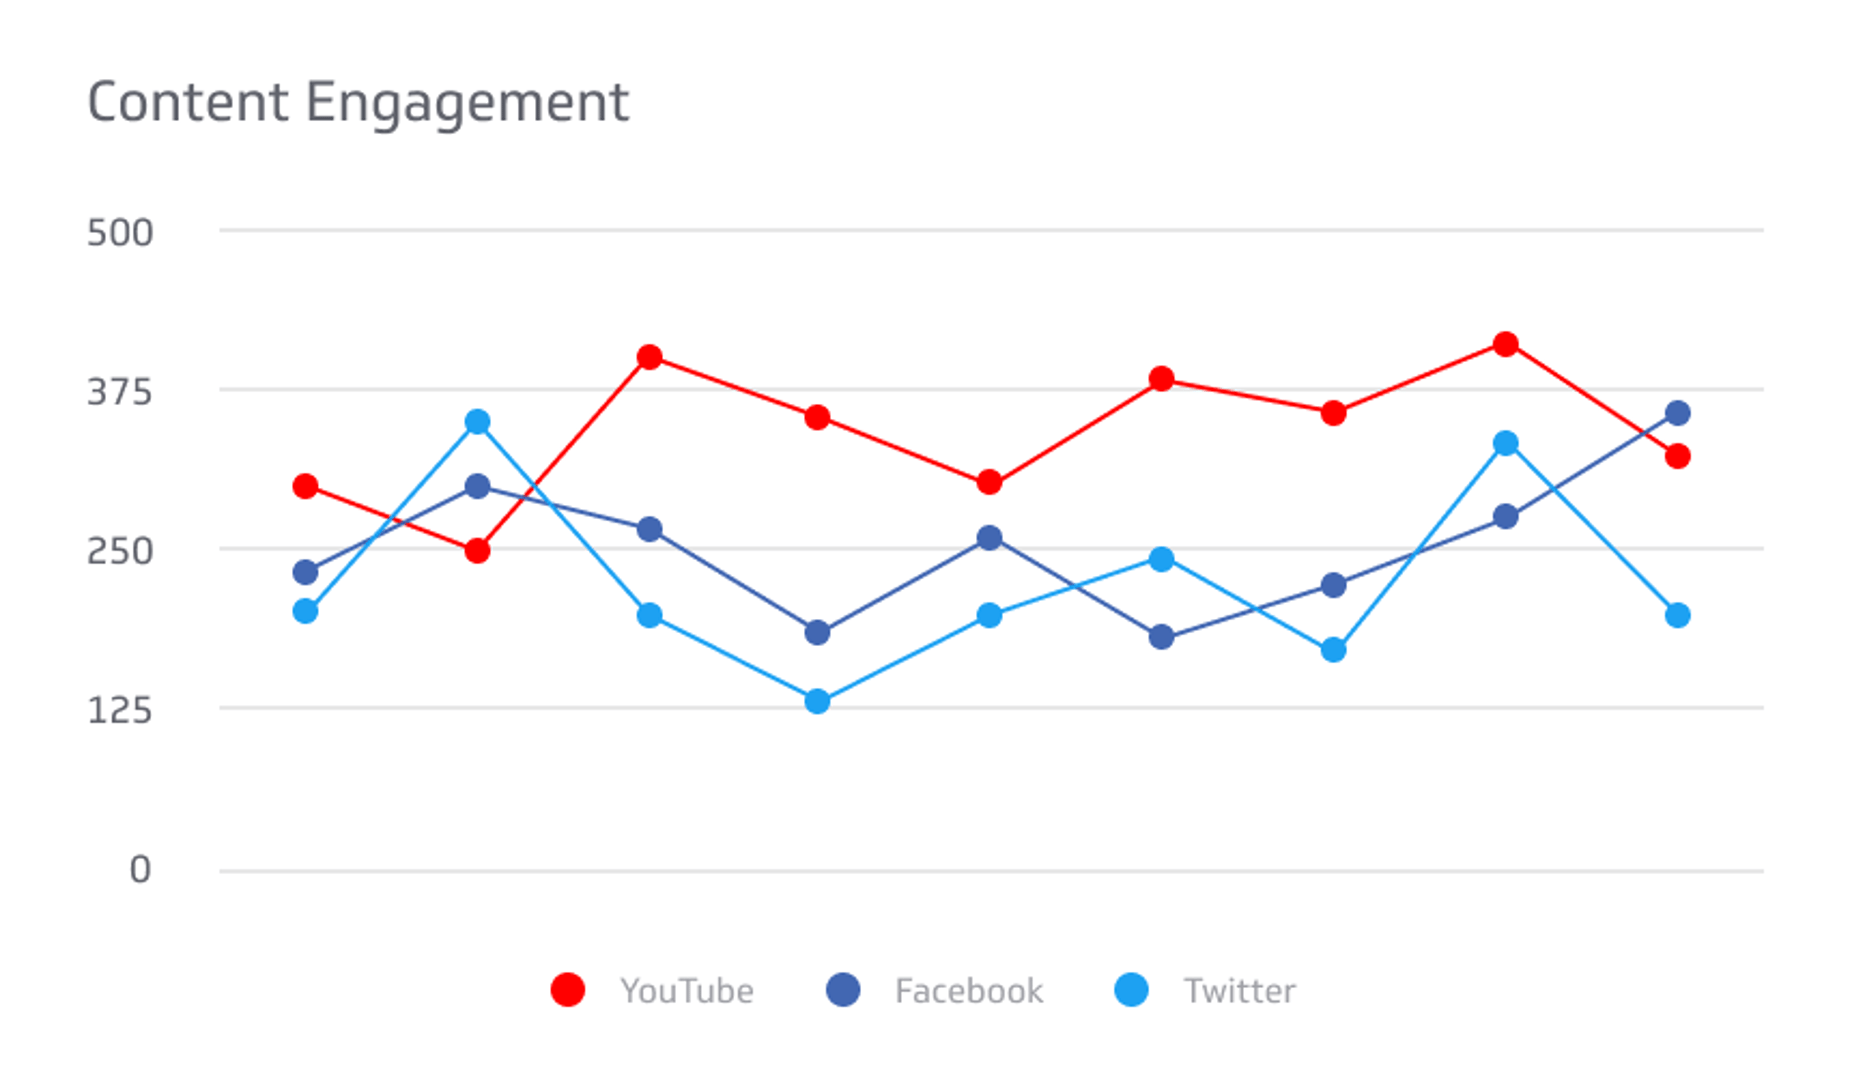
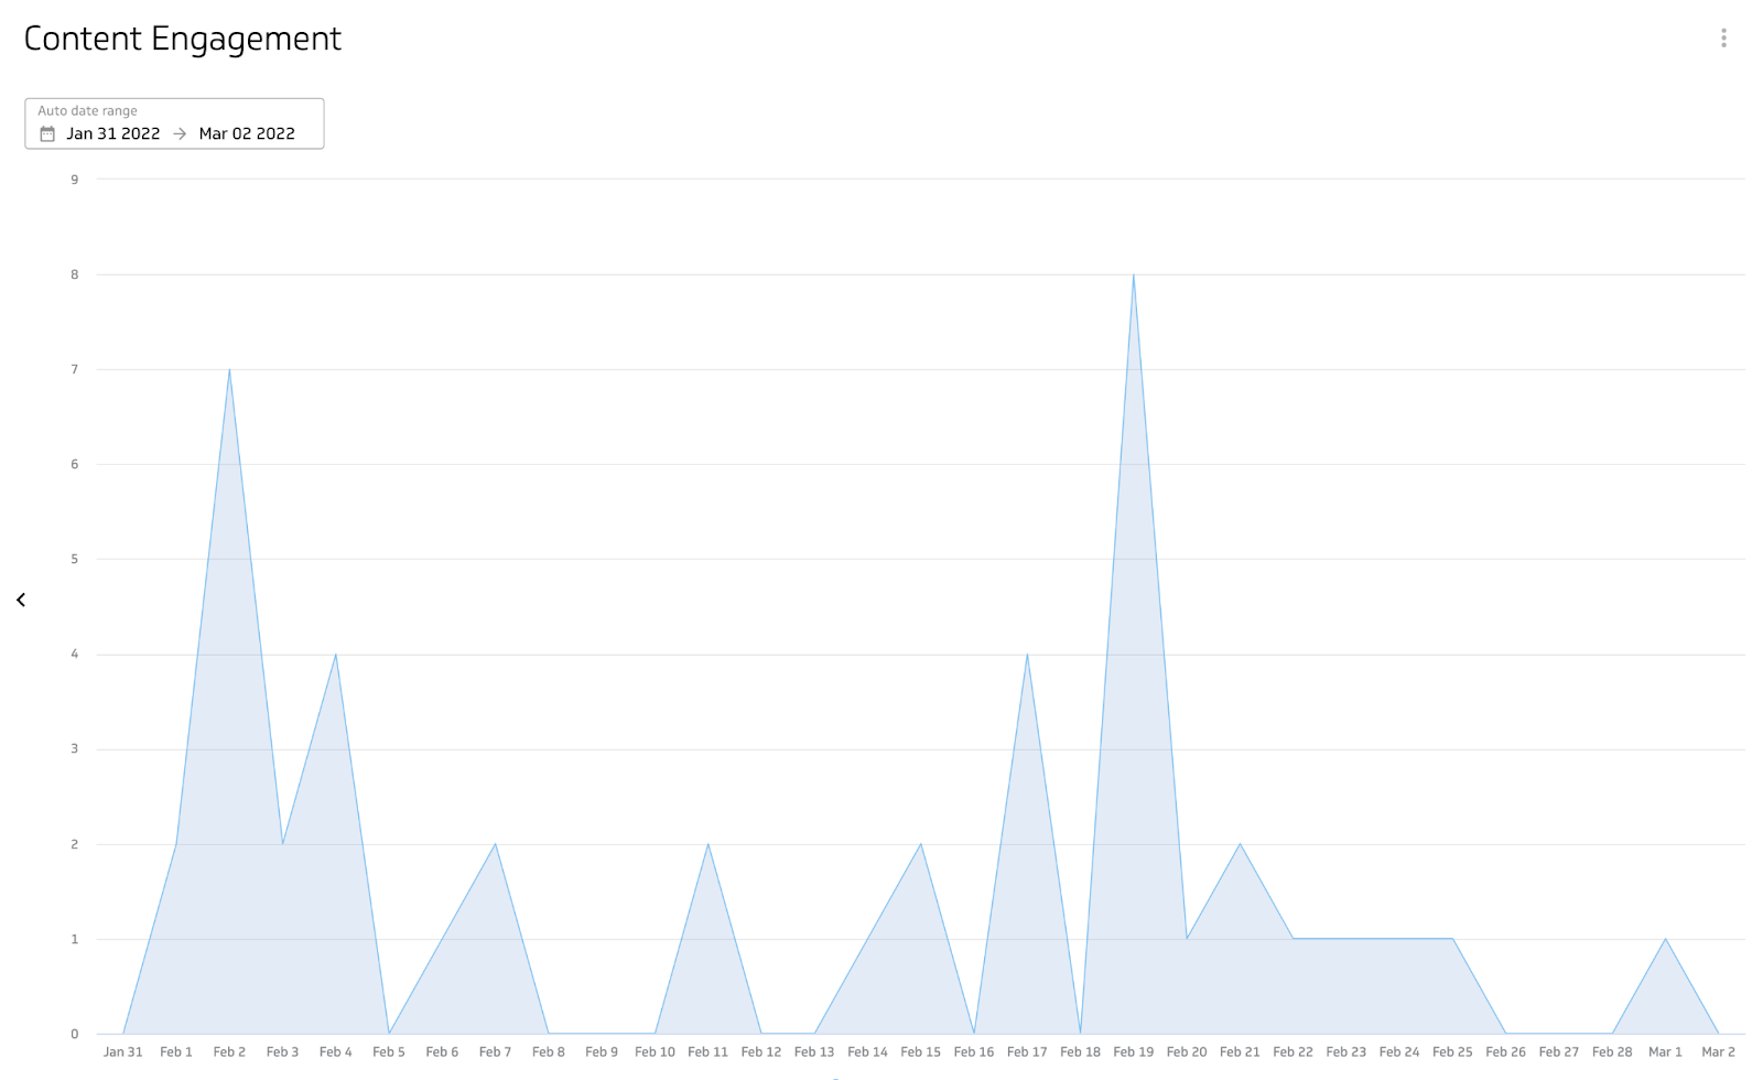
Content engagement
Content Engagement measures all interactions resulting from content posted to your LinkedIn account, including likes, comments, shares, and clicks.
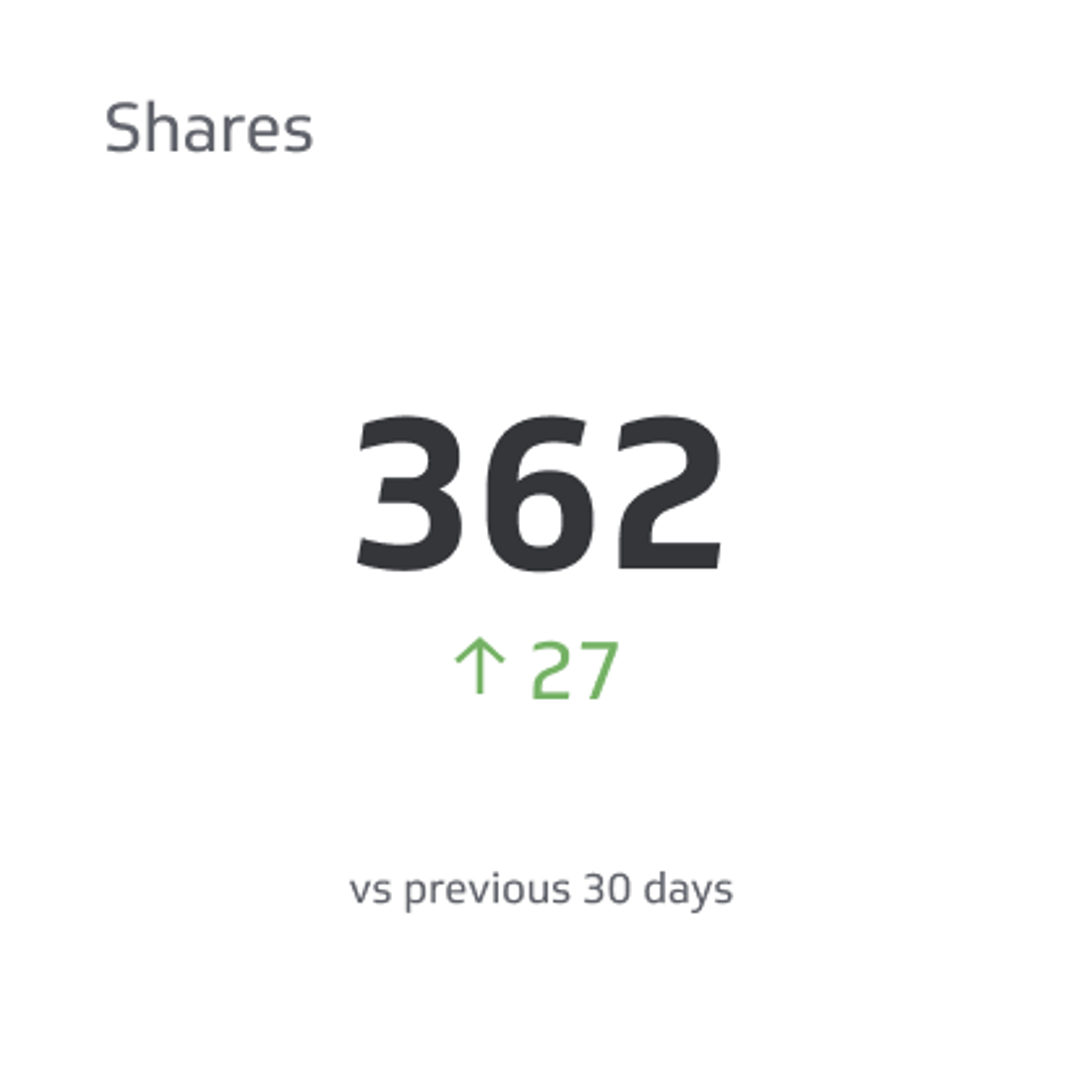
Shares
Shares is the total number of times a post was reshared on LinkedIn. High share counts indicate content that resonates enough for your audience to distribute it to their own networks.
What visualizations work best on a LinkedIn dashboard?
Most LinkedIn metrics can be segmented by location, job function, industry, company size, or seniority. Choosing the right chart type for each metric makes those segments easy to read at a glance.
Bar charts and line charts
Bar and line charts plot values along an x- and y-axis, making them ideal for tracking performance over time. Use a bar chart to compare weekly CTR across posts, or a line chart to spot trends in overall content engagement.
A line chart gives you a holistic view of engagement trends, so you can identify patterns without getting lost in individual data points.
Summary charts
Summary charts display a single numeric value alongside a comparison figure. On a LinkedIn dashboard, they work well for total follower count or post impressions over a set period. Adding a percentage comparison makes growth trends immediately visible.
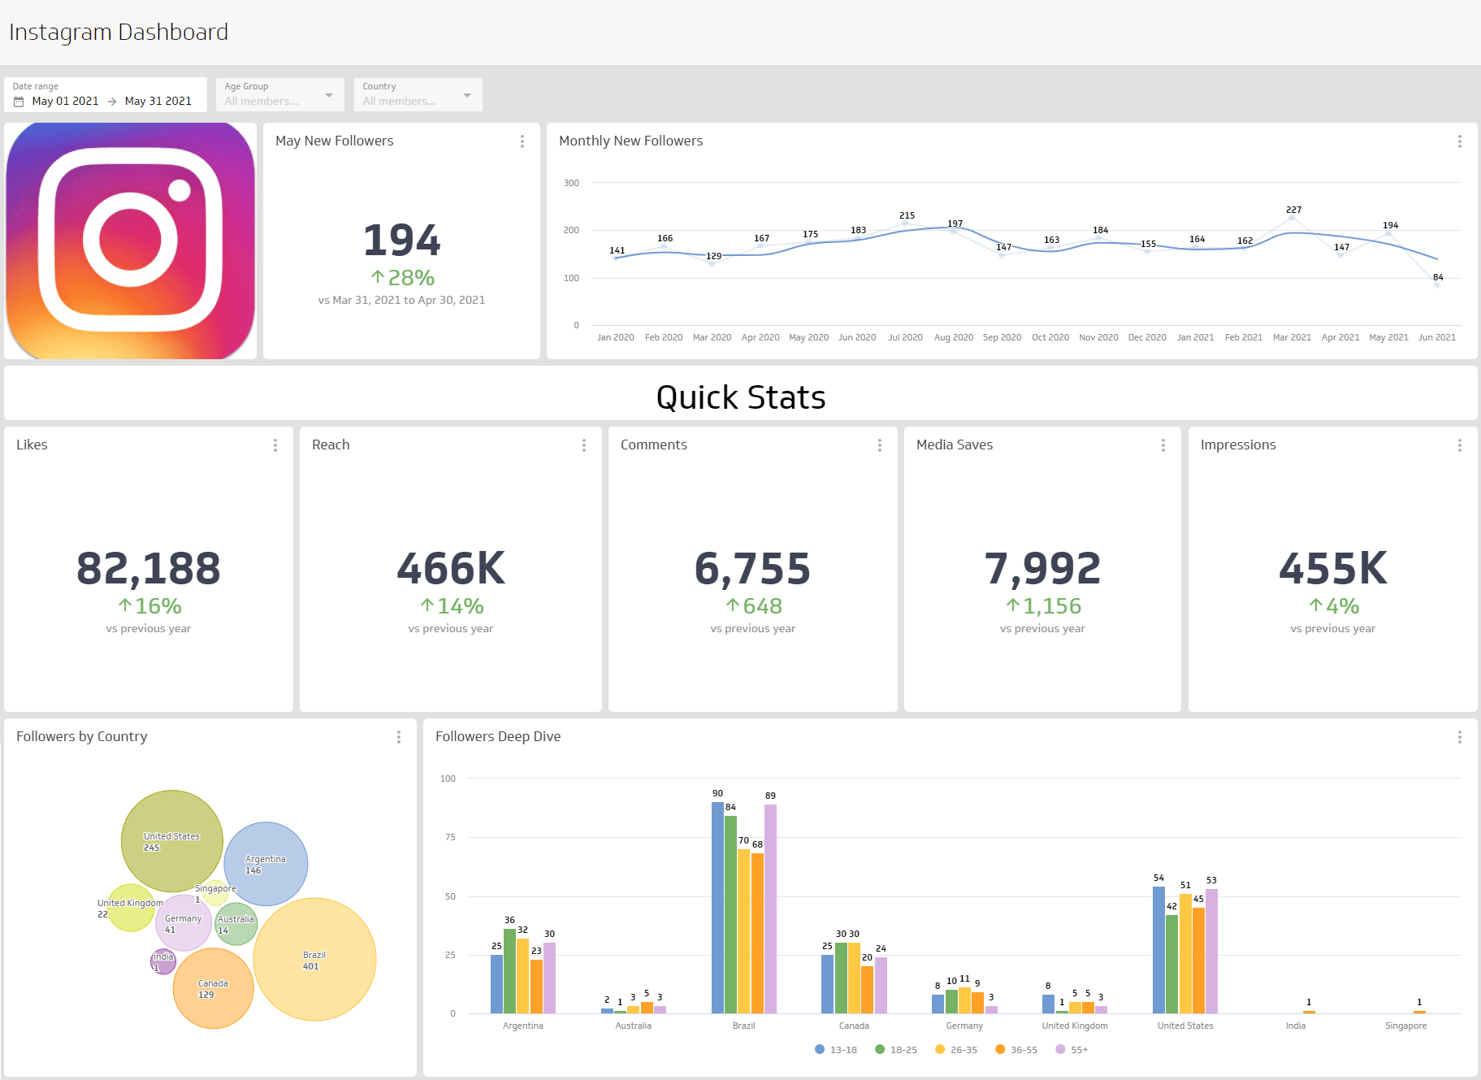
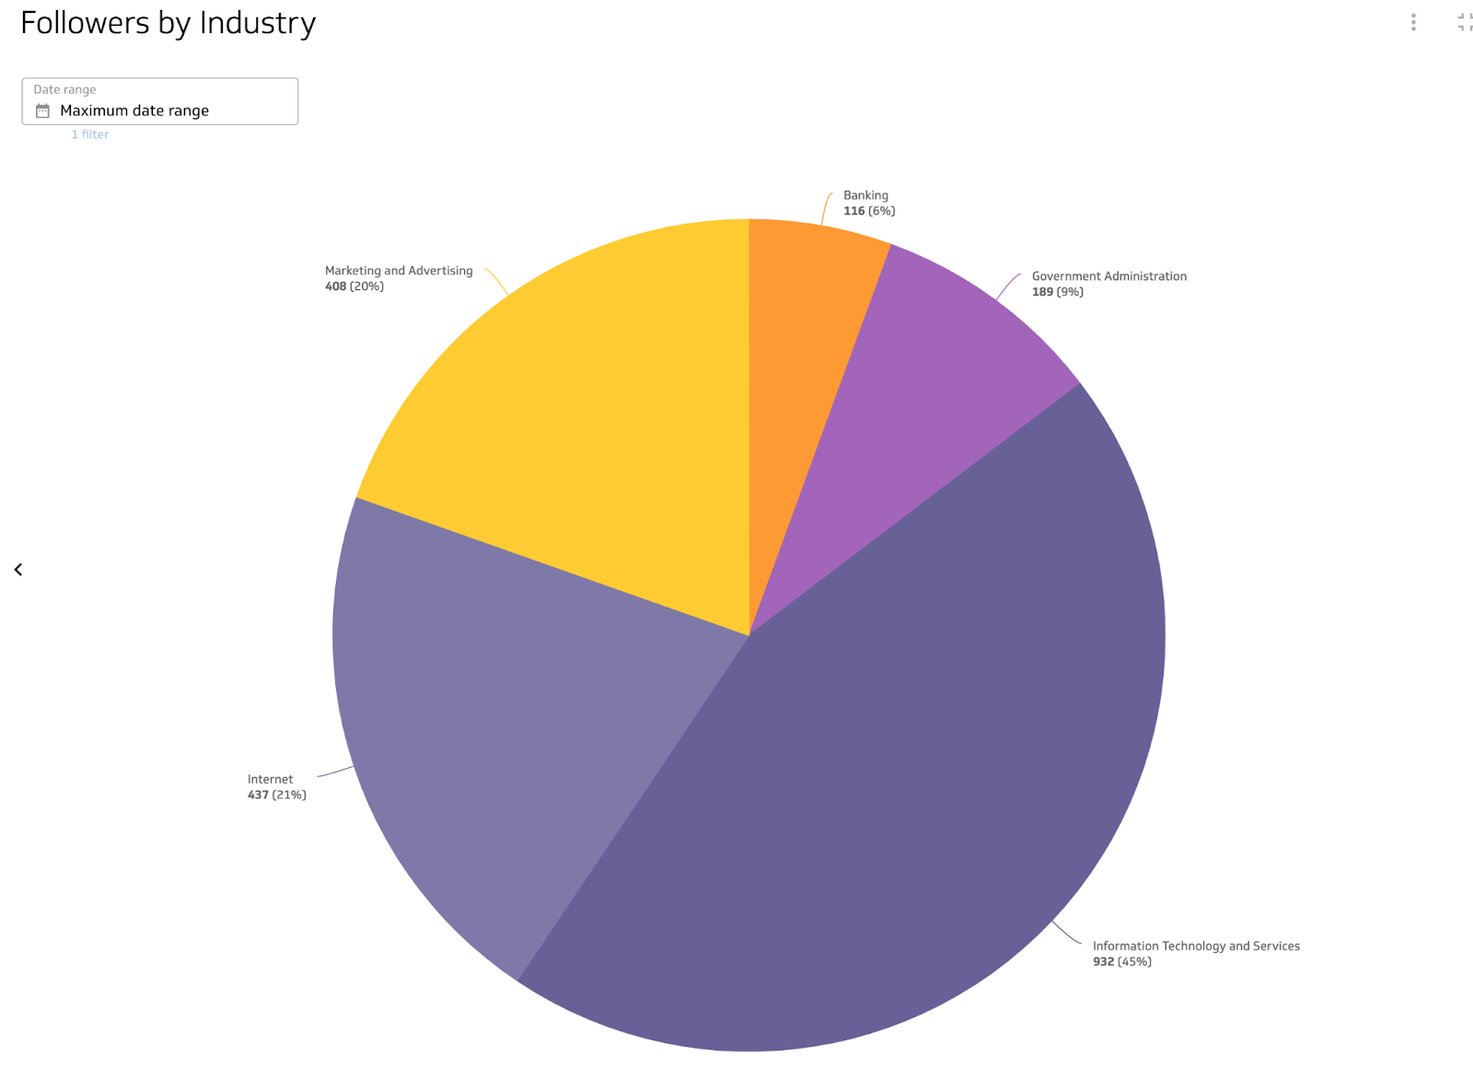
Pie charts
Pie and donut charts break down parts of a whole. Use them to visualize the industries or seniority levels your followers represent, so you can quickly see whether your audience aligns with your target market.
Benefits of a LinkedIn Analytics Dashboard
Centralizing your LinkedIn data on a dashboard gives you one reliable place to monitor performance and share results. With Klips, you can adjust date ranges, choose the right visualization for each metric, and distribute your dashboard to stakeholders without manual exports or slide decks.
You can also add team members and share your social metrics so everyone stays aligned on organic social performance. Because LinkedIn Pages is often tied to a personal account, a shared dashboard keeps your broader team informed without requiring direct platform access.
Dashboard inspiration for LinkedIn
Not sure where to start? Here are three focused LinkedIn dashboards you can build to track specific areas of your performance. For more inspiration, browse social media dashboards to see how other teams structure their reporting.
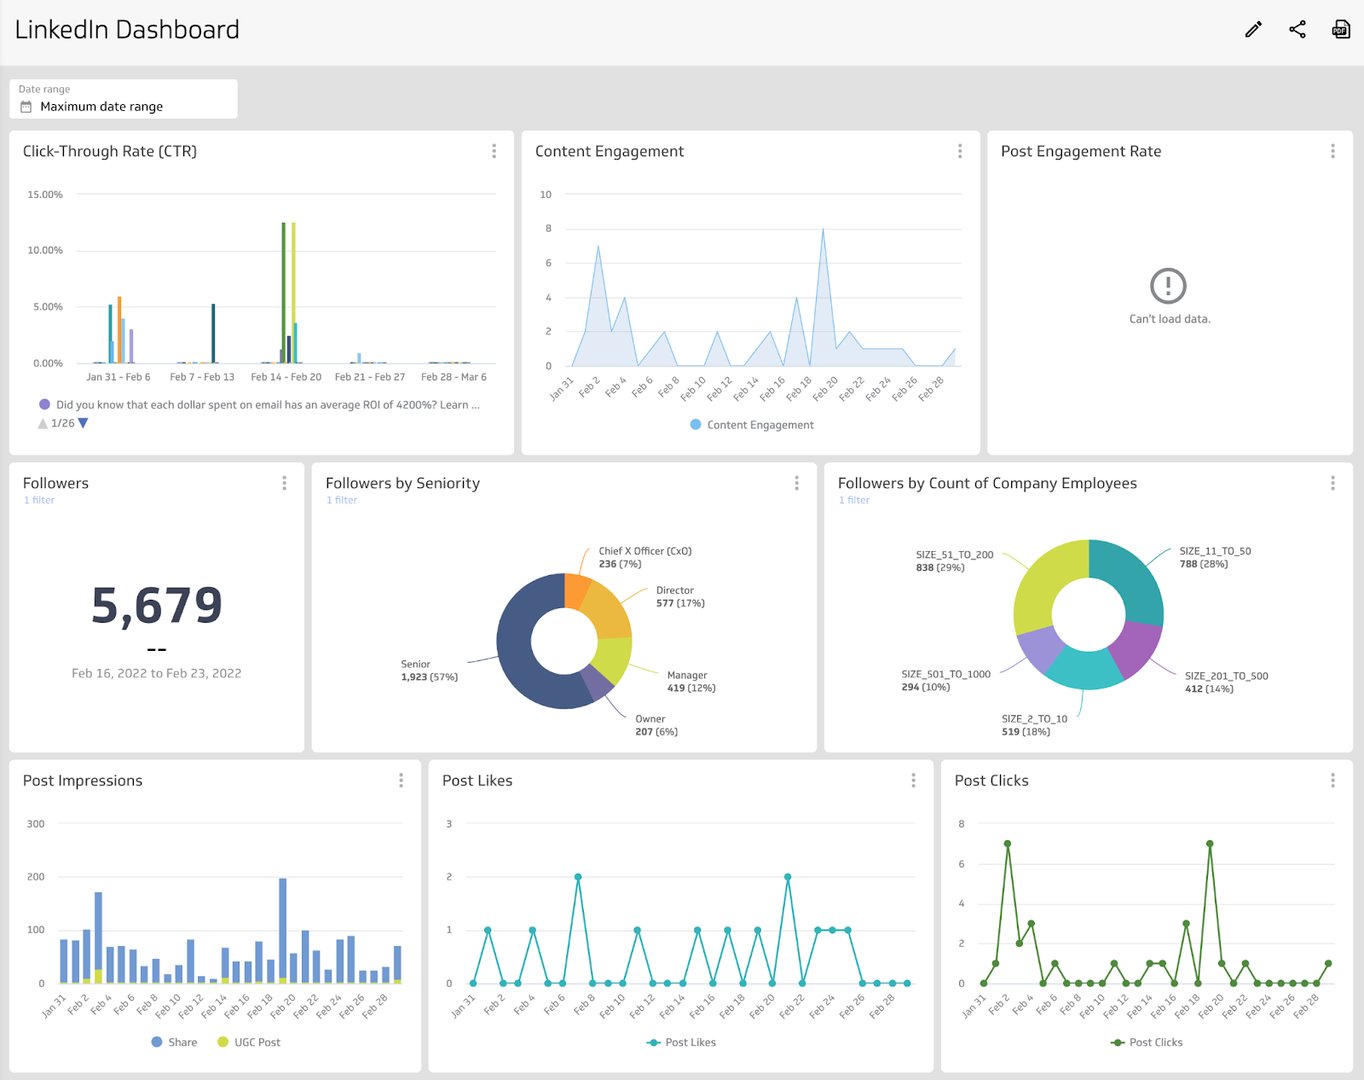
Track your overall LinkedIn performance
Build a LinkedIn Pages dashboard that covers all of your activity in one view. This dashboard answers questions like:
What is the CTR on my LinkedIn content?
How many followers do I have, and what is the company size breakdown?
How many post impressions come from my content versus user-generated content?
Track your follower demographics
LinkedIn offers detailed follower segmentation by company size, industry, country, and seniority. A follower dashboard helps you answer:
Where are my followers located?
Does the company size and industry of my followers match my target audience?
Is follower growth trending upward, or are there noticeable dips?
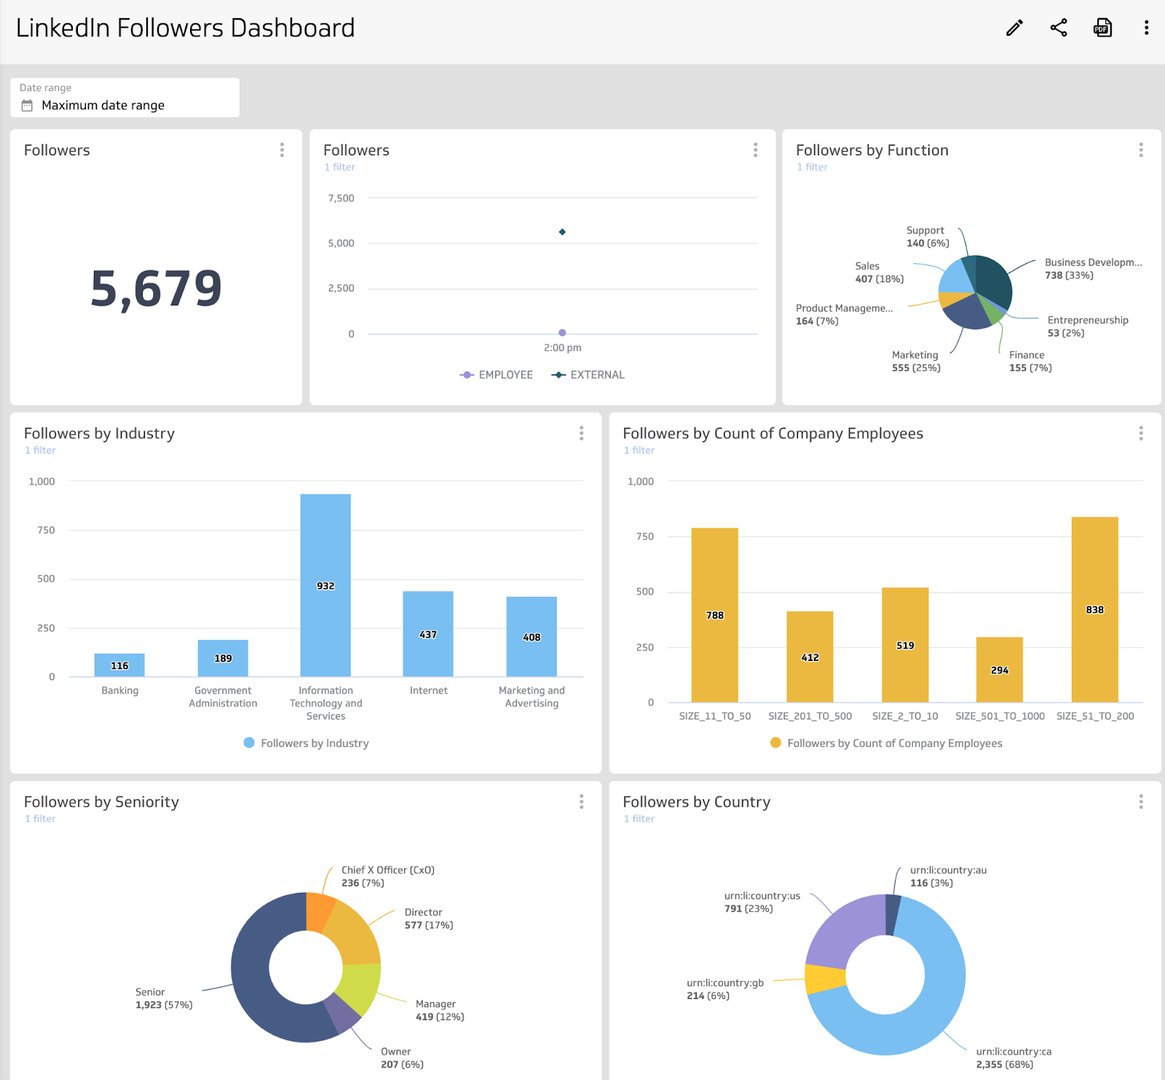
Tracking follower demographics helps you align your content to your current audience and spot opportunities to attract and grow your target segment.
Track your content engagement
Posting consistently without knowing whether your content lands is a common frustration. A LinkedIn engagement dashboard helps you answer:
How are people engaging with my posts — liking or commenting?
Does my own content outperform user-generated content, or vice versa?
Are there consistent engagement patterns, or do results spike and drop unpredictably?
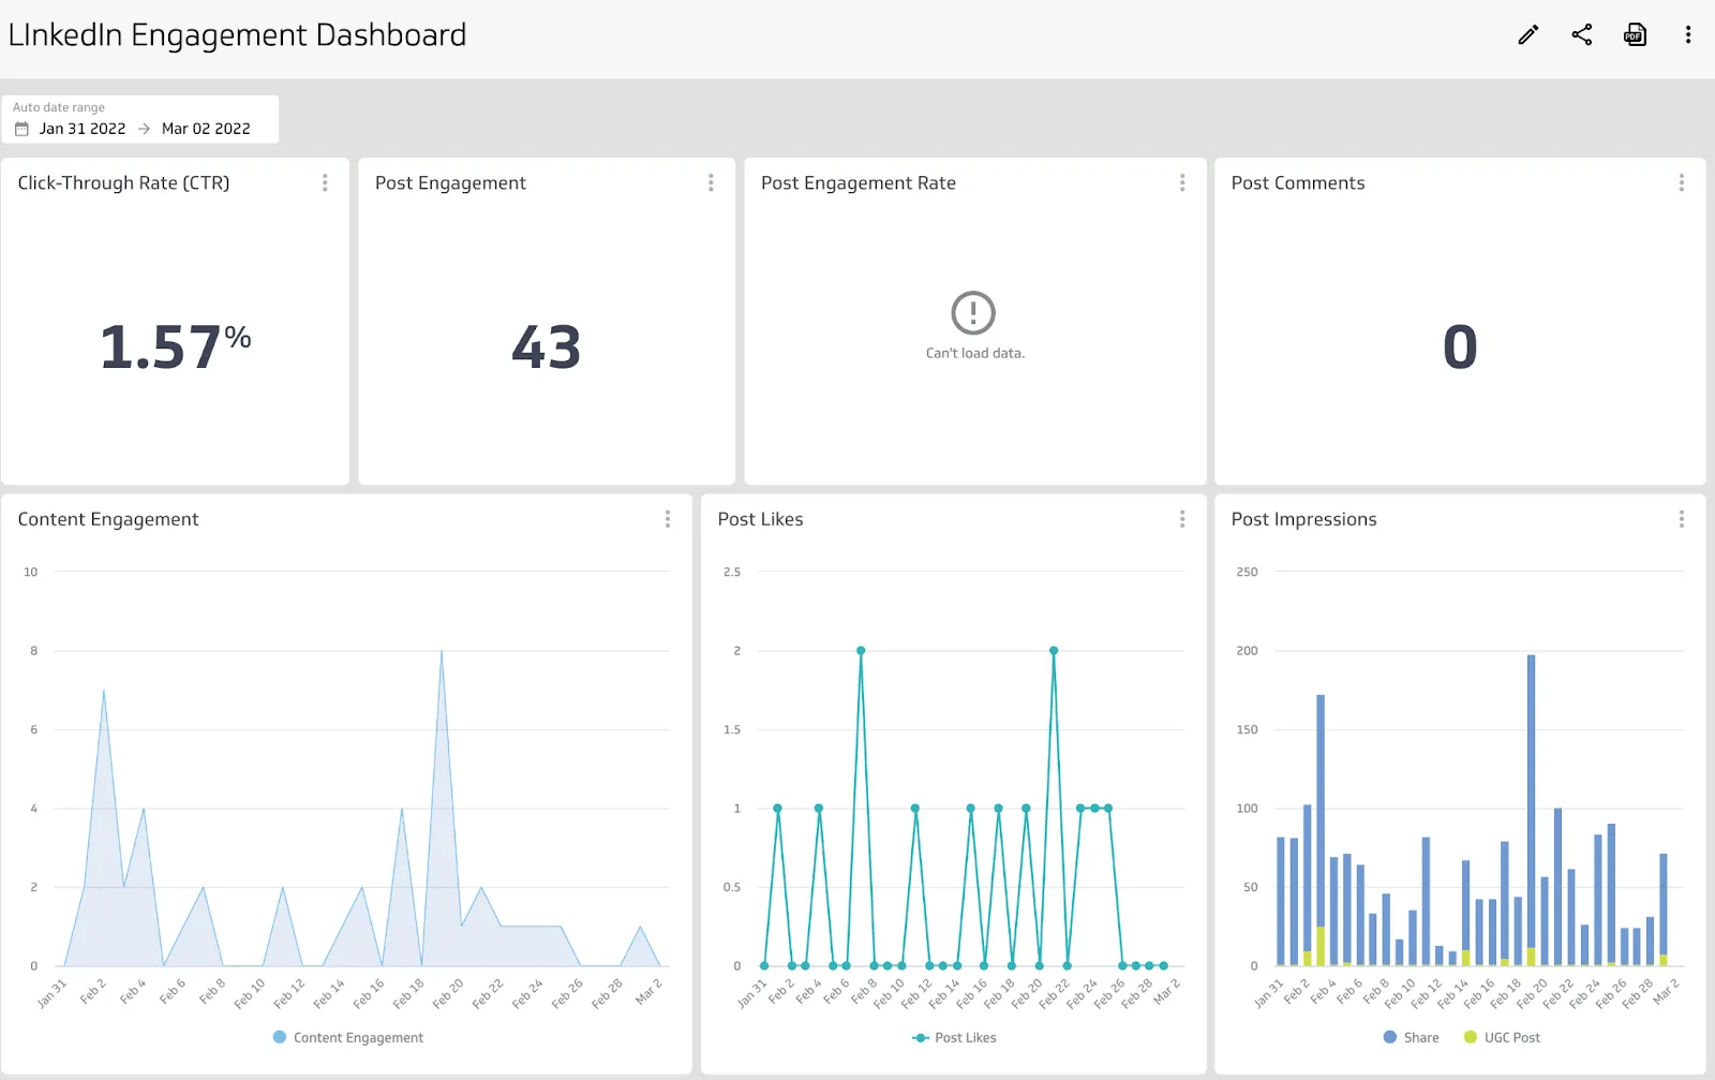
Engagement data helps you identify what content earns attention, adjust your publishing approach, and build a LinkedIn strategy grounded in evidence rather than intuition.
What does success look like with a LinkedIn Analytics Dashboard?
A well-built LinkedIn Analytics Dashboard makes your performance data clear to anyone who views it. Visualizations should surface key insights without requiring the viewer to interpret raw numbers. When your dashboard is easy to read, it becomes a practical tool for team alignment, not just a reporting exercise.
LinkedIn is one channel in a broader social media strategy. The patterns you surface on your dashboard — engagement trends, follower growth, content performance — directly inform how you approach content planning, audience targeting, and channel investment. Build it with your audience in mind, and it will do the work of communicating results for you.
At a glance
Focus Area
Organic LinkedIn content performance, follower demographics, and engagement tracking.
Metrics List
Click-Through Rate, Followers, Website Clicks, Page Likes, Content Engagement, Shares.
Reference Rate
Track LinkedIn metrics on a daily or weekly basis to identify content trends and audience growth patterns.
Related Dashboards
View all dashboards