Social Media Metrics Dashboard
Compare platform performance and user demographics in one view.
What is a social media metrics dashboard?
A social media metrics dashboard is a centralized view that pulls performance data from all your social platforms into one place, so you can track, compare, and act on results without logging into each platform separately.
If you're manually pulling reports from Instagram, Facebook, LinkedIn, and YouTube one by one, you're spending time you don't have. A social media dashboard solves that by unifying your social media metrics into a single source of truth.
With everything in one view, you can:
Compare performance across platforms to see which channels drive the most engagement and reach
Analyze user demographics and behaviour to sharpen your campaign targeting
Identify trends across channels and track your social media ROI over time
What are examples of social media metrics?
Top social media metrics that you can track on your dashboard include:
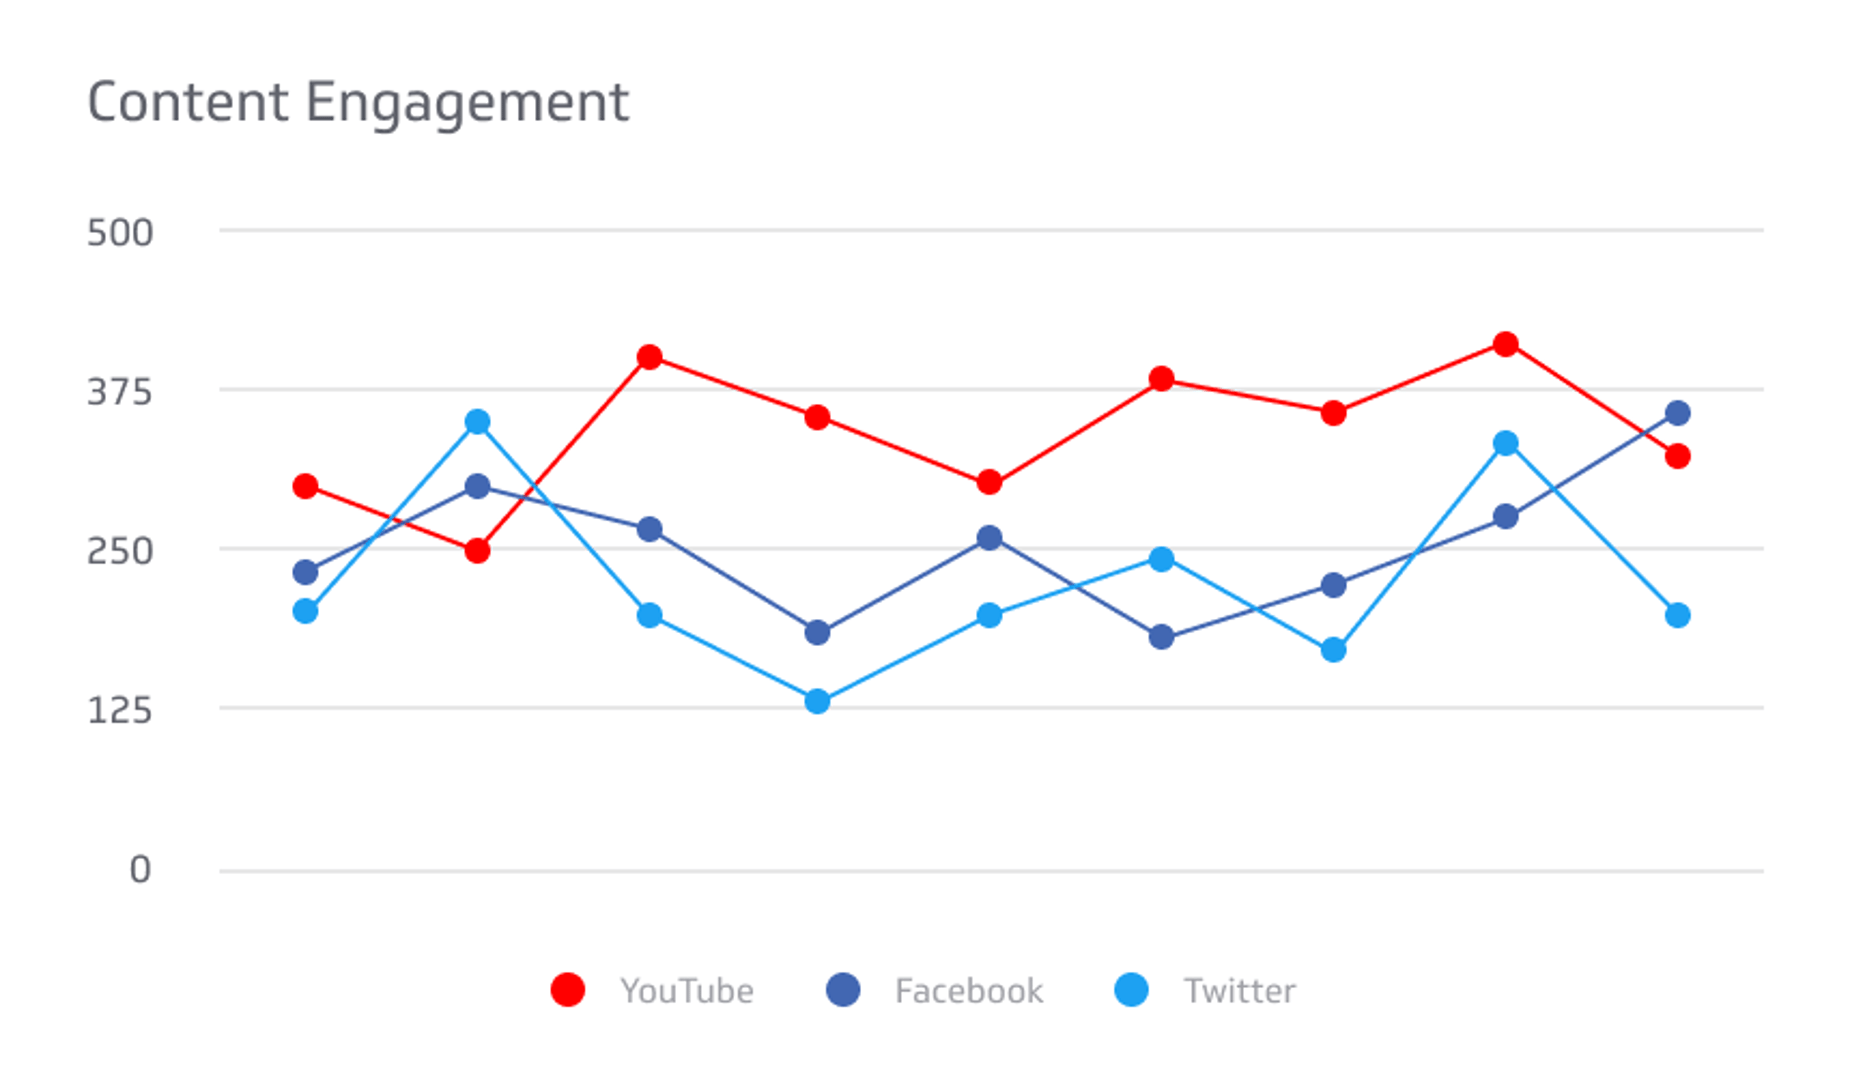
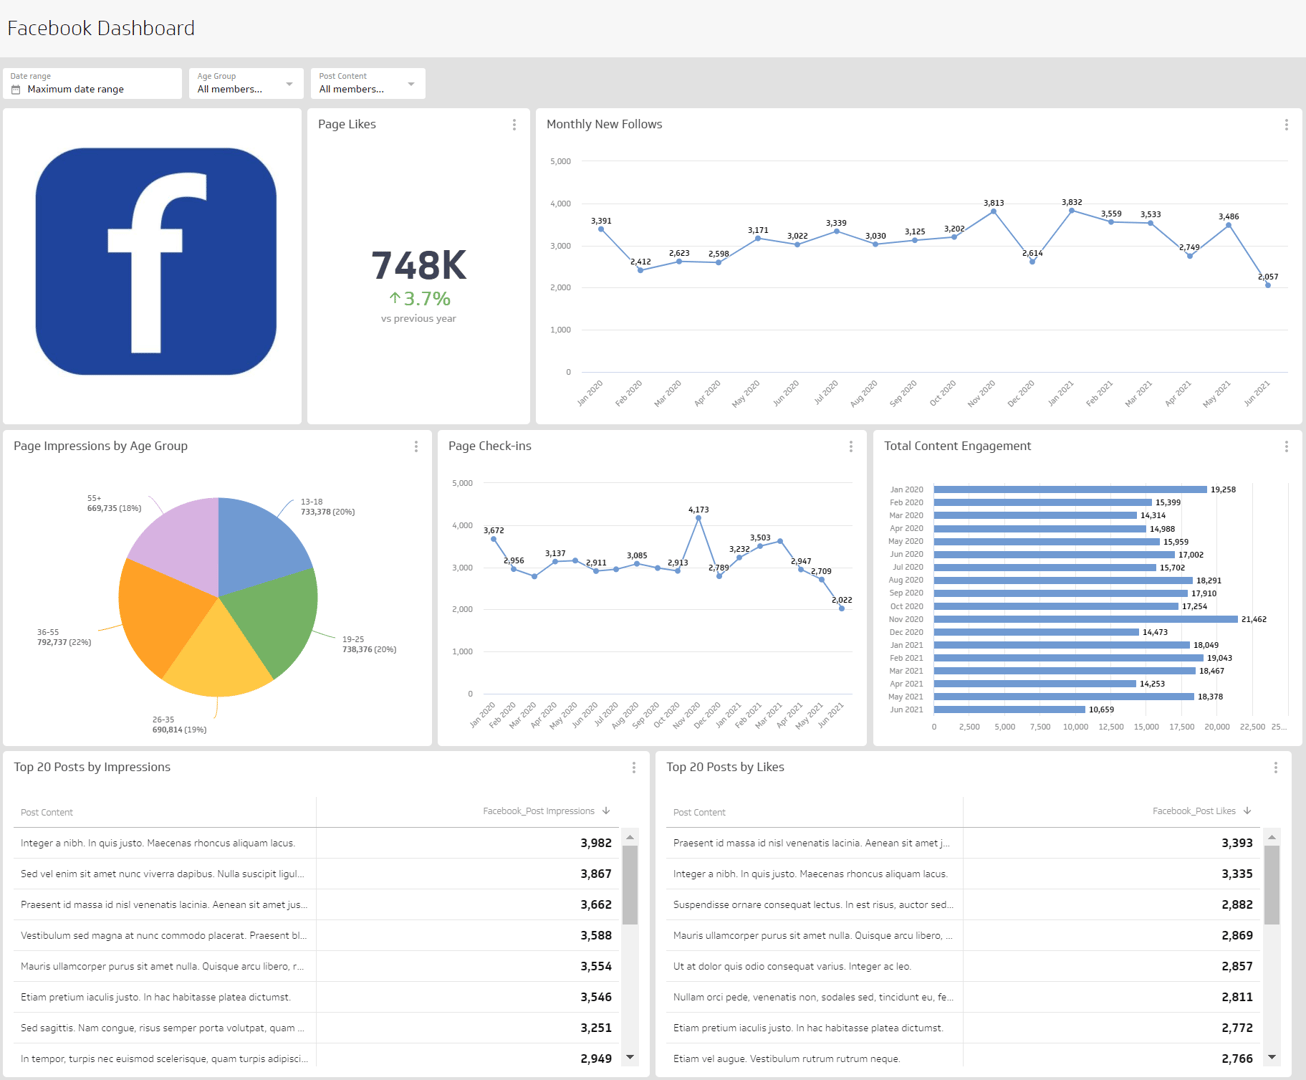
Content Engagement
Content Engagement measures all engagements resulting from content generated in a social media account. It captures likes, comments, shares, and clicks in aggregate, giving you a complete picture of how your audience responds to what you post.
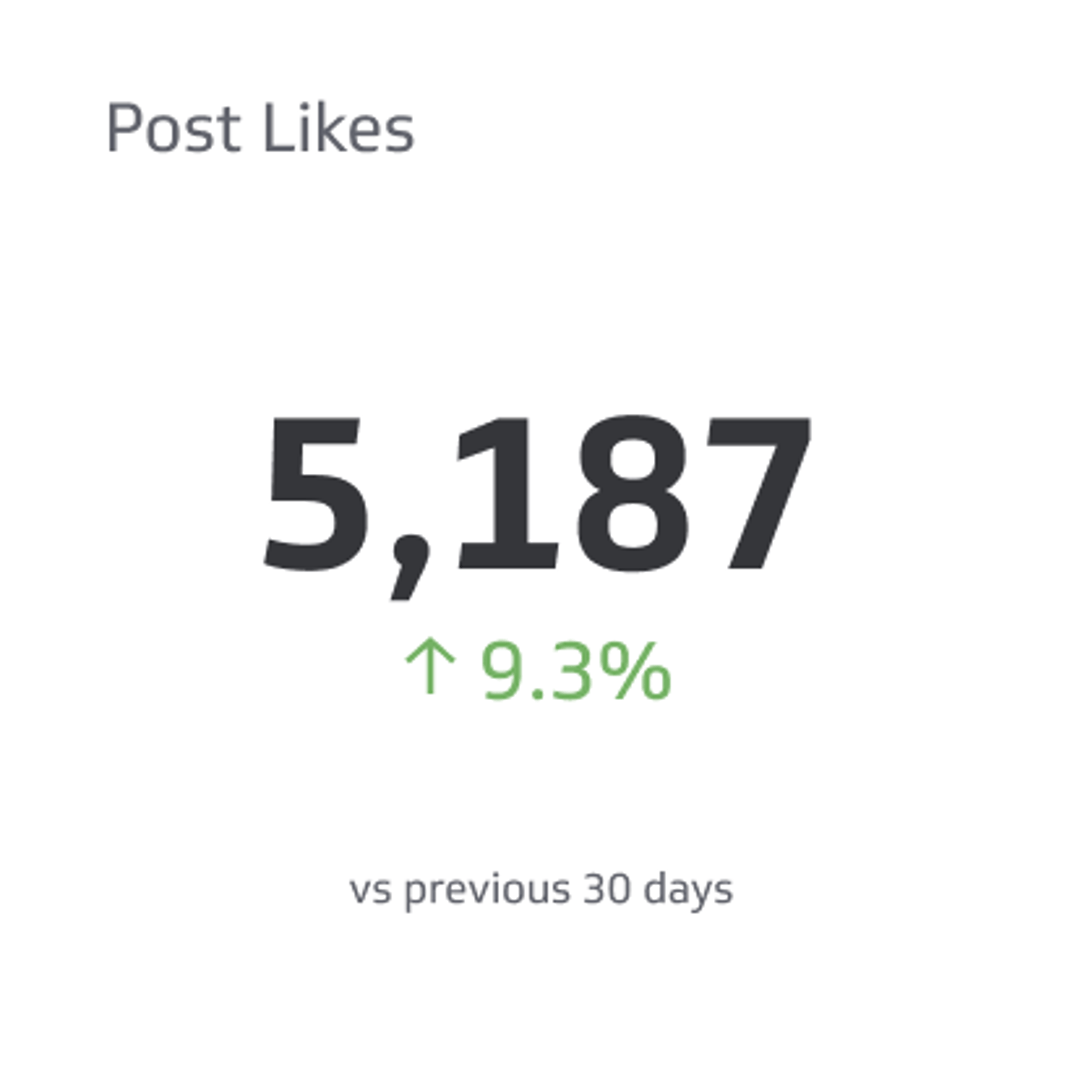
Post Likes
Post Likes measures the popularity of social media content across platforms. A rising like count signals that your content resonates; a plateau is a prompt to test new formats or topics.
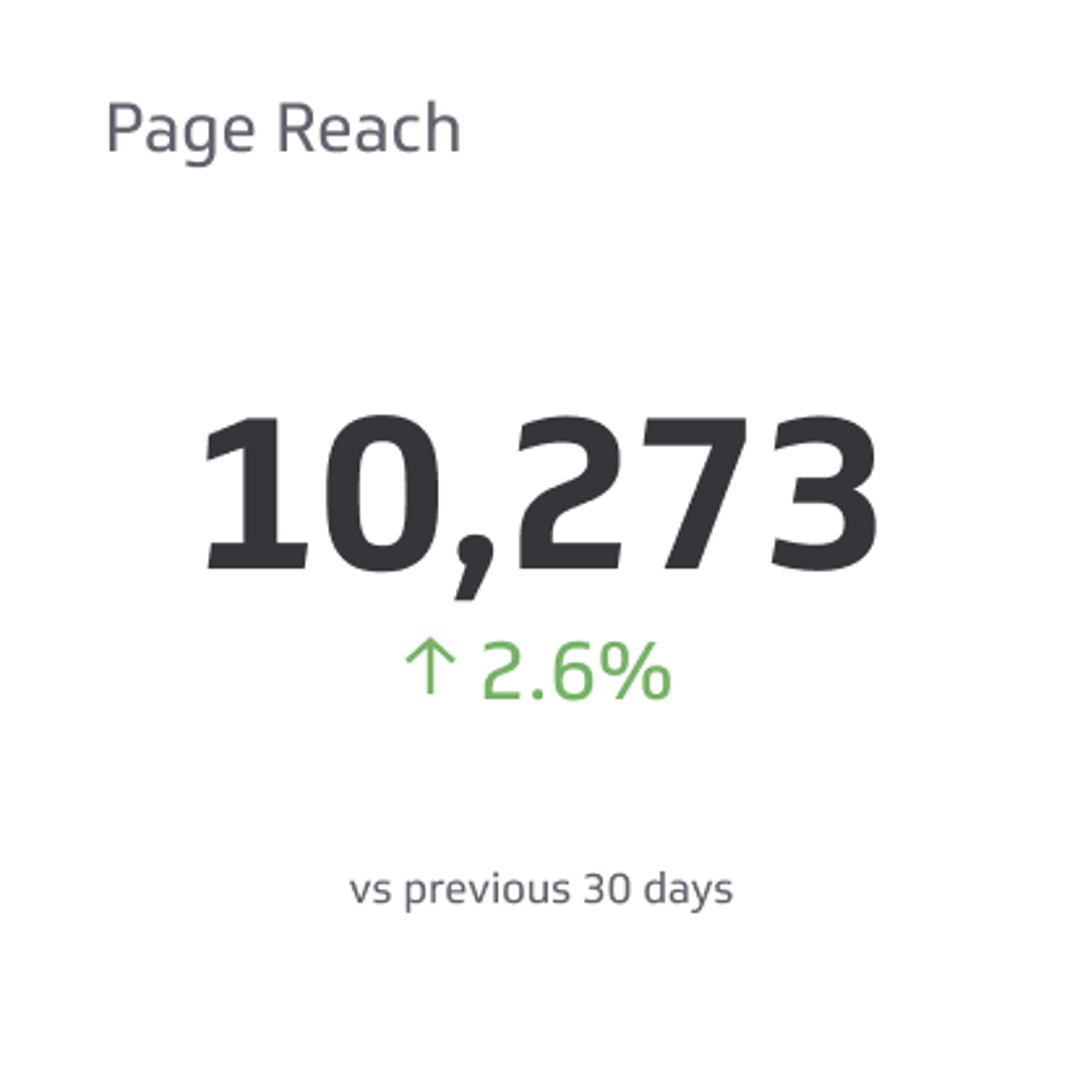
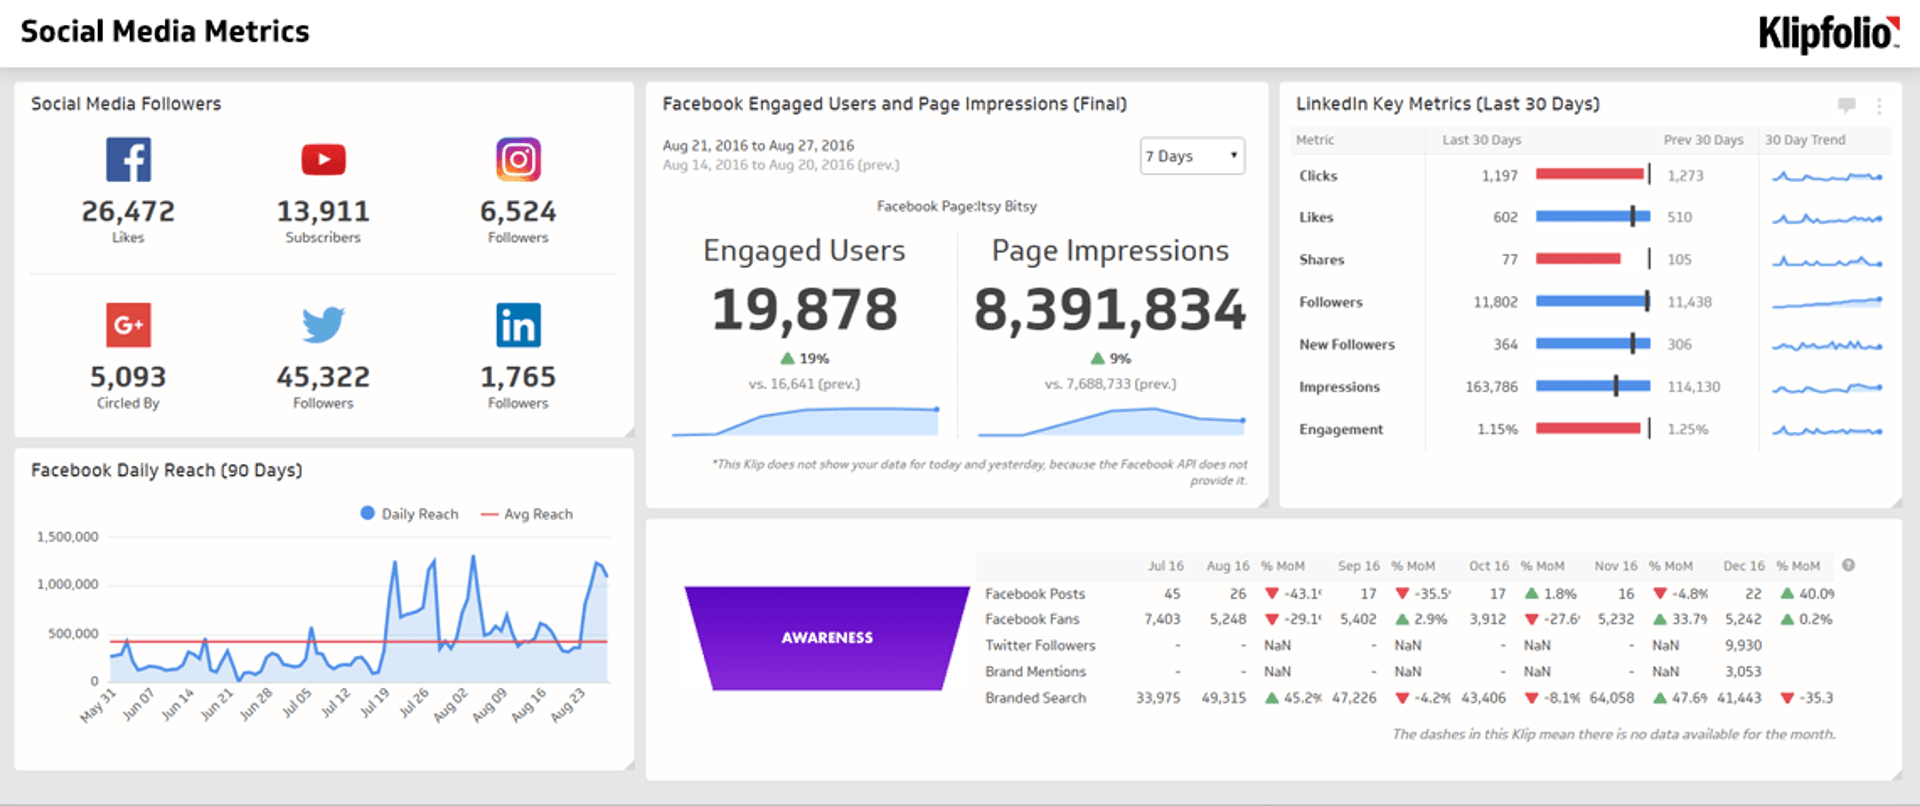
Page Reach
Page Reach is the number of unique users who have seen posts or any content from your social media page at least once. Track it alongside impressions to understand how far your content travels versus how often it's seen.
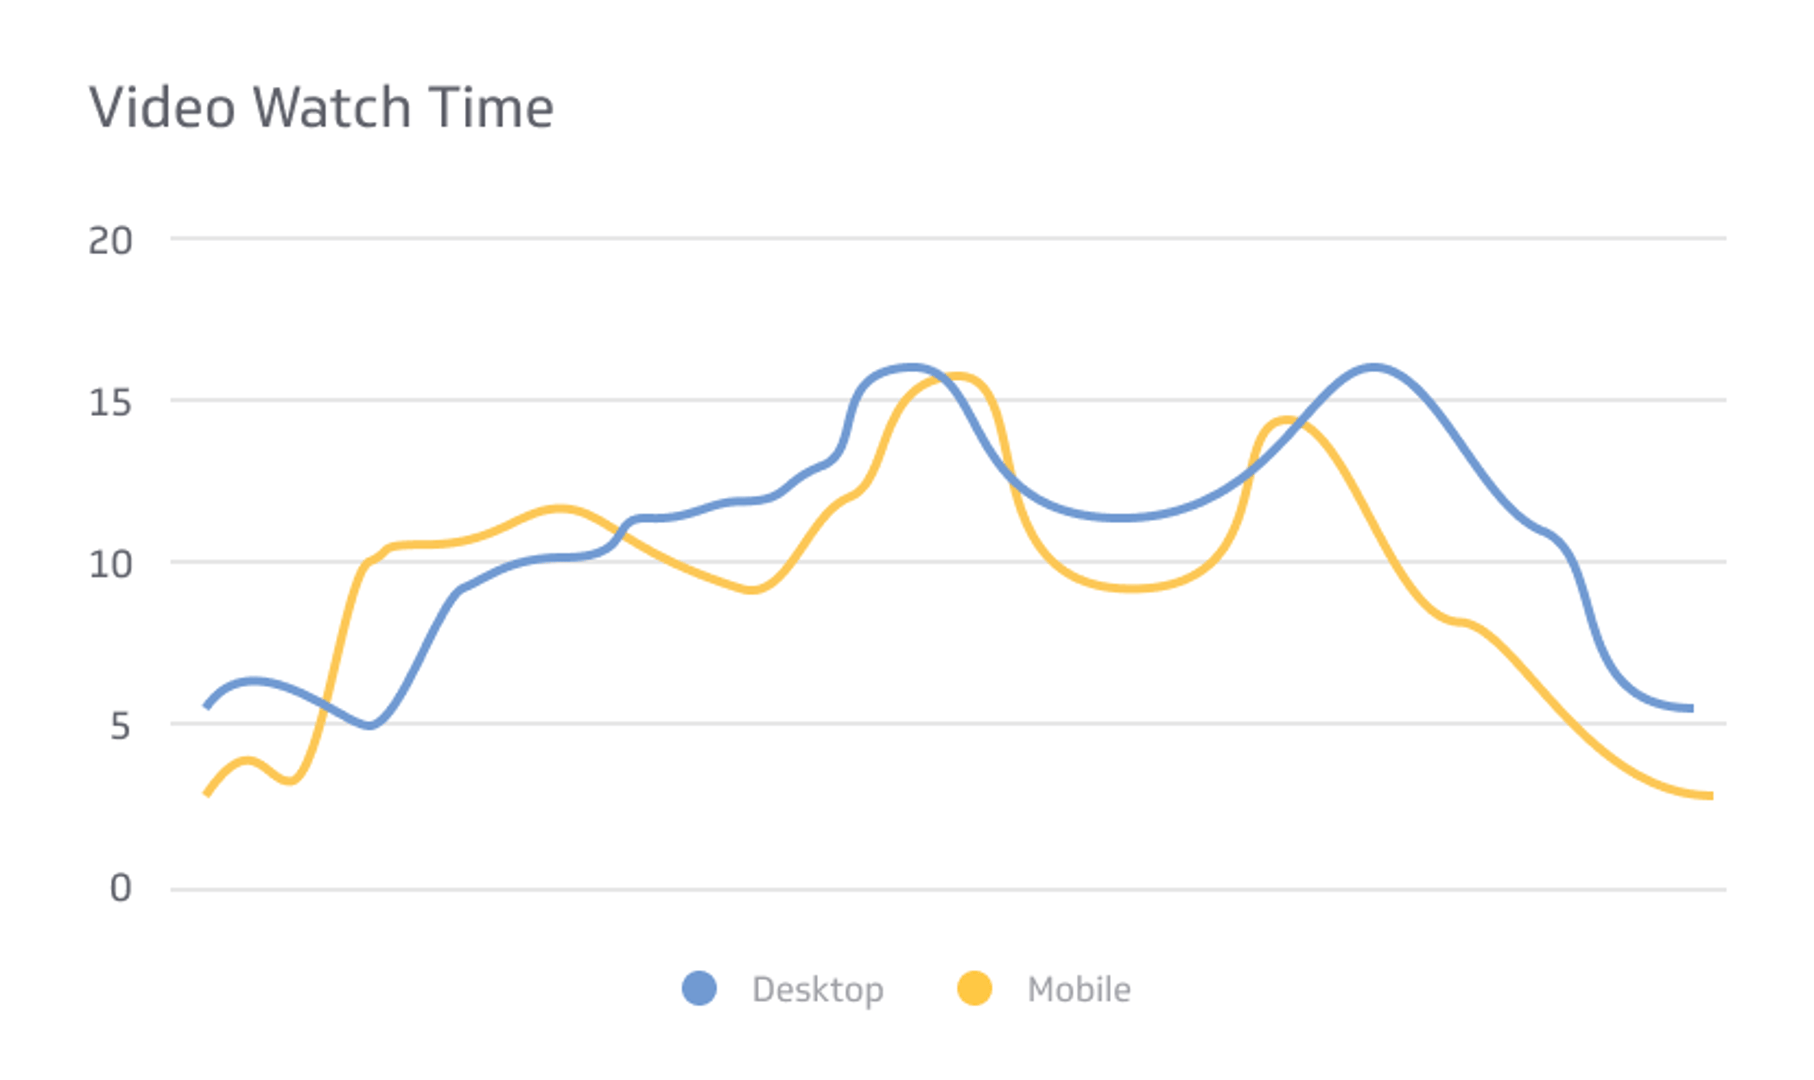
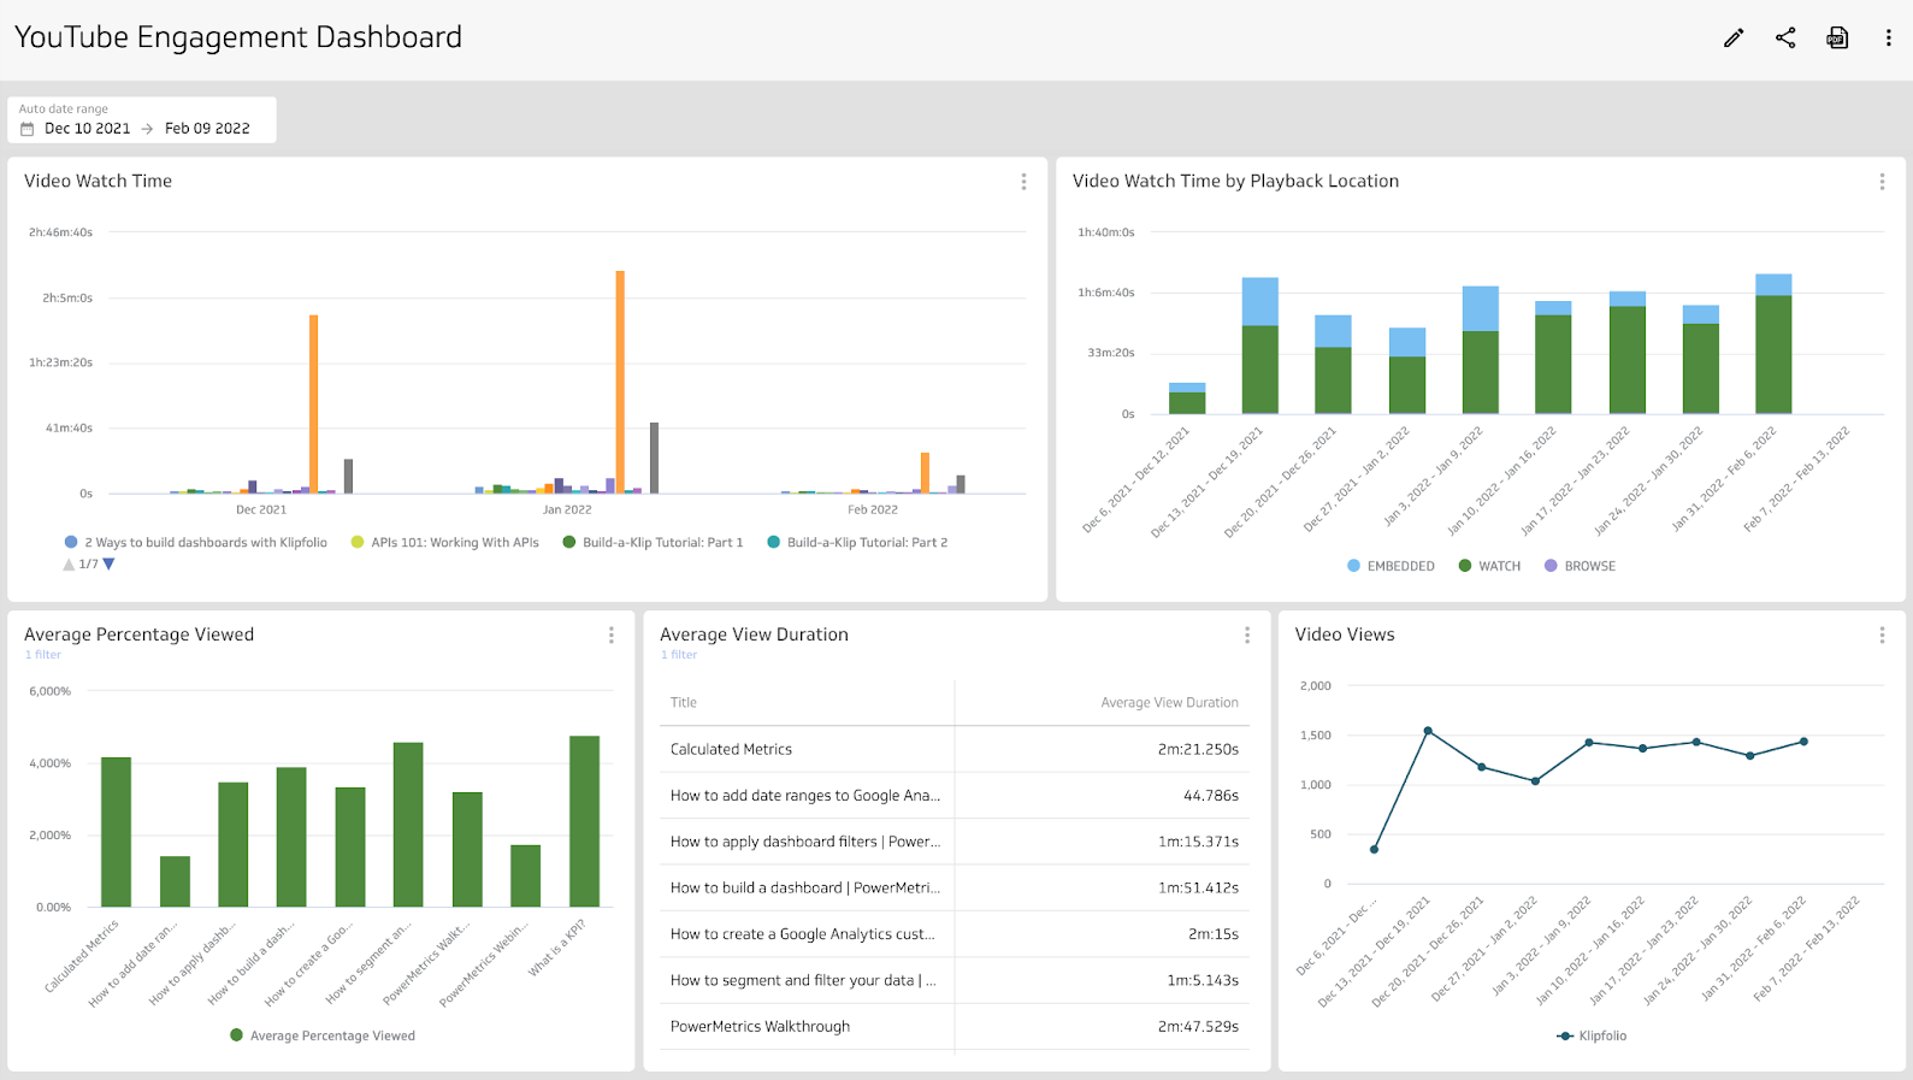
Video Watch Time
Video Watch Time measures the total amount of time viewers spend watching your video content. High watch time signals strong content quality and improves algorithmic distribution on most platforms.
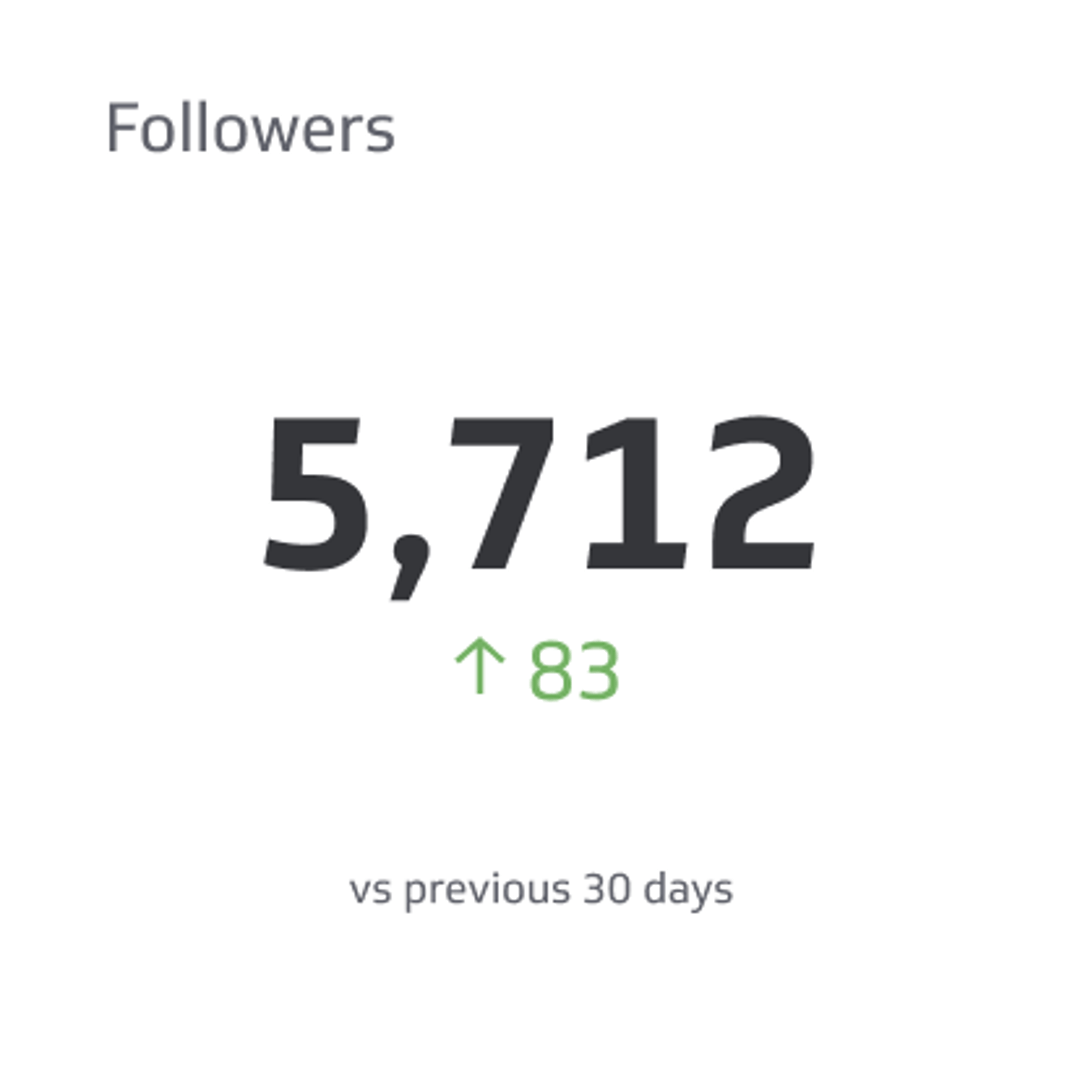
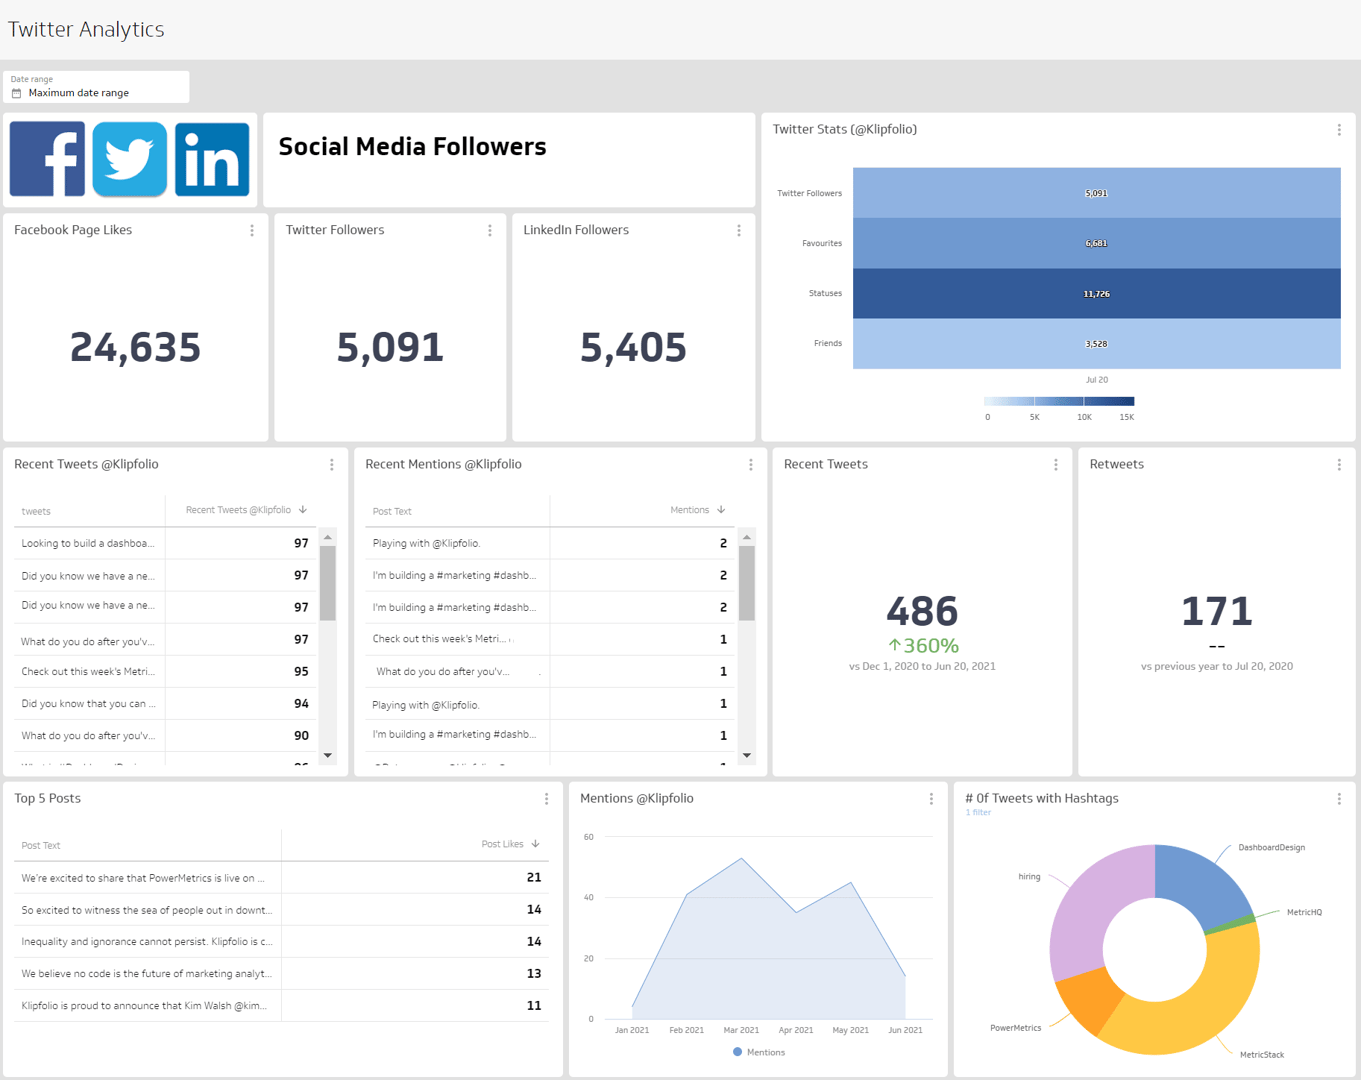
Followers
Followers is the number of users who have chosen to follow your account. Track follower growth over time to measure brand awareness and the long-term impact of your content strategy.
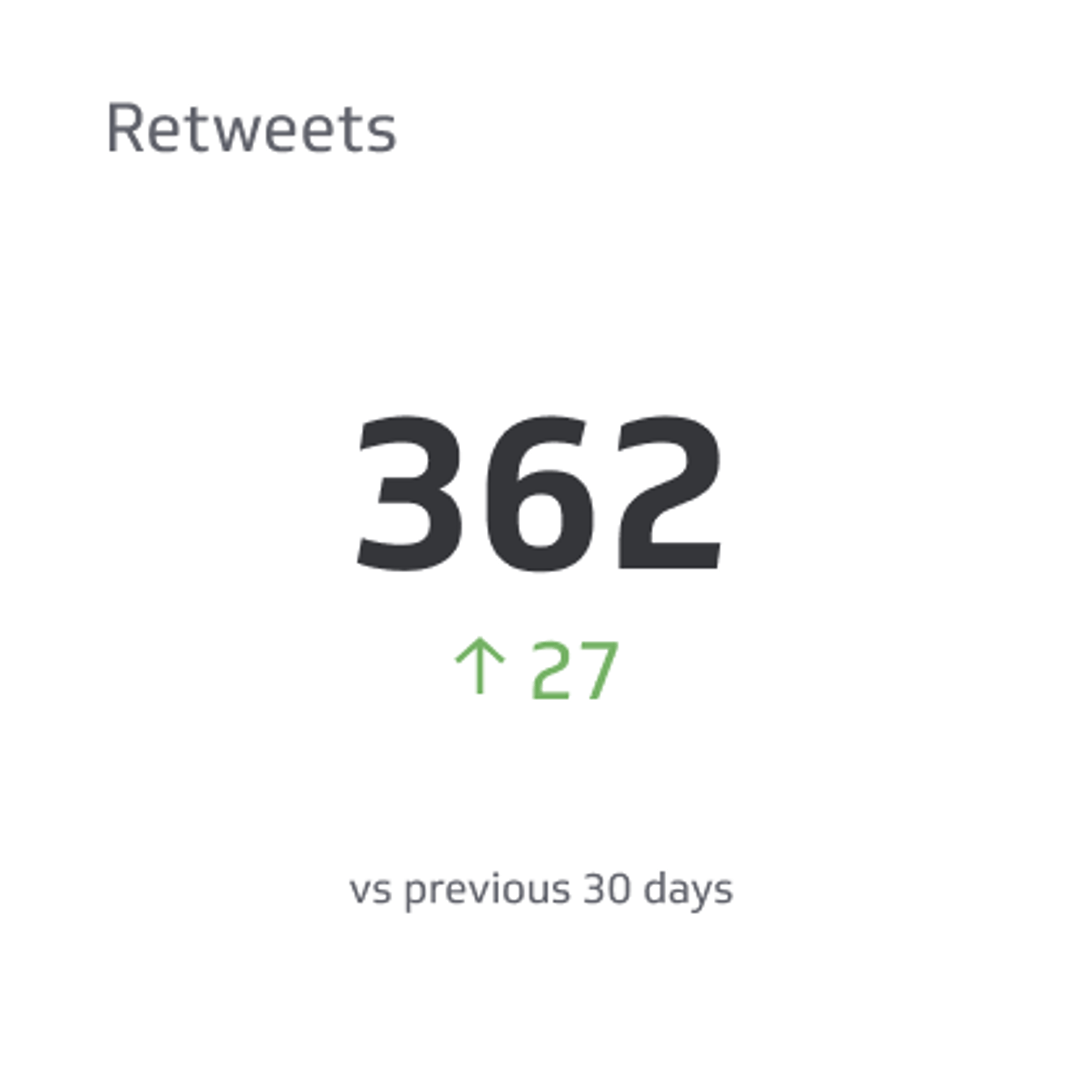
Reposts
Reposts (formerly Retweets on X) measure how often your content is reshared by other users. A high repost count indicates that your content is compelling enough for your audience to amplify to their own networks.
What should be on a social media metrics dashboard?
The right mix of metrics depends on your goals, but most social media dashboards include a core set of KPIs that cover reach, engagement, and growth.
Common metrics to include:
Followers: Total audience size and growth rate over time
Content engagement: Likes, comments, shares, and clicks in one view
Reach and impressions: How far your content travels and how often it's seen
Post clicks: The number of users who clicked through from a post
Average video watch time: Depth of engagement with video content
Reposts and mentions: How often your content is reshared or referenced
Group metrics by platform or by goal (awareness, engagement, conversion) so the dashboard tells a clear story rather than presenting a wall of numbers.
How to build a social media dashboard
Before you start building, answer a few questions that will shape every design decision:
- Who will use this dashboard — a social media manager, a marketing director, or an executive?
- What decisions does this dashboard need to support?
- Which platforms are active and worth tracking?
- How often does the audience need updated data?
Your answers determine which metrics belong on the dashboard, how they should be visualized, and how frequently the data should refresh.
A well-designed dashboard communicates one clear message per section. Avoid overloading a single view with every available metric. Instead, layer your dashboard: lead with high-level performance summaries, then let users drill into platform-specific or campaign-specific detail. For inspiration, browse social media dashboard examples to see how others structure their views.
Ways to get more from your dashboard
A basic dashboard shows you what happened. A well-built one helps you understand why and what to do next.
Connect all your platforms: Pull data from Instagram, LinkedIn, Facebook, YouTube, and TikTok into one view so you're never comparing partial data
Add scheduling context: Overlay your content calendar so you can correlate posting frequency with performance spikes or drops
Track competitors: Monitor competitor account performance to benchmark your results and spot gaps in your strategy
Automate reporting: Schedule PDF or email reports so stakeholders get the data they need without requesting it manually
Share with your team: Use role-based access so social managers, strategists, and executives each see the view relevant to their work
Start tracking social media metrics in one place
Scattered data leads to slow decisions. When your social media metrics live in one dashboard, your team spends less time gathering numbers and more time acting on them.
Klips connects to 130+ data sources and gives you the flexibility to build dashboards that match your exact reporting needs — from a quick executive summary to a detailed cross-platform performance tracking breakdown.
Explore social media dashboard templates and start tracking what matters.
At a glance
Focus Area
Social media performance tracking, cross-platform comparison, engagement and reach monitoring
Metrics List
Content Engagement, Post Likes, Page Reach, Video Watch Time, Followers, Reposts, Impressions, Post Clicks
Reference Rate
Daily to weekly depending on campaign activity and reporting cadence
Related Dashboards
View all dashboards