Instagram Dashboard
Unlock the true potential of your Instagram campaign by tracking key performance metrics in a dashboard.
What is an Instagram Dashboard?
An Instagram dashboard is a visual reporting tool that displays the metrics and KPIs related to your Instagram Business account. Tracking your metrics on an Instagram dashboard will answer questions like:
- How many unique accounts have viewed my Instagram content?
- How many followers do I have on Instagram?
- Do carousels, single images, or video receive more engagement?
Setting up an Instagram dashboard allows you to segment your data to understand how your audience interacts with your content.
What metrics should be included on an Instagram dashboard?
Followers
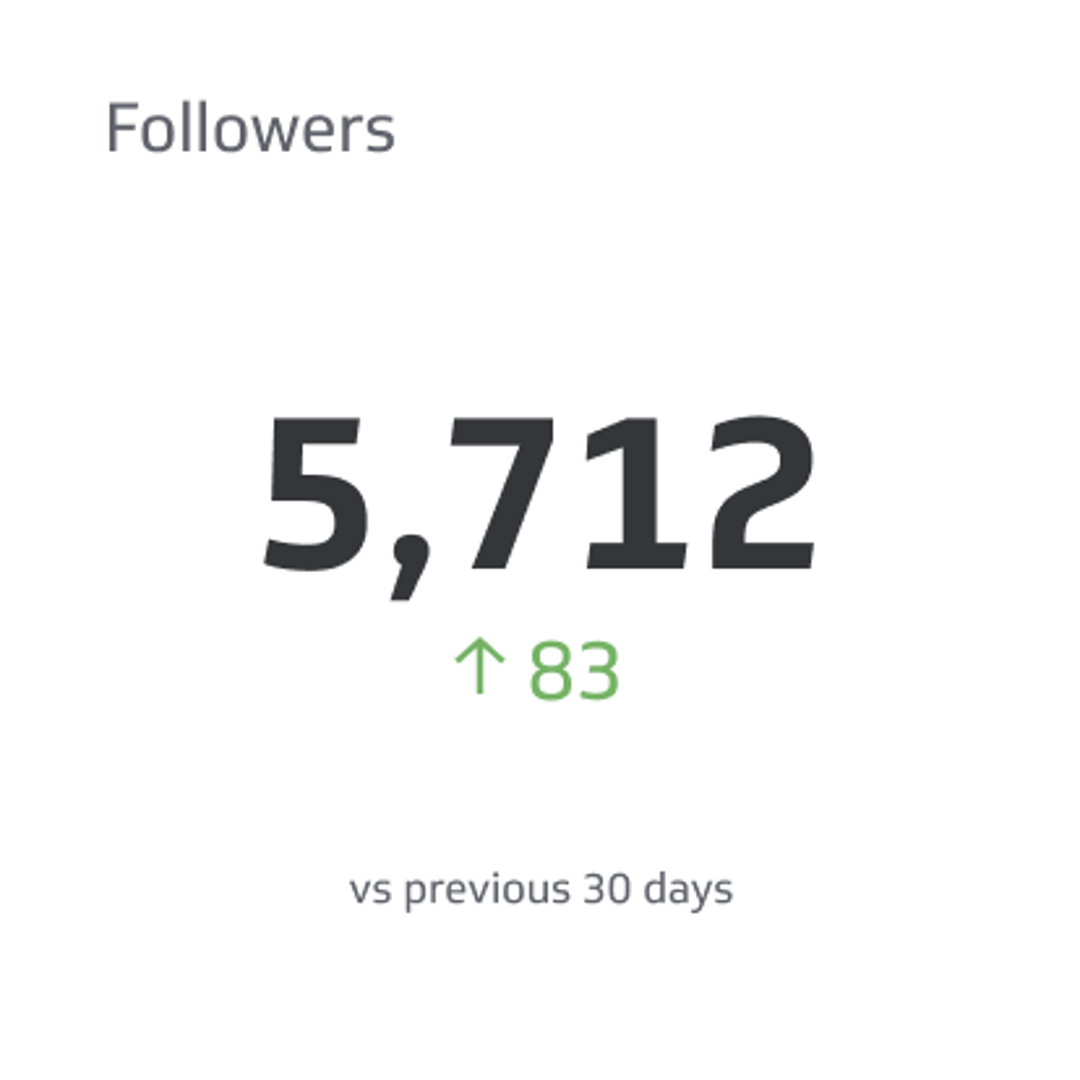
Followers is the number of users who have chosen to follow another user’s or company’s posts.
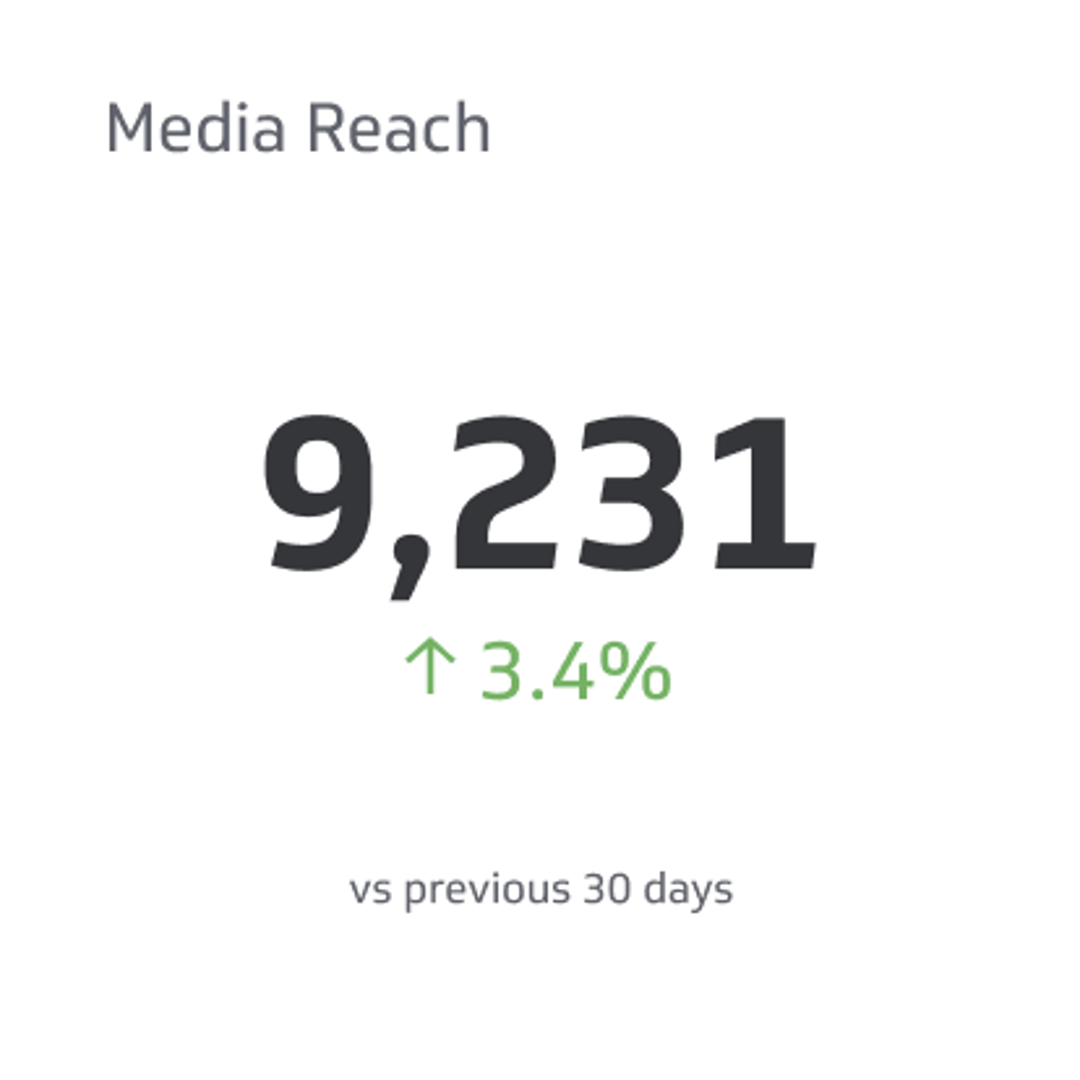
Media Reach
Media Reach is the measure of how many people were exposed to your content.
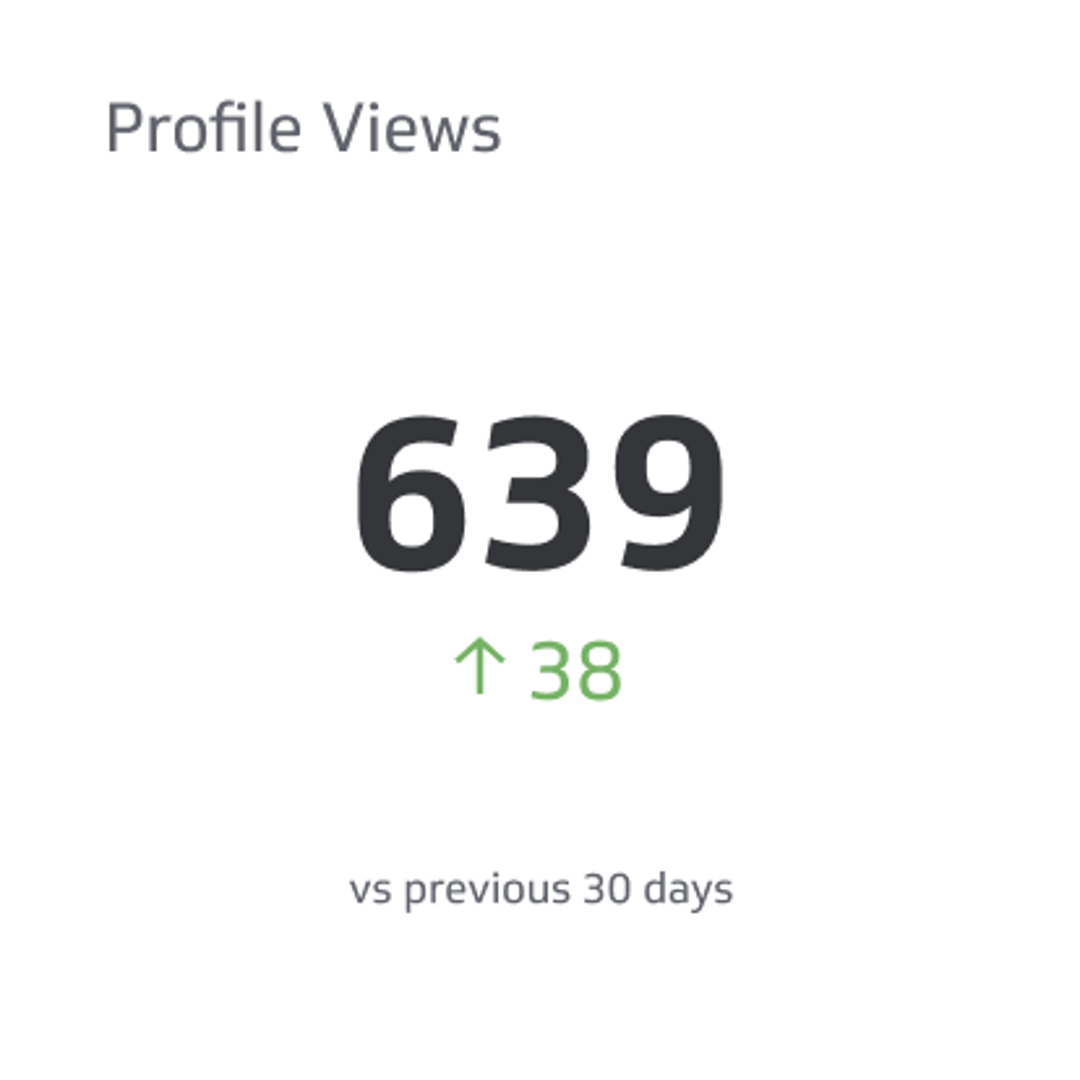
Profile Views
Profile Views counts the total number of views a social media profile has received from unique accounts over a specific period of time.
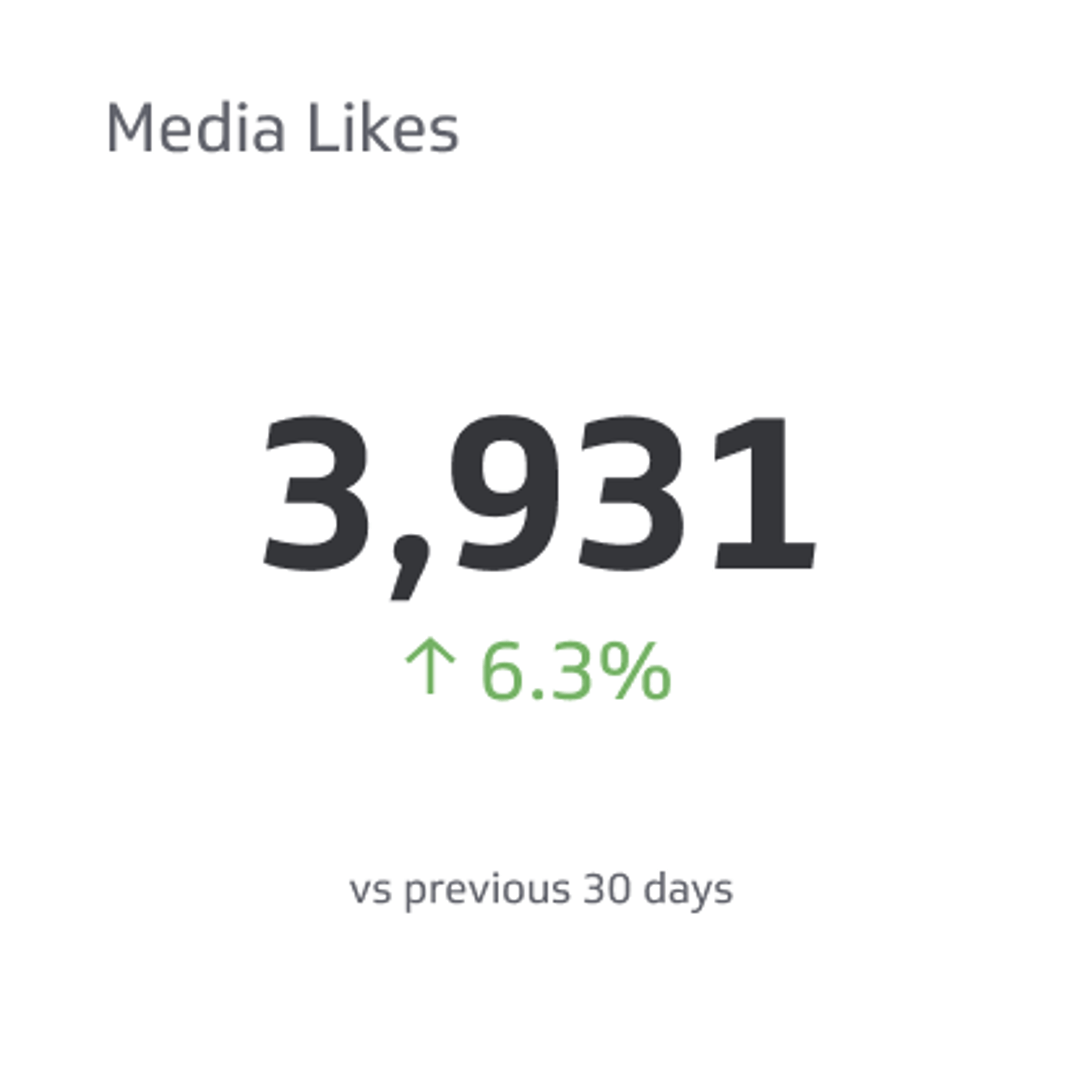
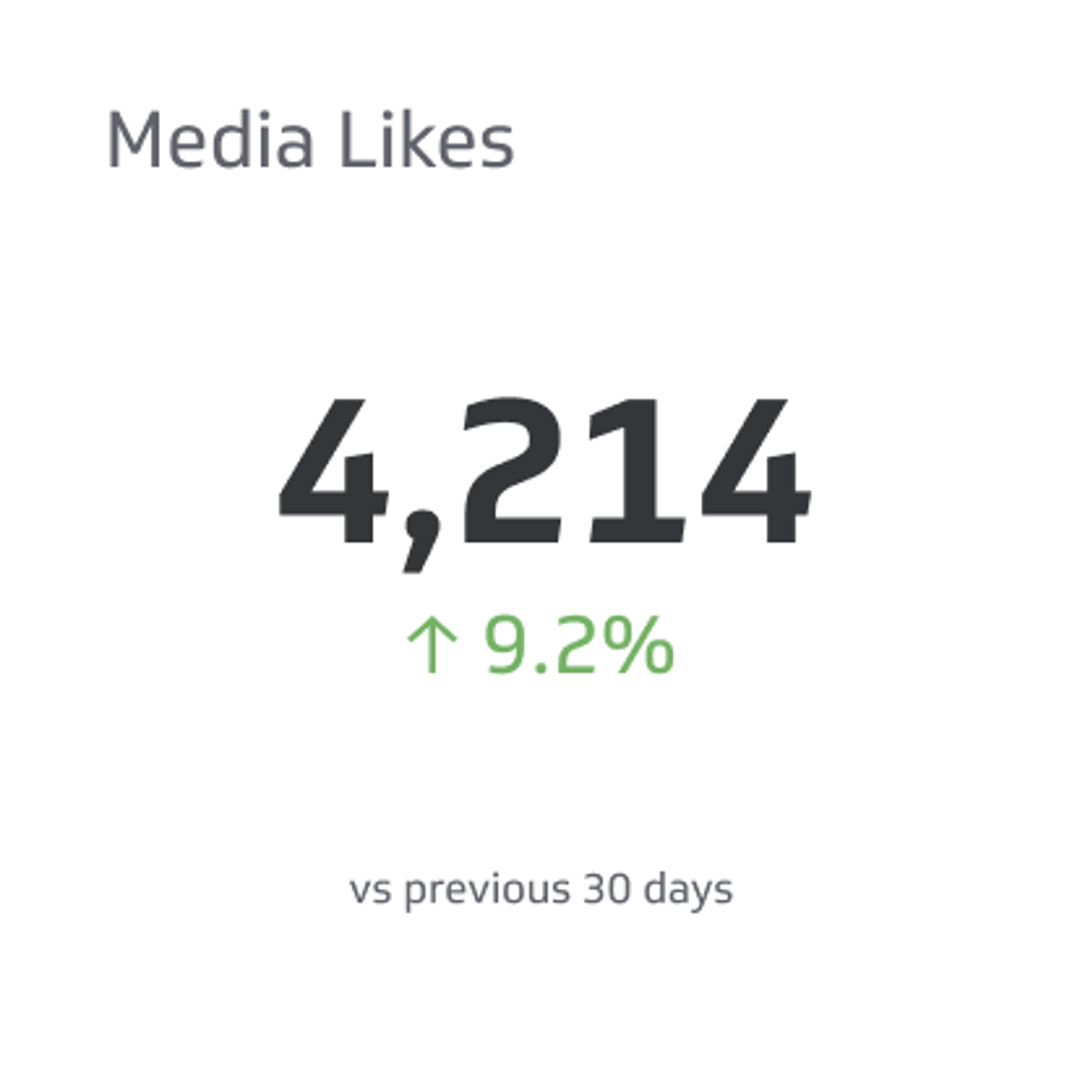
Media Likes
Media Likes is the total count of likes you receive on multiple formats of media posted on your social media page.
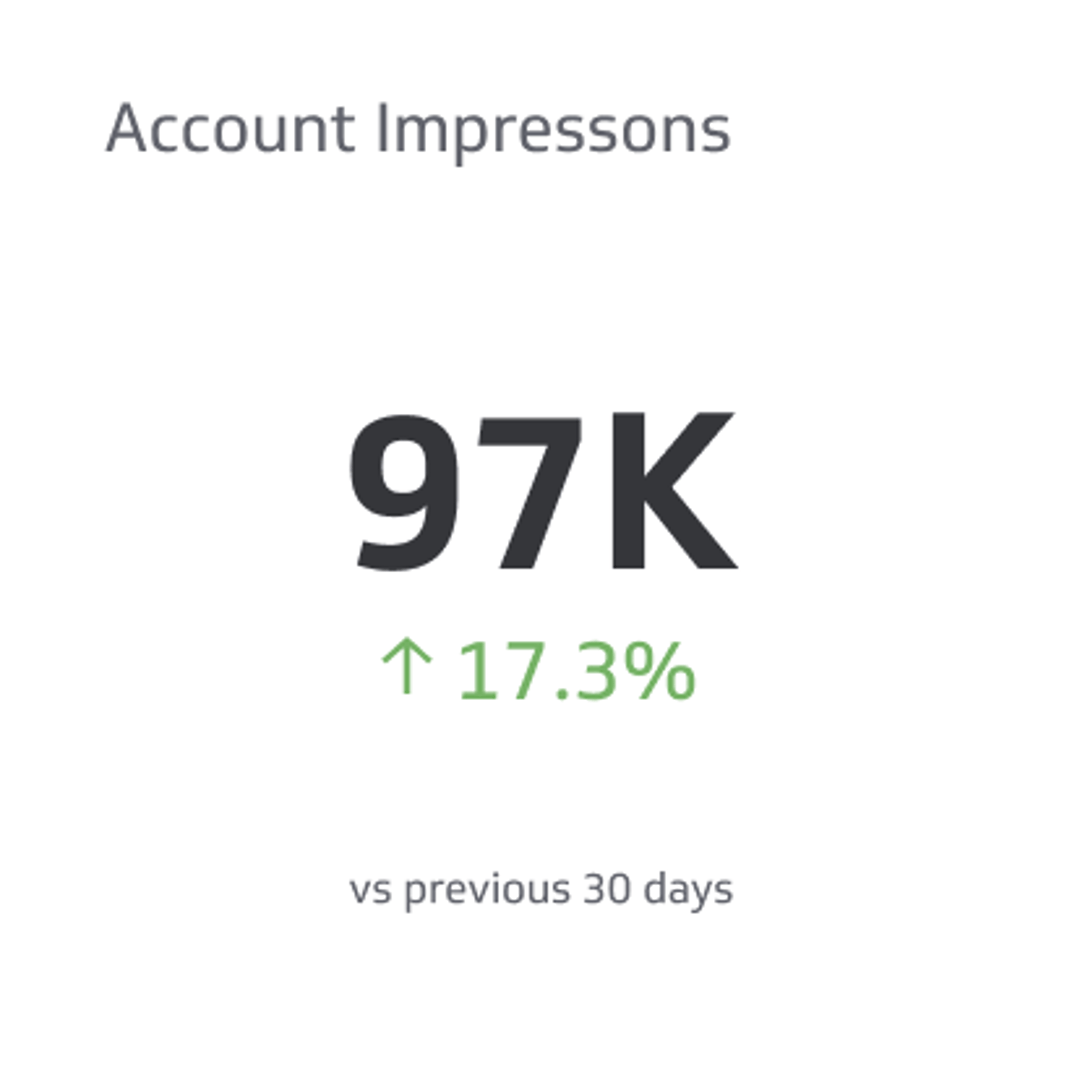
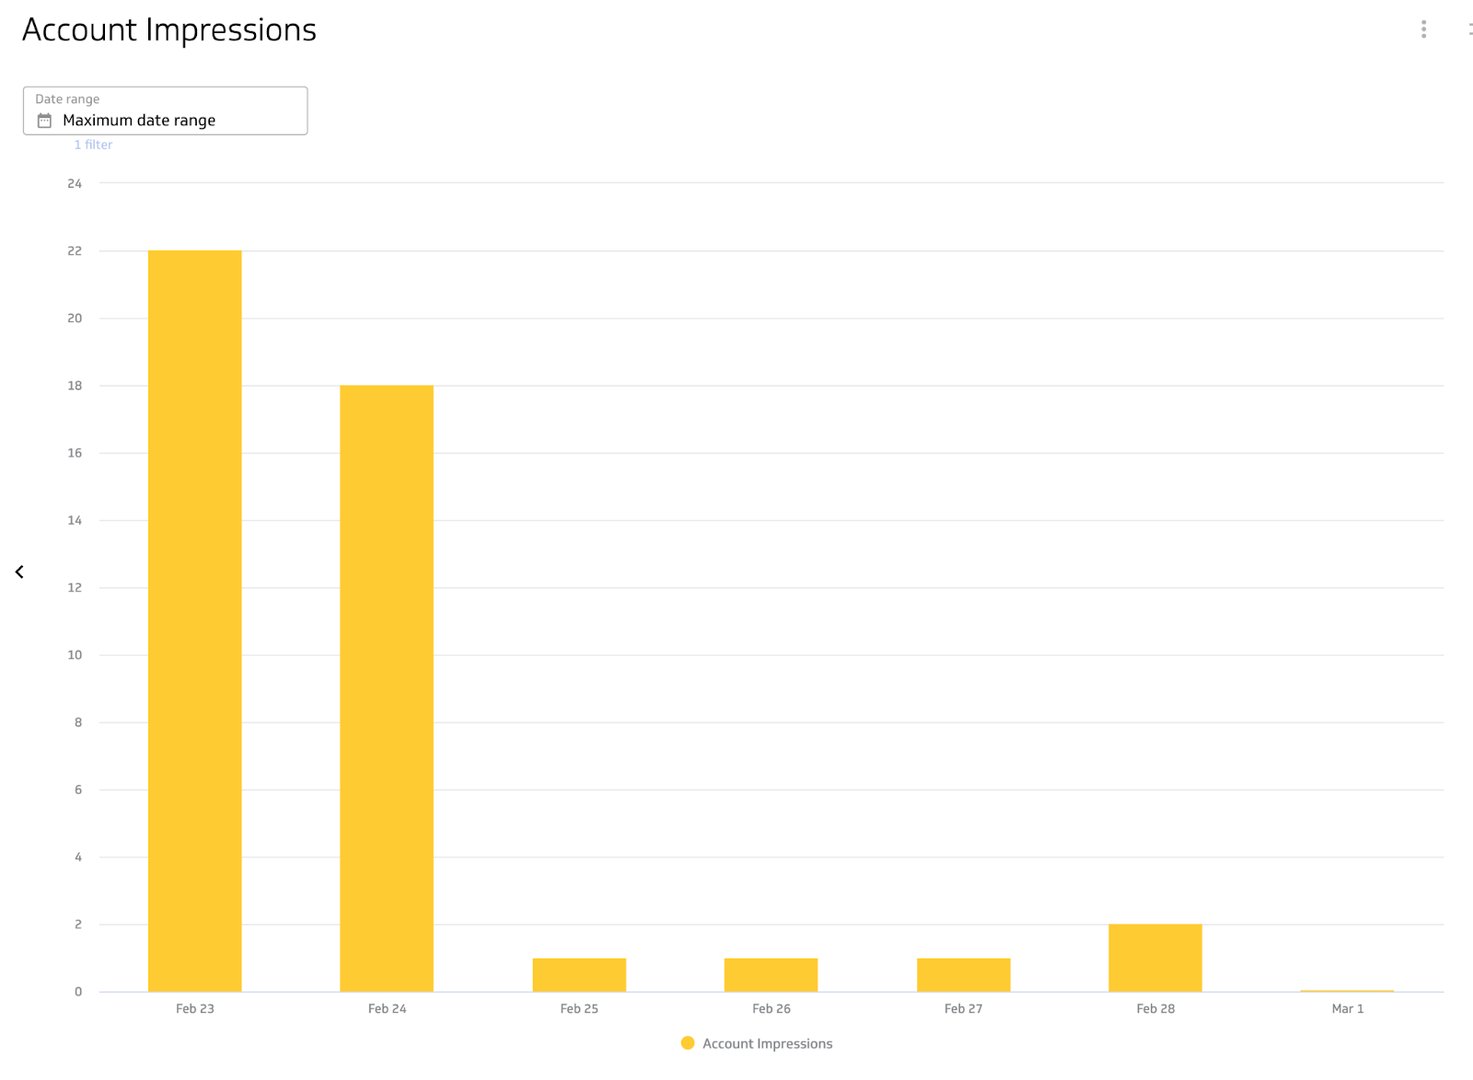
Account Impressions
Account Impressions counts the total number of times posts or ads from an account has been viewed by social media users.
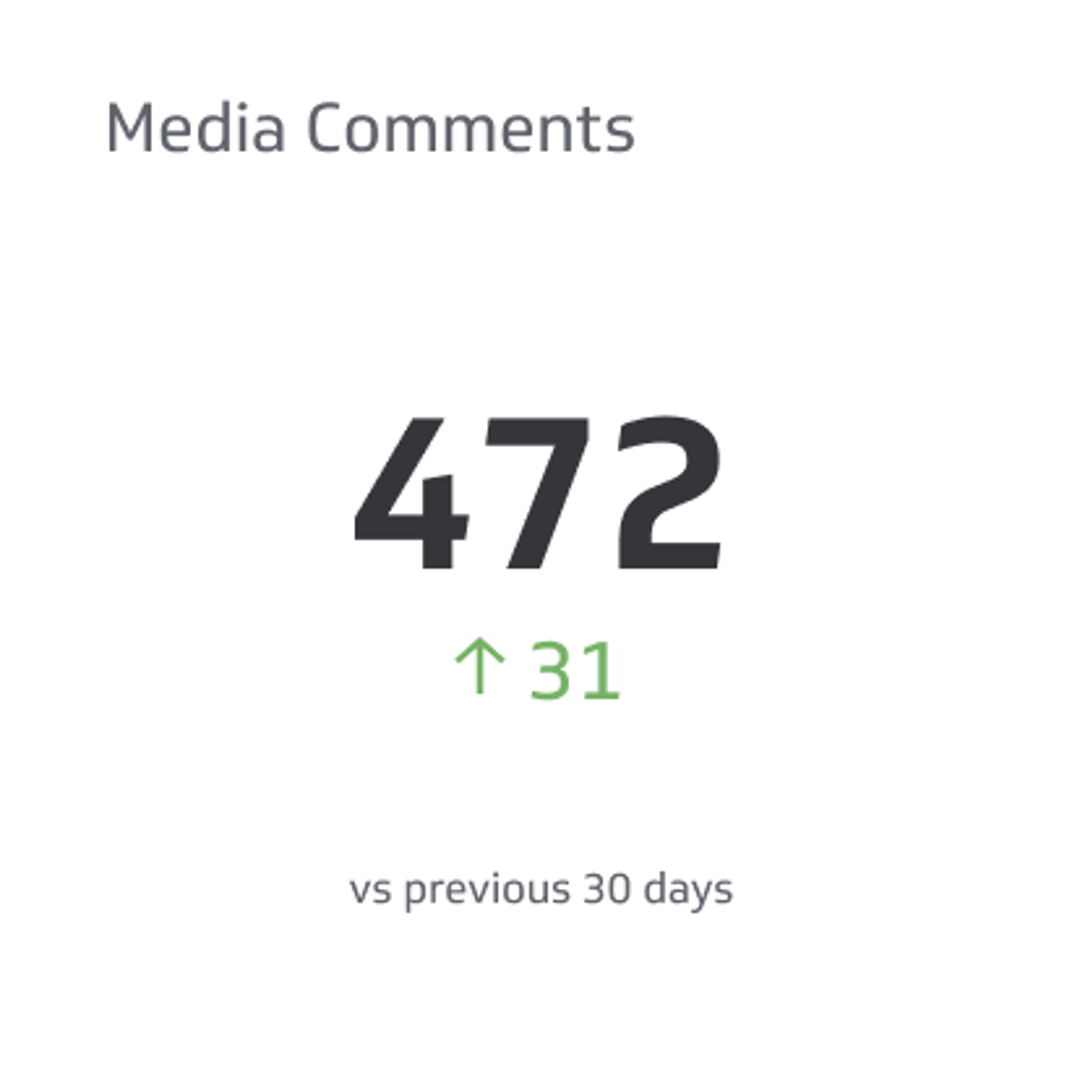
Media Comments
Media Comments is the total count of comments made on your social media content.
What type of visualization works best on an Instagram dashboard?
When you are picking your data visualizations, it’s important to understand what the goal of your dashboard is. Are you building a social media dashboard to quickly and easily understand your metrics or are you looking to dig deep into dimensionality and segmentation? The visualization types you pick will be dependent on the type of exploration you are ready to do with your metrics.
Instagram segments metrics like media comments, media engagement, media likes, media reach, and media saves by type, meaning that you can segment your metrics by time period or by media type: carousel, single image, or video.
To compare progression over a period of time
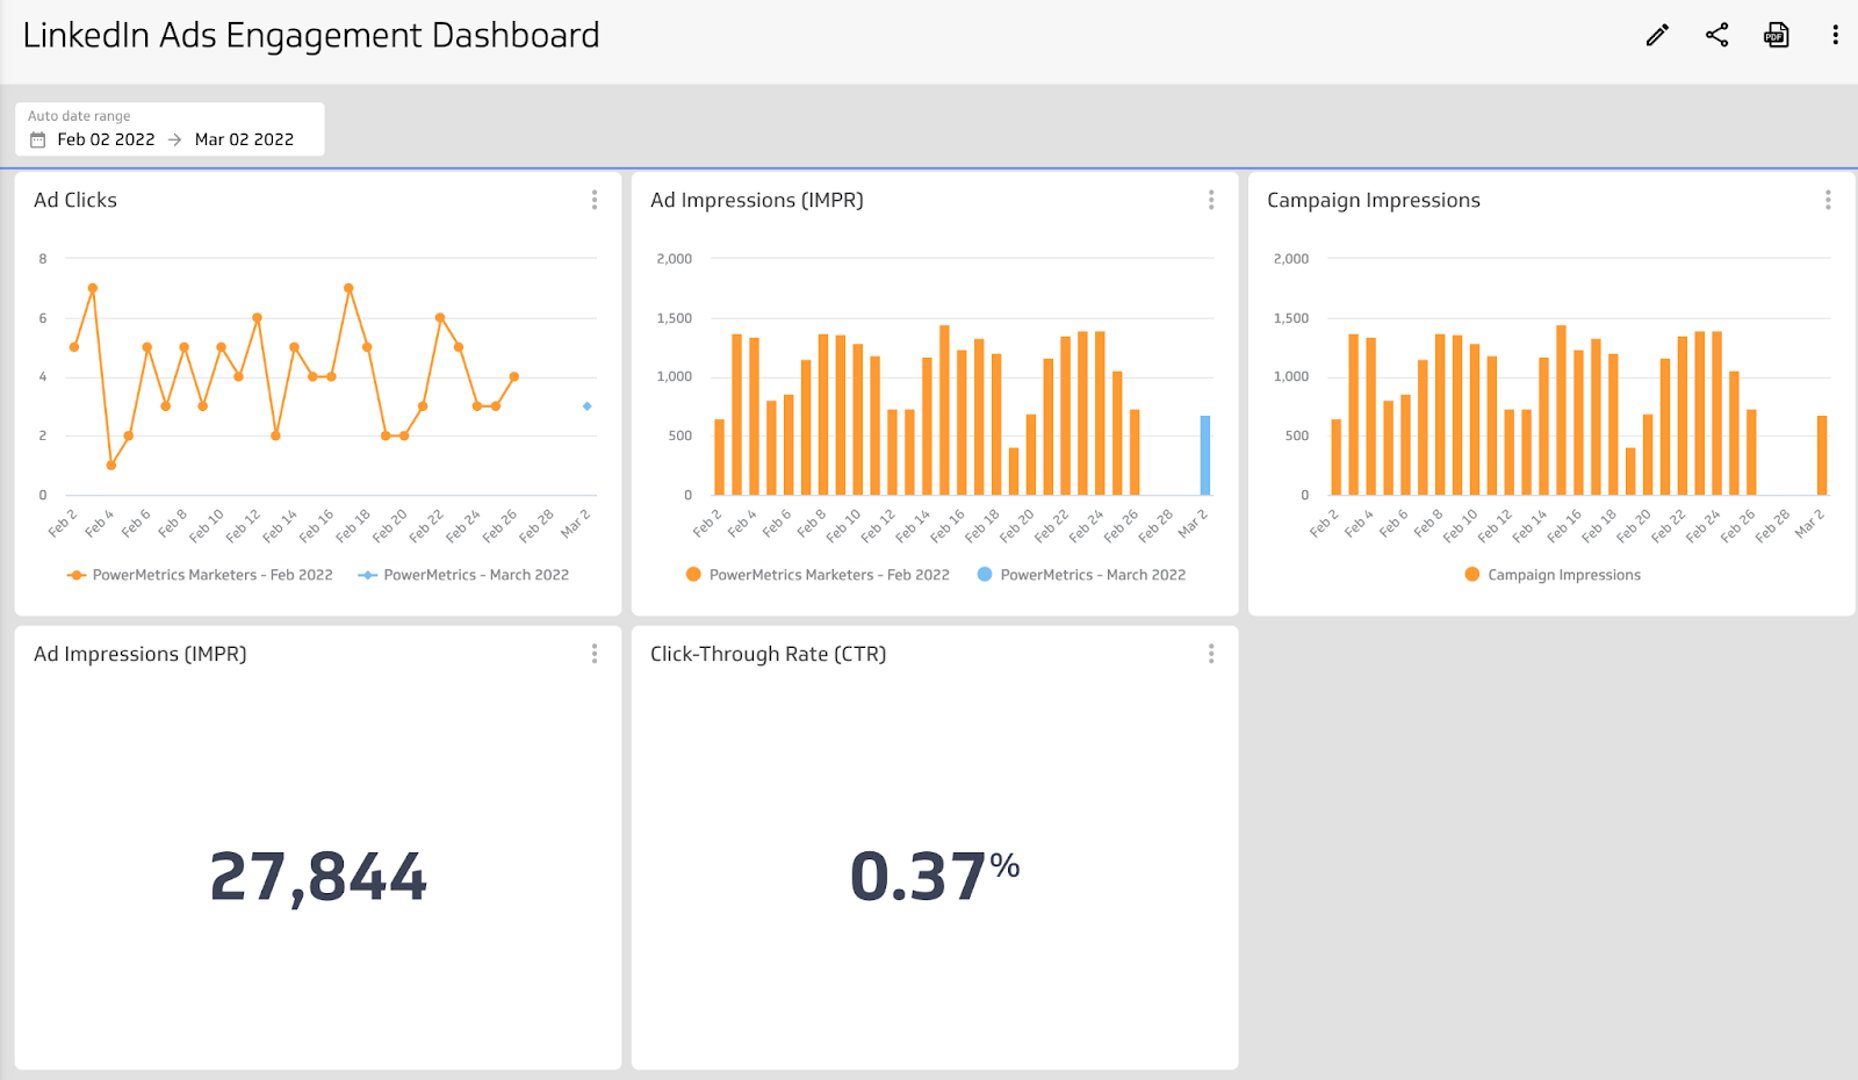
Instagram has plenty of metrics that you might want to track over a period of time, like account impressions, reach, or followers. These metrics are great candidates to use a bar or line chart so you can see how the metric tracks day over day, week over week, or month over month.
To see cumulative values
If you want to display a data point as a single numeric value, you can use a summary chart. A metric like media likes is the total count of likes your Instagram account has received. A summary chart is an excellent way to display this metric.
To see parts of a whole
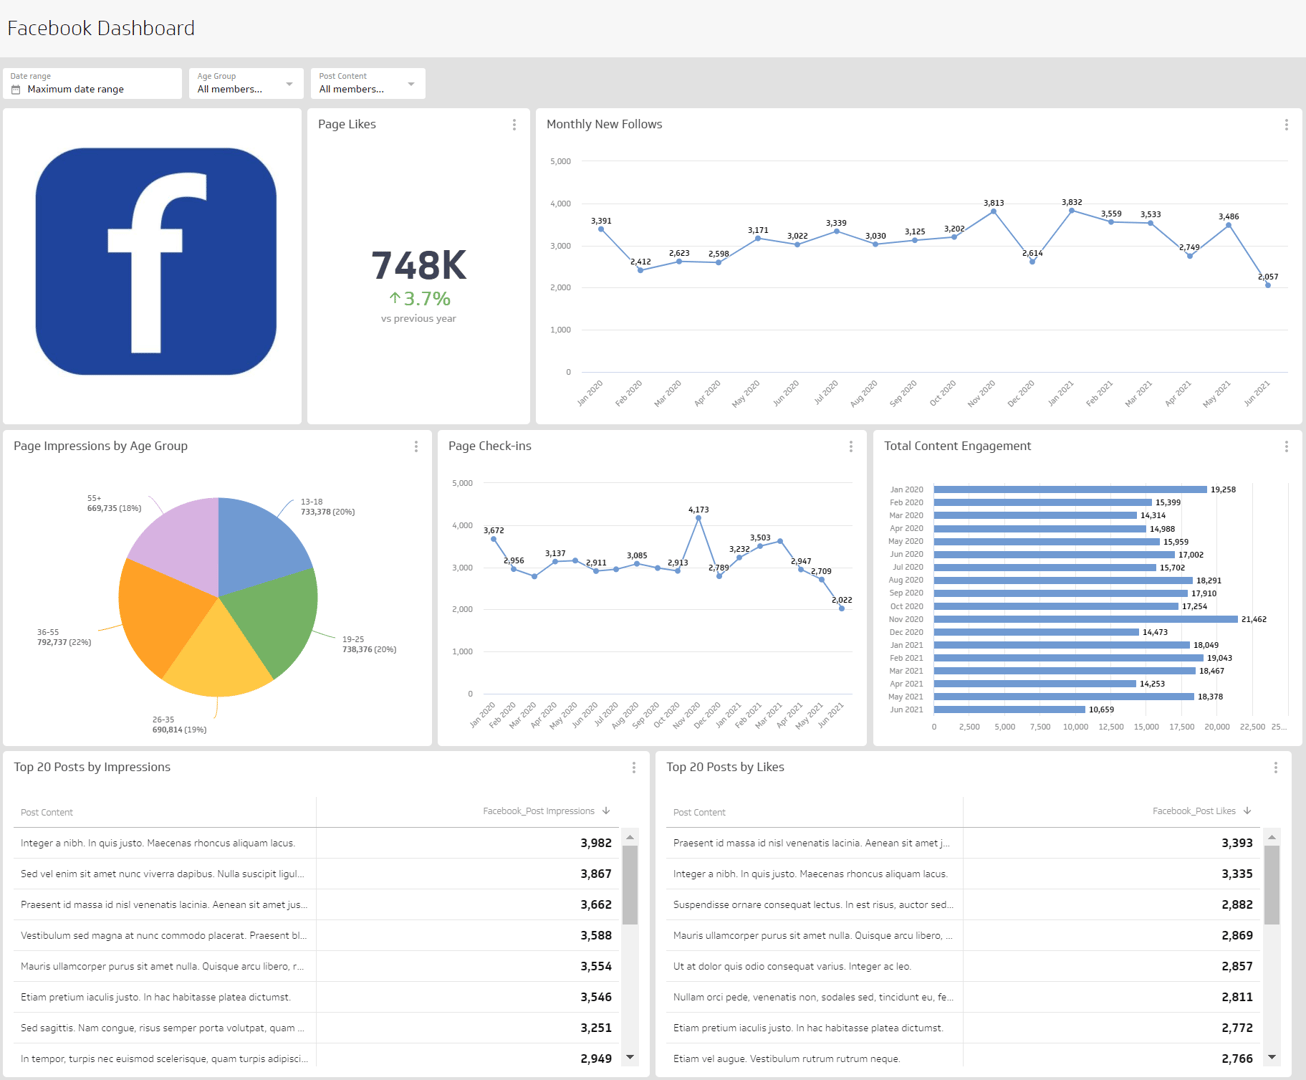
Instagram has three ways you can post to your feed: carousel images (a series of up to 10 photos), a single image, or a video. In PowerMetrics, you can segment your metrics by media type. For example, if you want to see which media type receives the most engagement by way of comments, you can display the metric using a pie chart.

Benefits of an Instagram dashboard
Instagram has a built-in analytics function for business accounts but there are limitations, including the fact that it is only accessible on mobile. Building an Instagram dashboard gives you and your team access to the metrics that shape your Instagram strategy. An Instagram dashboard also gives you the power and flexibility to adjust date ranges, pick the data visualization best suited for your metric (versus the default visualization in Instagram), and share the information with your team. In PowerMetrics you can add users and share your dashboards and metrics so you and your team are always aligned on your Instagram performance.
Dashboard inspiration for Instagram
Sometimes, the hardest part is knowing where to start. How do you organize your Instagram metrics in a way that makes sense for you, as the subject matter expert, and for others who may be referencing your dashboard? Here are a few examples of an Instagram dashboard that you can build to achieve specific reporting goals or focus areas.
Track your overall account performance on Instagram
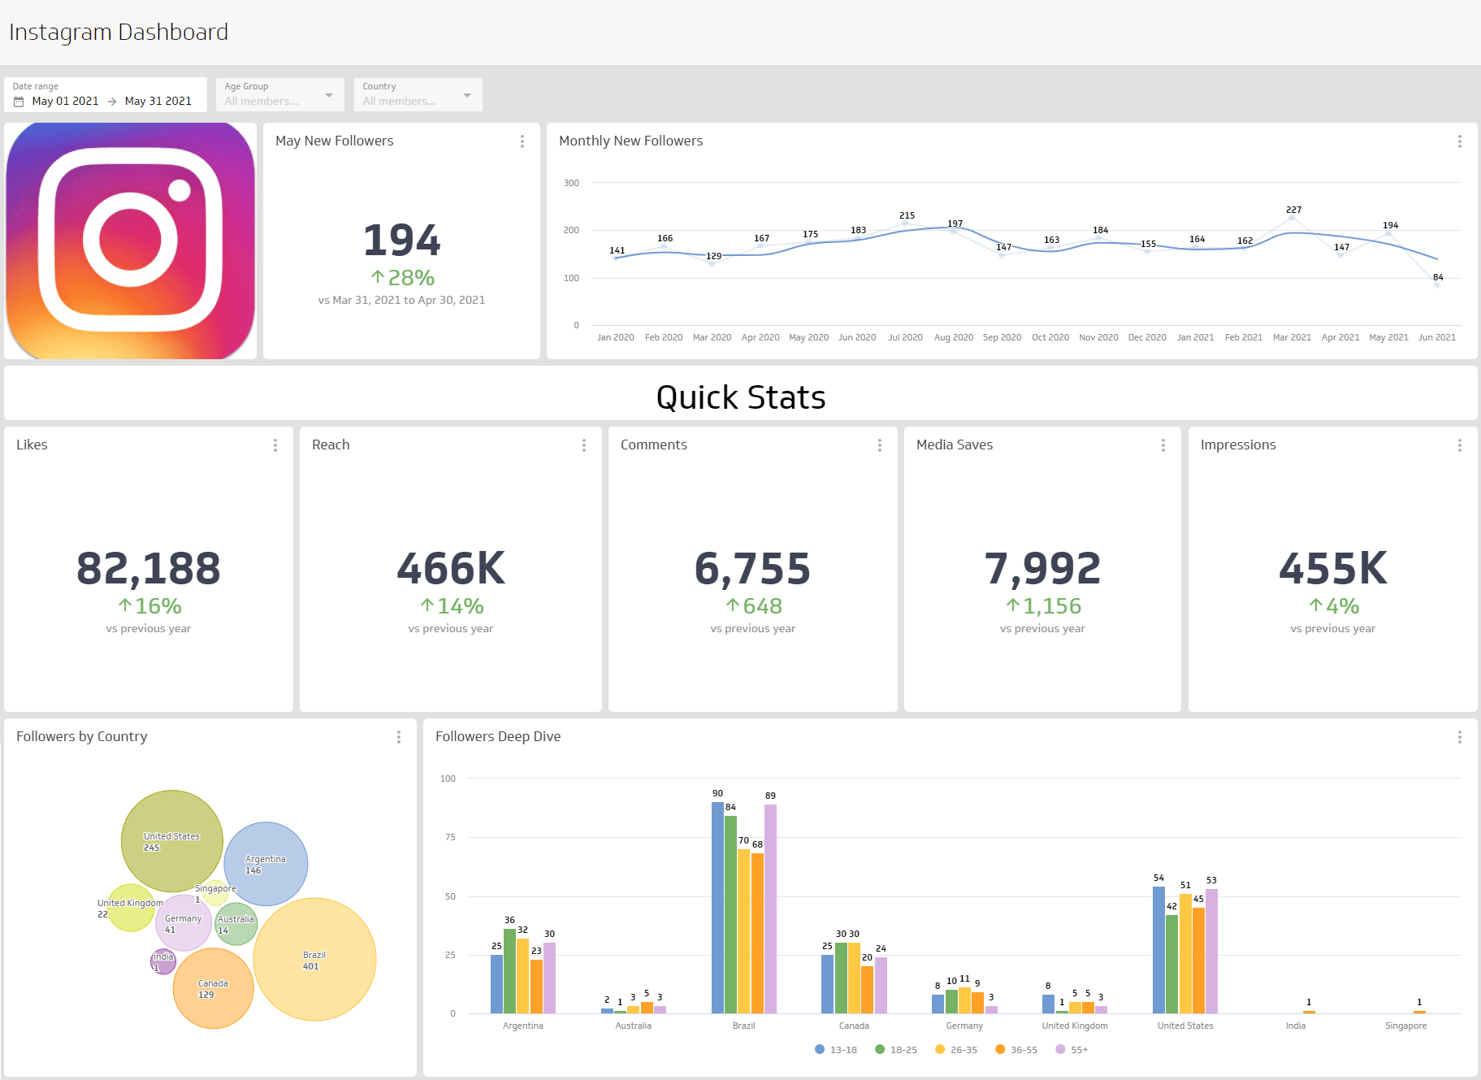
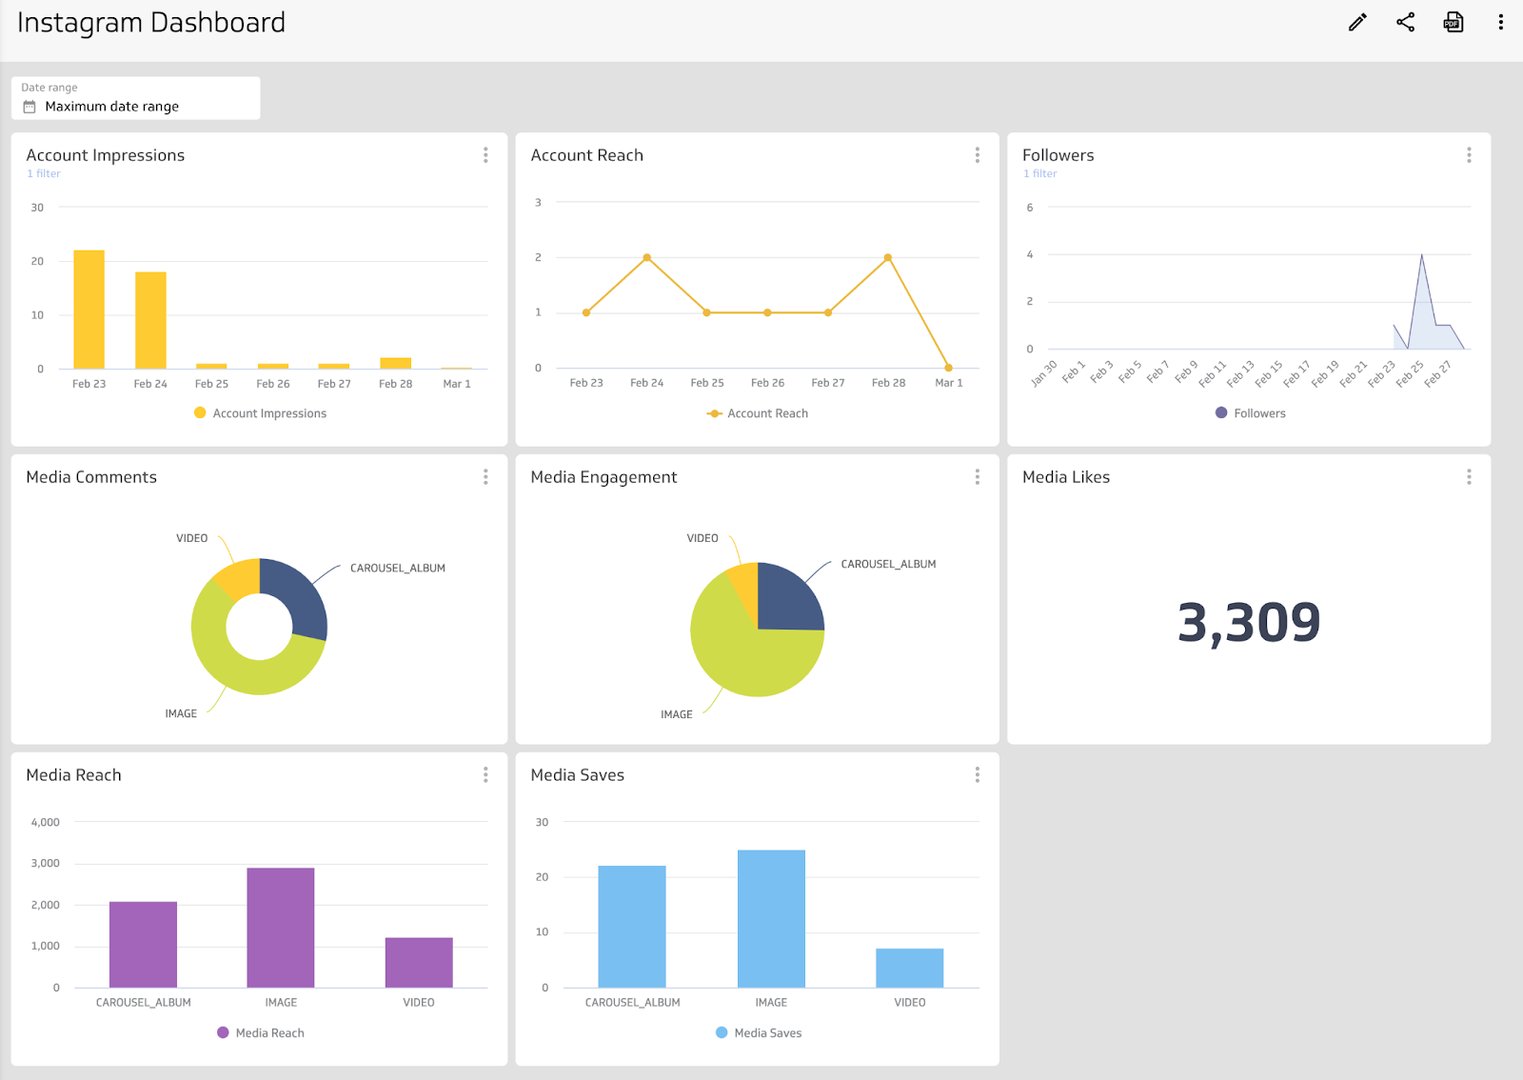
Growth, engagement, reach— put all of the most important Instagram metrics all in one place on an account overview dashboard. This dashboard will help you answer questions like:
- How many accounts is my content reaching?
- Does one media type perform better than another?
- How many followers do I have on Instagram?
- How are people engaging with content (likes, comments, saves)?
What does success look like with an Instagram dashboard?
When you build an Instagram dashboard, you have a visual reporting tool that gives you and your team insight into the metrics that measure your marketing efforts. The data you present on your Instagram dashboard should help you solidify a social media strategy that works for you and your business.
Related Dashboards
View all dashboards
