- Industry Solutions
- Klipfolio for Not for Profits
All of your NFP organization data in one spot.
Industry leading dashboard reporting tool for Not for Profits
All your data in one place
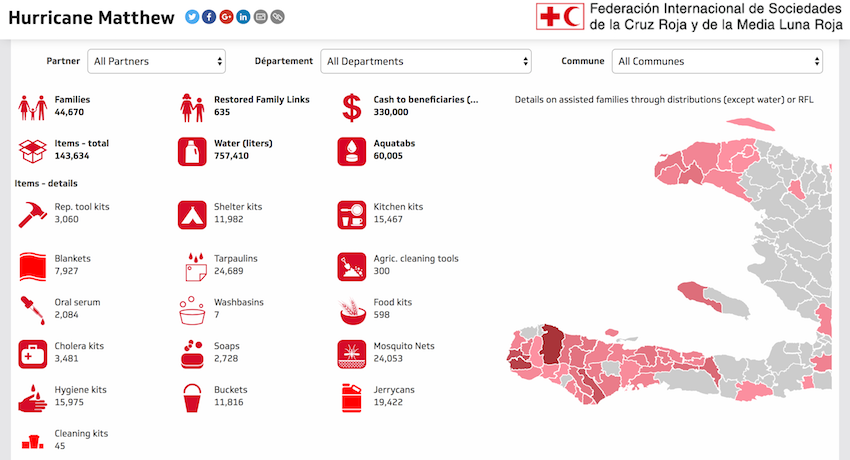
Not for Profit organizations strive to create a better world, be it with a mission to solve a small-scale, localized issue or as big as Red Cross’s mission to aid vulnerable people world-wide.
And while each Not-for-Profit’s main goal might change, what certainly doesn’t change from one NFP to another is the importance of data-monitoring. Unlike many for-profit businesses, these organizations seem to be behind the curve in adopting data visualizations - and in doing so they are missing out on a huge opportunity to grow their success. Monitoring data in dashboards help Not for Profits keep their focus on issues that matter while keeping business processes and success in mind. The dashboards, and therefore the metrics themselves, can be focused on various “themes” each with the aim to better visualize your impact and overall business success.
The first, and arguably the most important data points that charities should be monitoring are those that measure impact. How much progress has been made in finding a cure for x? How many more people are talking about an issue? How many people have directly been helped by the NFP’s efforts? All these metrics not only show the overall impact, but also inspire it’s viewers to continue working hard.
The second dashboard should be centered around the theme of financials. It’s no secret that Not for Profits fall in the public eye if their financials aren’t allocated properly. Being able to answer questions like: How are donations being spent? What is the ROI on your advertisements? How many donations are coming in, and what do they look like compared to this time last year? with full visibility will help the NFP ensure that all financials are properly organized and utilized to increase impact.
Other dashboards can be more focused towards marketing processes, legislative influences, or research progress - all of which can be valuable with the right key performance indicators (KPIs).
Not for Profit dashboard examples
Curious to see what you can track in Klipfolio? Here are just a few examples of the nonprofit dashboards you can build. View the Live Dashboard examples to get a better look.
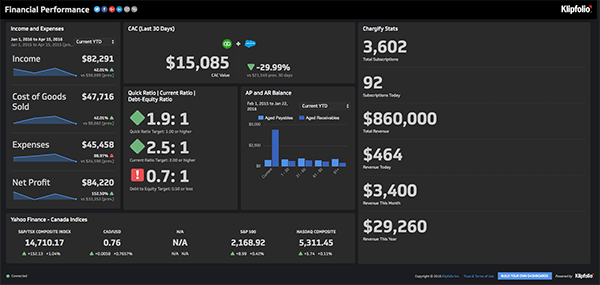
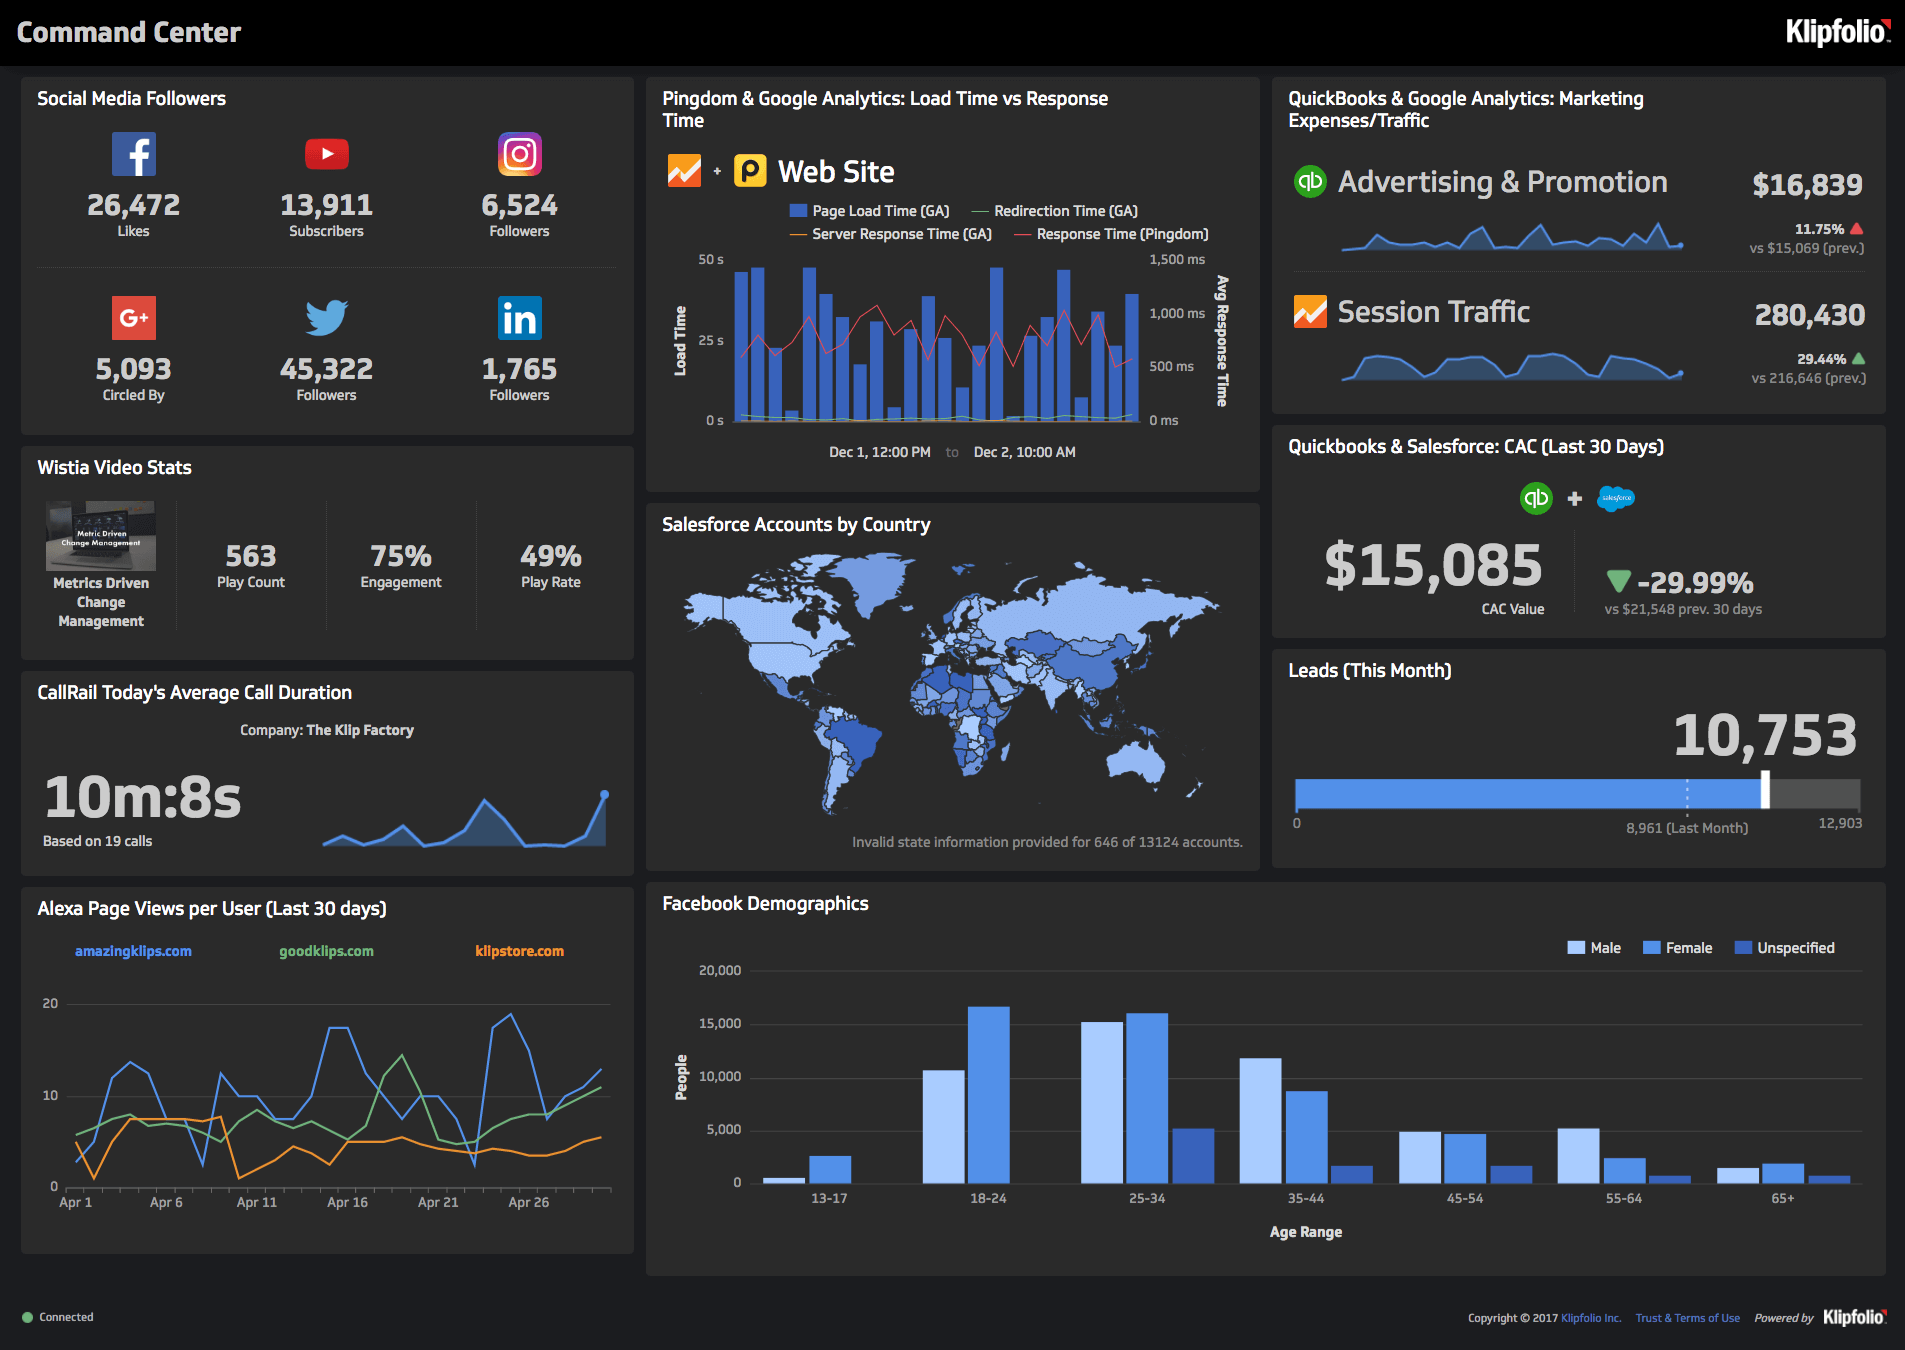
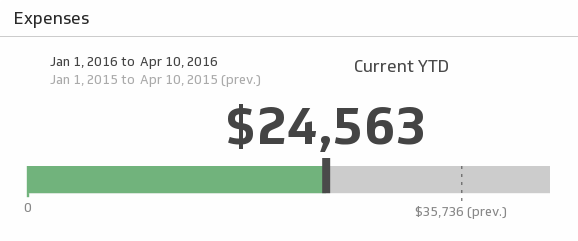
Executive Dashboard
- Drill down into the financial performance of your nonprofit company
- Track your net profit and expenses
- Rally your team around optimizing financial performance and accountability
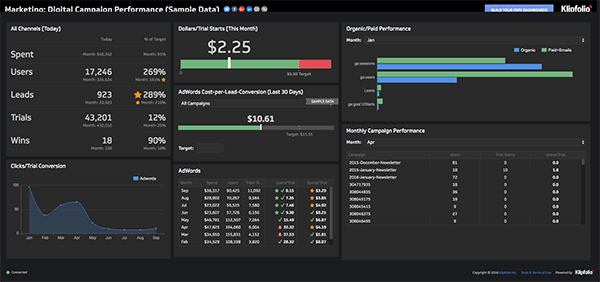
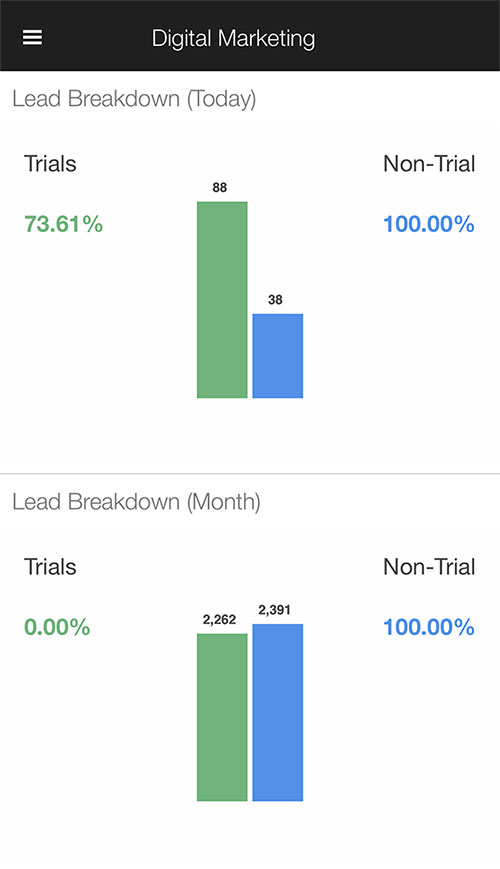
Campaign Performance Dashboard
- Compare your charitable campaign performance from month to month
- Monitor your cost per lead and conversion ratios
- Motivate your team with dymanic data on marketing efficaciousness
Metrics for Nonprofits
Want to motivate your team and stay up to date on your data, but not sure which metrics to start with? Not to worry, we've compiled a list of common nonprofit KPIs (key performance indicators) our users have built using Klipfolio. If you are looking for more, check out our KPI Library:
- Donations YTD
- Donation method
- Social conversations
- Social engagement
- Social sentiment
- Marketing ROI
- Individuals helped
- Total capital/resource share
- Donation funnel
- Campaign reach
- Upcoming fundraisers
How to track your not for profit metrics with Klipfolio
Klipfolio allows you to pull in data from all of the platforms you use to track your charitable organization's data—and display precisely what you need in a single interactive dashboard. What does this mean for you? No more wasting precious time manually checking and rechecking reports with various versions of dynamic data. And you can get started with just a few clicks. Click here for a complete list of all our integrations.
Building in Klipfolio
Our professional services users love Klipfolio because it empowers them to build their own dashboards. Sure, it takes time to get it right, but it’s absolutely worth it.
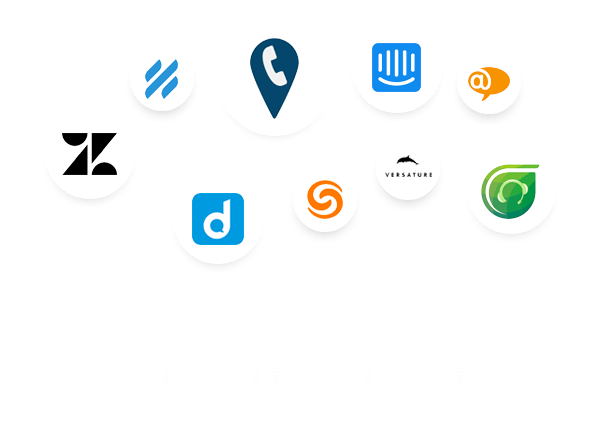
Connecting your data
You’ve got an impressive technology stack, but how do those puzzle pieces fit together? Klipfolio is an API machine with 100s of connections to the support services you use to run your business.
Browse the 100+ services you can connect toThe Editor
Love to tinker and build but tired of using Excel to share your data? The Klip Editor is where you bring your data story to life. Build custom data visualizations that you can share with your entire company.
Custom visualizations
Drag-and-drop visualizations from the palette to start assembling your custom dashboard. Choose from standard data visualizations like charts, bullet charts, and scatter plots. Or get creative and inject custom HTML into your dashboard. The choice is yours.
Sharing
Data is meant to be shared. A dashboard without any viewers is, well, kind of sad. Wouldn’t you agree?
Which is exactly why we make sure you can share with your team and clients through multiple channels.
TV dashboard display
Our customers love showing off their dashboards on wall-mounted TVs throughout the office. It’s a great way for executives to nurture a culture of data transparency and the team to see their performance at a glance. Plus, it looks super cool.
Slack, email snapshots, and links
Send Klips or entire dashboards via Slack, setup manual or recurring email snapshots, and share links to your live dashboard.
Mobile
Get access to all your dashboards with our mobile app for iPhone and Android! Just because you're on the go doesn't mean you should miss out on your data, right?
A special deal for Not-For-Profits
We’re both proud, and humbled by the many Not-for-Profit organizations around the world who work with Klipfolio, and we want to make our platform as accessible as possible.
To show our gratitude for the work nonprofits do for individuals around the world, we provide a discount for these entities. To learn more about this offer, get in touch with our team.