

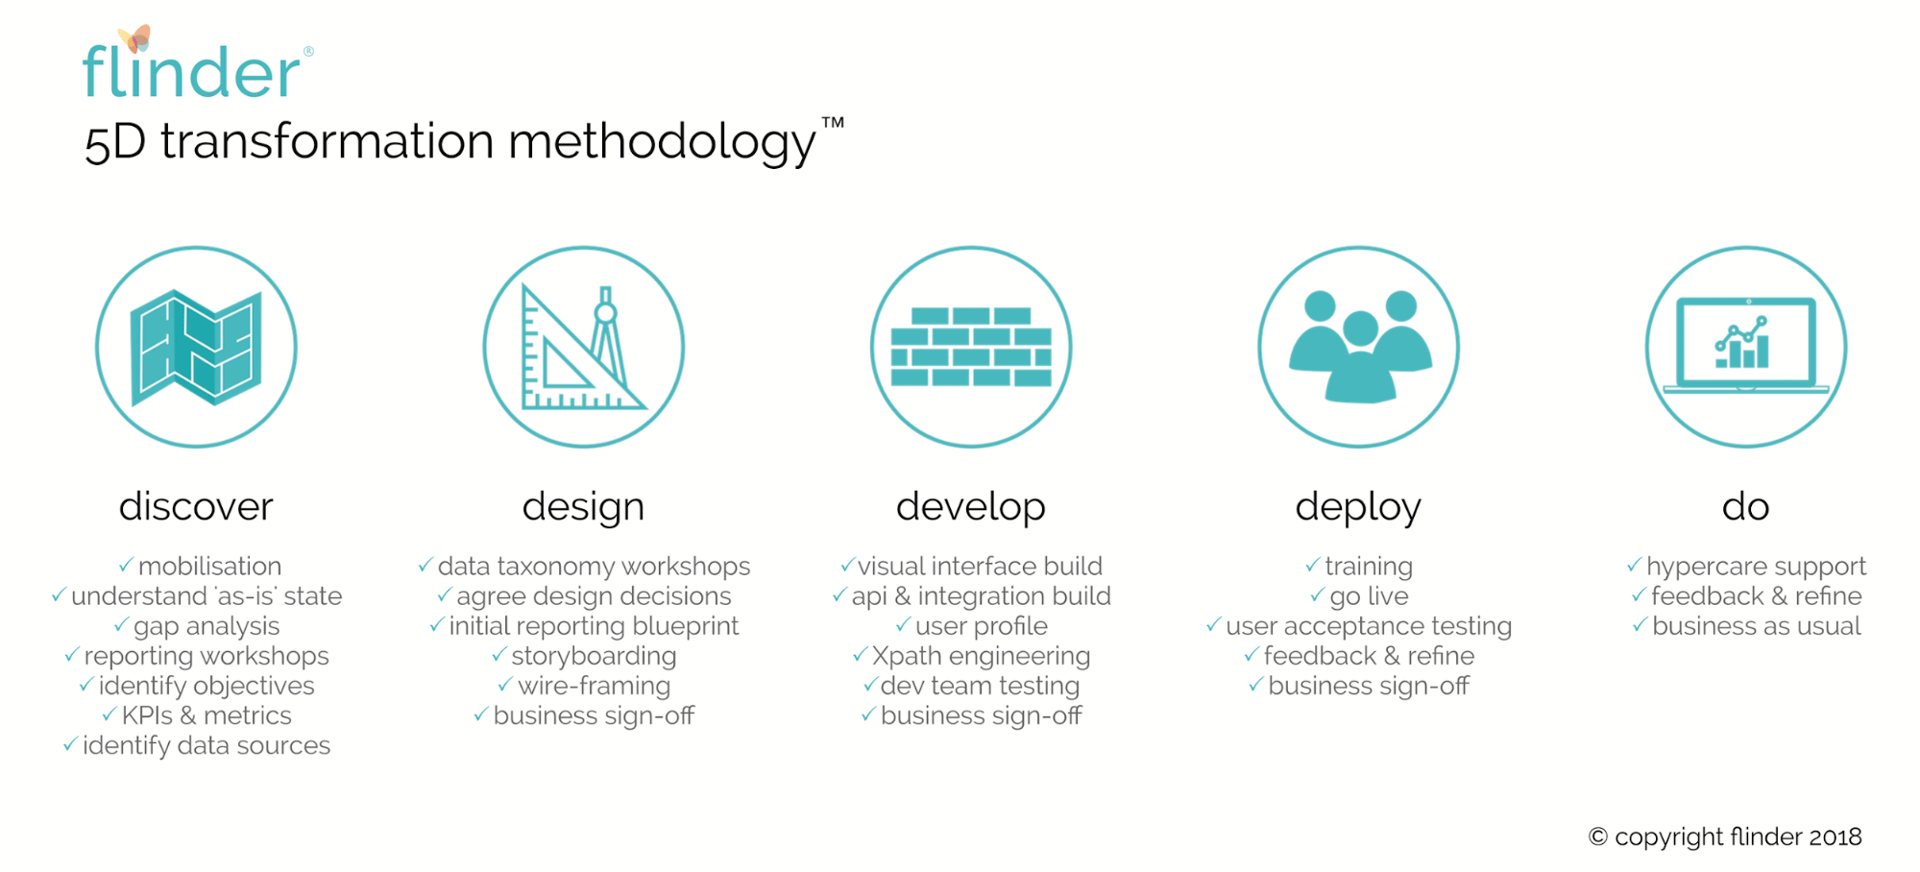
Summary - Learn how flinder used Asana, Klipfolio, and a custom Python middleware to streamline All Hands meetings, improve focus, and reclaim time through strategic dashboard reporting.
Connecting our project management tool with Klipfolio—and a clever workaround in between—transformed how we run our Monday All Hands meetings. The result: sharper focus, faster decisions, and time back on the calendar.
In this article, I'll share how we built a real-time dashboard that filters noise, surfaces what matters, and changed the way our team works together.
Key learnings from this article
- Align reporting to business strategy, not just available data.
- Work around API limitations with creative solutions (we built a middleware layer using Python).
- The right dashboard shifts team behaviour, sharpens focus, and reclaims time.
The problem: meetings that ran too long
We're a growing firm that values continuous improvement. In the last 12 months, our team doubled in size. That growth brought a problem: our Monday All Hands meetings became packed with client updates, activity reports, and weekly deadlines. Meetings routinely ran over. Information overload set in. The team struggled to focus on what truly mattered.
We needed a way to surface priorities and filter out the noise.
The solution: start with the end in mind
We followed a structured approach: define what you need to run the business, then work backwards to the data.
This mindset was crucial. Rather than settling for whatever data our tools could easily provide, we designed the dashboard around our actual business questions. That creative freedom led to a solution perfectly aligned with our needs.
Identifying the data we needed
Once we pinpointed what each stakeholder wanted to see, we identified the data gaps. We were already using Asana to manage projects, implementations, and client work. The logical first step: leverage what Asana could provide natively.
Asana has a built-in project status feature. Each project can be marked red, amber, or green with a status update. Team members get reminders to keep statuses current. It's clean and encourages adoption.
But there was a catch: Asana's native dashboard works at the individual project level, not the business-wide view we needed.
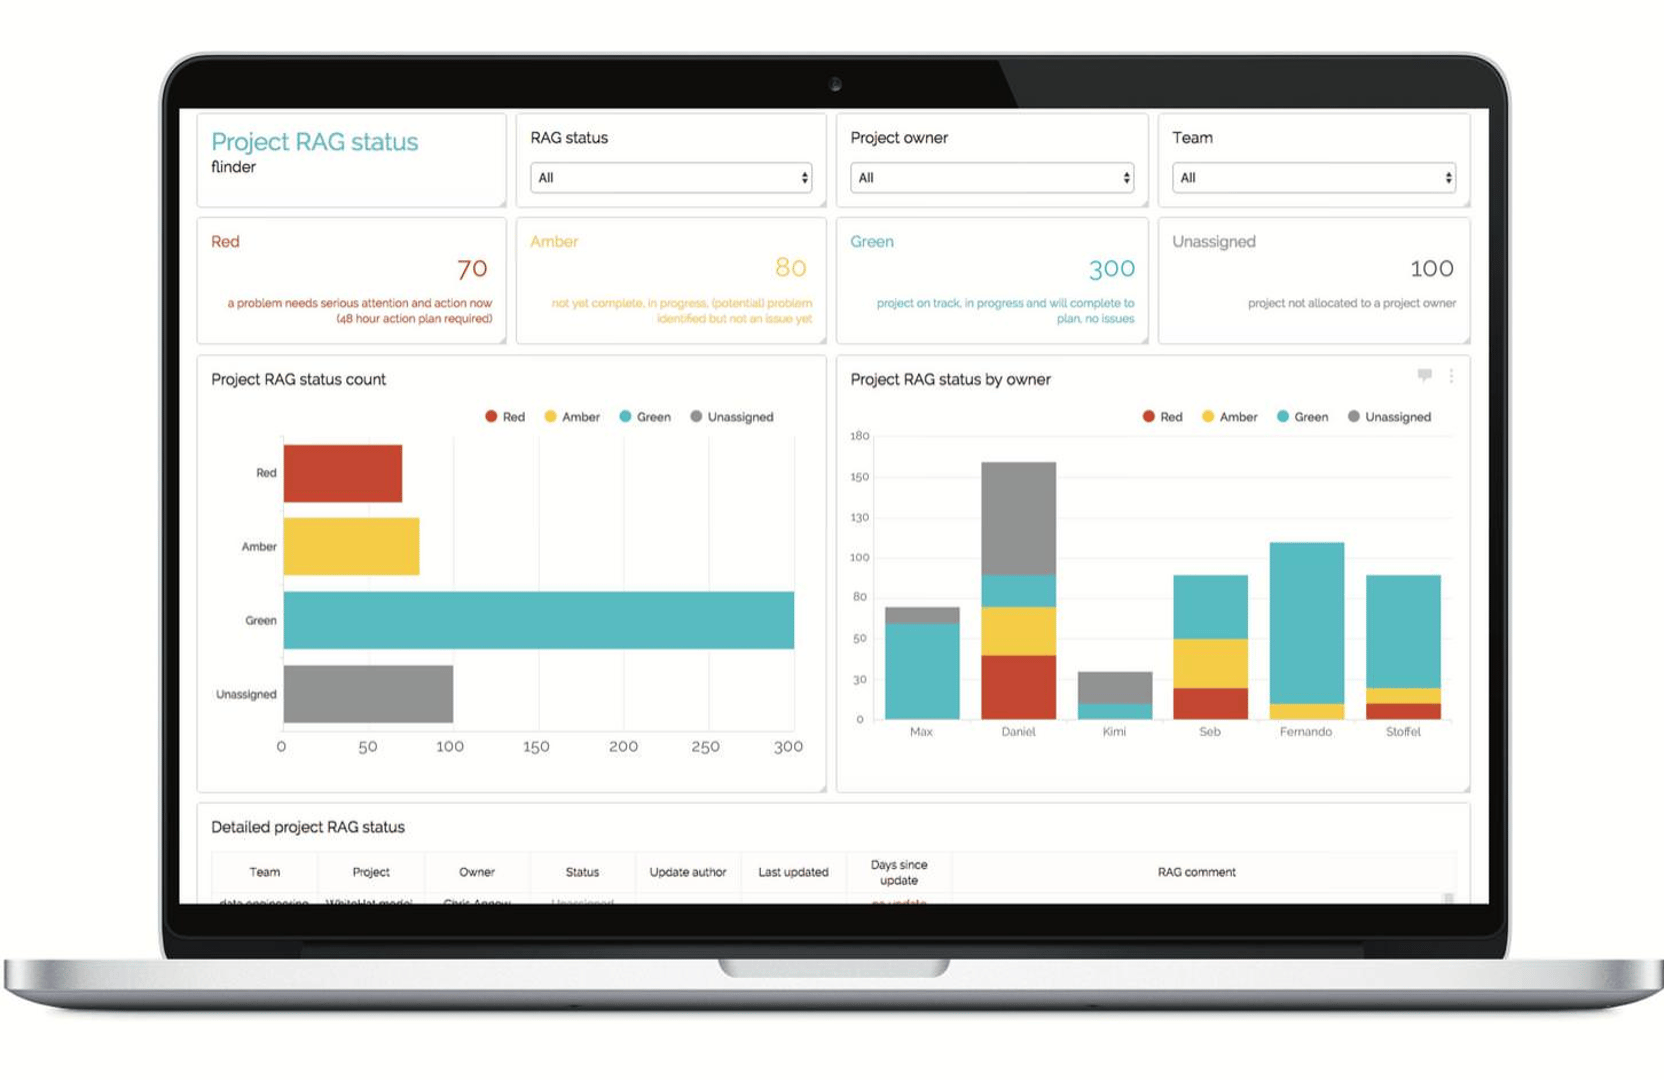
We wanted to see all projects at a glance, segmented by team, owner, and status. That's how we'd filter priorities in the meeting. One-by-one project reviews wouldn't work at scale.
The challenge: Asana's API limitation
Asana's API returns one project at a time. Pulling all projects into Klipfolio directly wasn't practical. We needed a unified, aggregated view—and Asana's API wasn't designed for that.
Here's where many teams give up. They accept the constraint and work within it.
We didn't. Because we'd started with the business need—not the tool's limits—we were motivated to find another way.
The workaround: a custom middleware layer
Klipfolio's REST connector is powerful, but it's only as good as the data source feeding it. We decided to build our own data layer between Asana and Klipfolio using Python scripts.
The approach has three steps:
1. Extract data from Asana
We wrote Python scripts that loop through all live projects in Asana and pull the exact fields we need. By filtering at the extraction stage, we reduce noise and keep the data lightweight. This improves dashboard performance and keeps processing clean.
2. Store and combine the data in our cloud
The scripts run hourly and append each project's data to a single, unified dataset stored on our own cloud server. This acts as a middleware layer—a single source of truth that Klipfolio can query cleanly.
3. Connect Klipfolio to our custom API
Klipfolio's REST connector pulls from our API, delivering exactly the data we need: all projects, real-time status, segmented by team and owner.
The result is a dashboard built on our terms, not the tool's constraints.
How the dashboard changed our meetings
The new dashboard became our meeting agenda. We now review projects by status: red items first, then amber. This focus cuts meeting time and keeps discussion where it matters.
Team members see their projects reflected accurately. Accountability is clear. Status updates stay current because the dashboard is always visible.
Most importantly, we reclaimed time. Meetings that once ran 45 minutes over now finish on schedule. The team stays engaged because the signal-to-noise ratio is dramatically better.
Key takeaway: reverse-engineer from the outcome
Don't start with what your tools can do. Start with what your business needs to decide and act.
Once you know that, work backwards. Identify the data required. Find where it lives. Build bridges if the tools don't connect cleanly.
The effort to create a middleware layer paid for itself in the first month through time saved and decisions made faster. That's the power of putting strategy first and constraints second.
About flinder
flinder is a registered accounting practice in the UK, founded in 2017 by Alastair and Luke—two entrepreneurs with accounting backgrounds. Both worked at PwC in assurance and consulting before founding flinder to help growing businesses scale. With 25 years of combined experience working with entrepreneurs, they built flinder to combine their passion for business growth with their own.
Related Articles

6 dashboards I use daily to run my SaaS company
By Allan Wille, Co-Founder — April 10th, 2026
Klipfolio Partner How-To #1: Duplicating dashboards across client accounts
By Stef Reid — November 27th, 2025
The Starter Guide to Dashboard Design
By Emily Hayward — September 24th, 2025