Proving your LinkedIn Ads performance with dashboards

Published 2023-07-20
Summary - So you’ve decided to advertise on LinkedIn. Smart! With over 500 million users, it’s a great way to share products, services, and content with the right people at the right time. As the marketer in charge of your LinkedIn Ads, you know that getting your ads and landing pages set up is just the first step. Tracking your ad performance, conversions, and social ad ROI is the most
So you’ve decided to advertise on LinkedIn. Smart! With over 500 million users, it’s a great way to share products, services, and content with the right people at the right time.
As the marketer in charge of your LinkedIn Ads, you know that getting your ads and landing pages set up is just the first step.
Tracking your ad performance, conversions, and social ad ROI is the most important part of running ads on platforms like LinkedIn.
Proving marketing performance and ROI is tough enough as it is. Proving social media and social advertising ROI is a whole other ball game. Learn more about LinkedIn Analytics Tools
So where do you start?
I’m guessing your first stop is the LinkedIn Campaign Manager, which makes perfect sense. You can get a good view into how your ads are performing and which ones are getting the most engagement. It might look something like this.
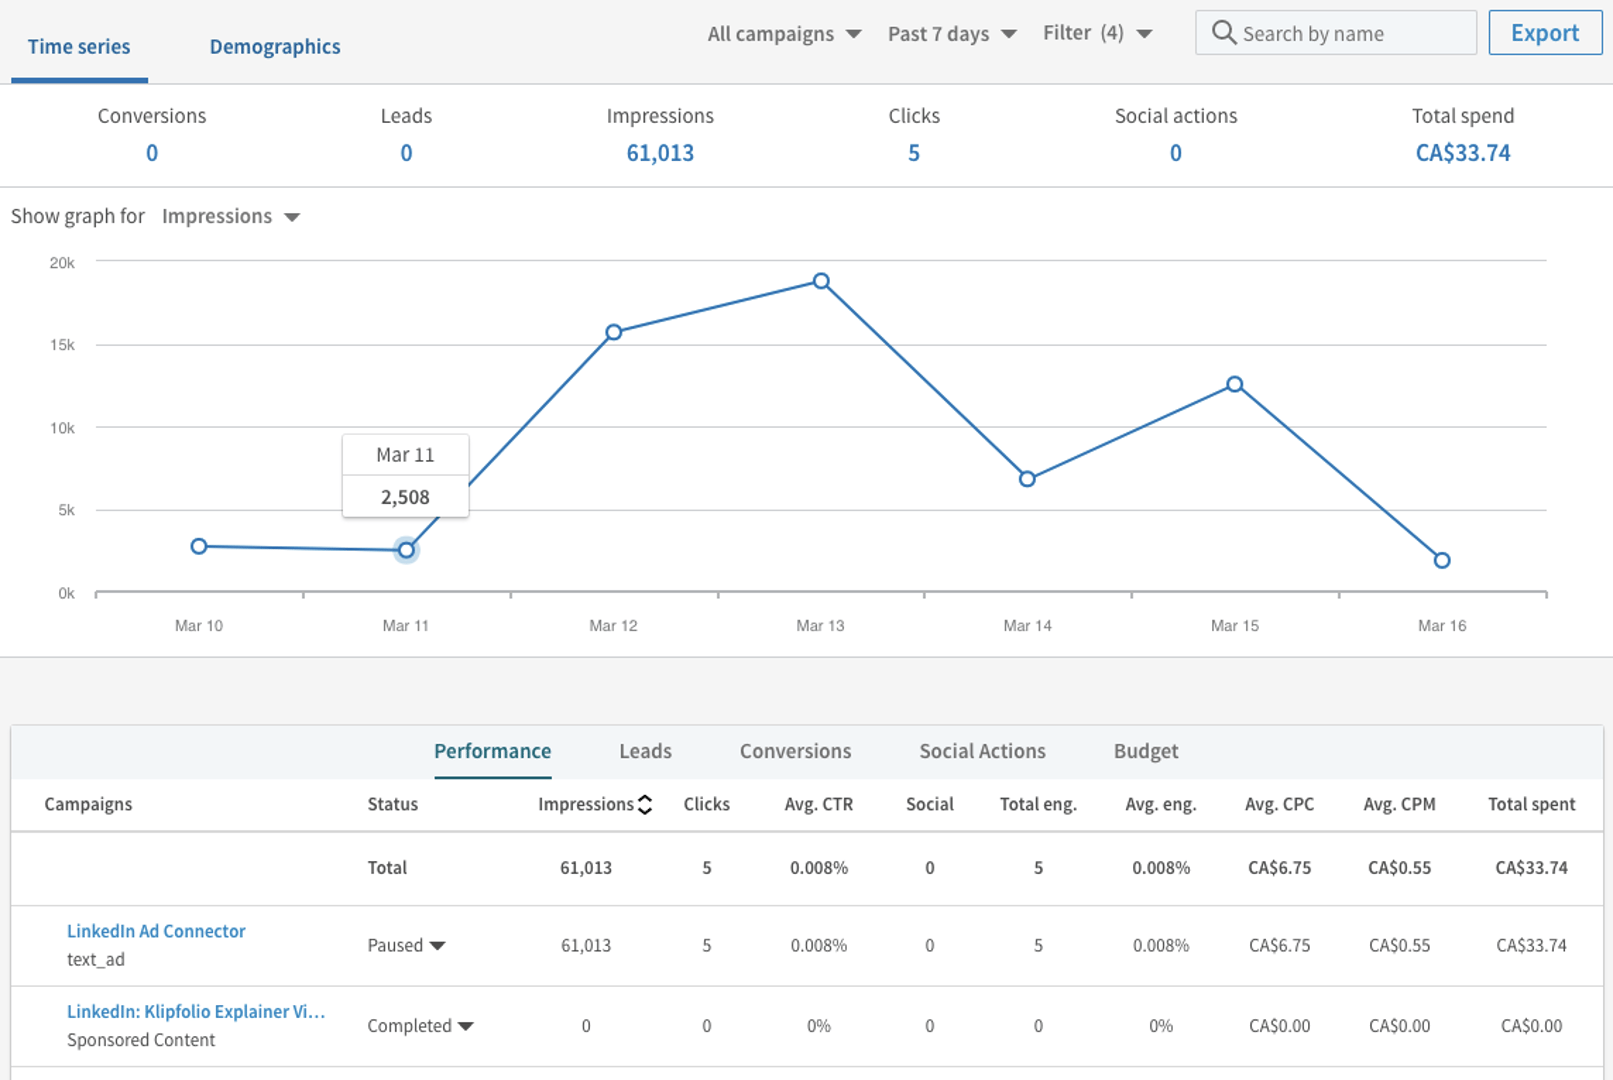
And this is a great start, but how are you sharing this with executives and stakeholders who don’t have access to the data or want a quick answer?
If the answer is in a Google or Excel Sheet … I feel your pain!
It takes time and effort to actually put something together in a third party tool that people will take the time to look at. And it’s tough to digest the data when it’s all numbers and no visualizations.
Another common issue with relying solely on Campaign Manager, is the lack of data for what happens after a user clicks on your add. It’s hard to sell the story of your LinkedIn Ads performance when it ends after a click.
So what now? How do we as marketers justify the budgets and channels we’re using to sell our products and services?
Enter Klipfolio.
With Klipfolio, you can build your own custom dashboards using your LinkedIn Ads data along with data from 100s of other popular services. Below, you’ll see just one example of what you can build. The sky really is the limit.
LinkedIn Ads Dashboard Example
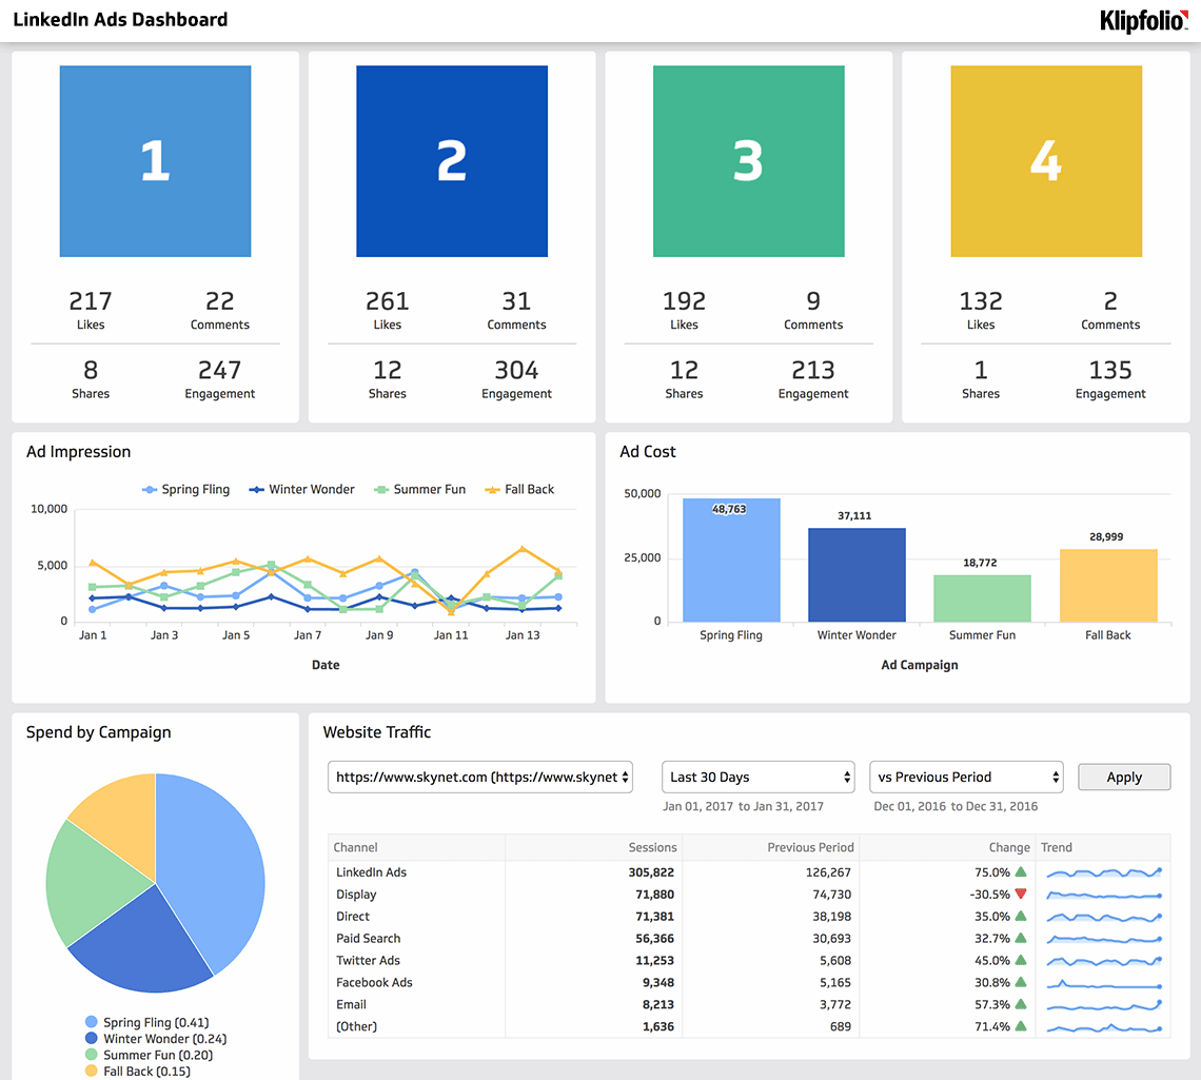
So why use Klipfolio to monitor your LinkedIn Ads data? Good question.. Here are just a few of the benefits:
Beyond the numbers
When you’re trying to justify budgets and advertising channels, it’s important to really sell your efforts. Sharing a huge Google or Excel sheet fill with numbers definitely won’t tell a compelling story.
When executives and stakeholders look at a giant sheet of numbers, they’ll scan for a few key numbers, make a quick decisions or judgments, and rarely check back unless their specifically asked to.
Not the greatest experience right? This is where dashboards and data visualizations play a huge role in selling marketing efforts. You can use compelling visualizations to show growth, big wins, and results of A/B tests. You can also show the actual ad within a dashboard to help remind everyone what is active in your campaigns.
Even though the numbers are the same from a Google or Excel sheet to a dashboard, the way you present the data can make or break your case. When executives and stakeholders can see progress and data driven decisions being made by a team, they tend to question the efforts of that team less.
Take the time to build a dashboard that proves you’re doing the right things for the business!
Easily share your data
Having your executives and stakeholders log into Campaign Manager or a Google Sheet to proactively look at your data is probably not likely to happen.
This is where dashboards come in handy! With Klipfolio, you can build your dashboard and share it in a bunch of different ways:
- Share a public dashboard link with your team that they can access anytime without logging in
- Send email snapshots with individual data visualizations or entire dashboards that your team can look at
- Embed your data on your website and have it update automatically
- Have your team download our mobile app so they can see the dashboards on the go
- Go old school and print your dashboards as PDFs
With so many options, there’s no excuse for every member of your organization to be up to date on your advertising efforts and performance.
Dig deeper into your data
This is probably one of the biggest benefits of using a dashboard to track your LinkedIn Ads performance.
With the ability to connect to 100s of services, you can provide data beyond the typical Campaign Manager metrics.
Use multiple data sources to build visualizations that help track the journey of users who click or engage with your ads. Paint the full picture of how your social advertising efforts are bringing visits and conversions to your site beyond what typical reports show you.
LinkedIn Ad metrics you can track in Klipfolio
Have we peaked your interest? If you’re not 100% convinced yet, check out just a few of the metrics you can track in Klipfolio:
- Website conversions
- Video starts
- Company page clicks
- Likes
- Comments
- Follows
- Conversion value
- Engagements
- Video views
- Impressions
- Cost
- Shares
- Active ads
- Average spend
- Relevance score
- Bid insight
- Budget exhausted at
- Daily utilization
- Total utilization
- Ad recommendations
- And lots more!
Not too bad right? The best part about all of this is that you can try Klipfolio for FREE by starting a Trial Account (no credit card required). You’ll have full access to your data and can test out our platform by building a LinkedIn Ads dashboard your execs will love.
How to build a LinkedIn Ads dashboard
Now before you dive in and build your dashboard, keep in mind that Klipfolio is a really powerful tool and there is a learning curve. You might not build your dream dashboard in 20 minutes, but if you take the time to follow along and read our great resources, you’ll be well on your way to tracking your LinkedIn Ads in Klipfolio. Here’s a simplified explanation of how you can get started:
1. Sign Up or Sign In to Klipfolio
2. Go through the tour so you know where everything is!
3. Go to Library at the top right of your dashboard

4. Select Data Sources at the left of your screen

5. Click Create a New Data Source

6. Pick LinkedIn Ads from the Connector Gallery
7. Choose what metrics you want to track from the pre-built options
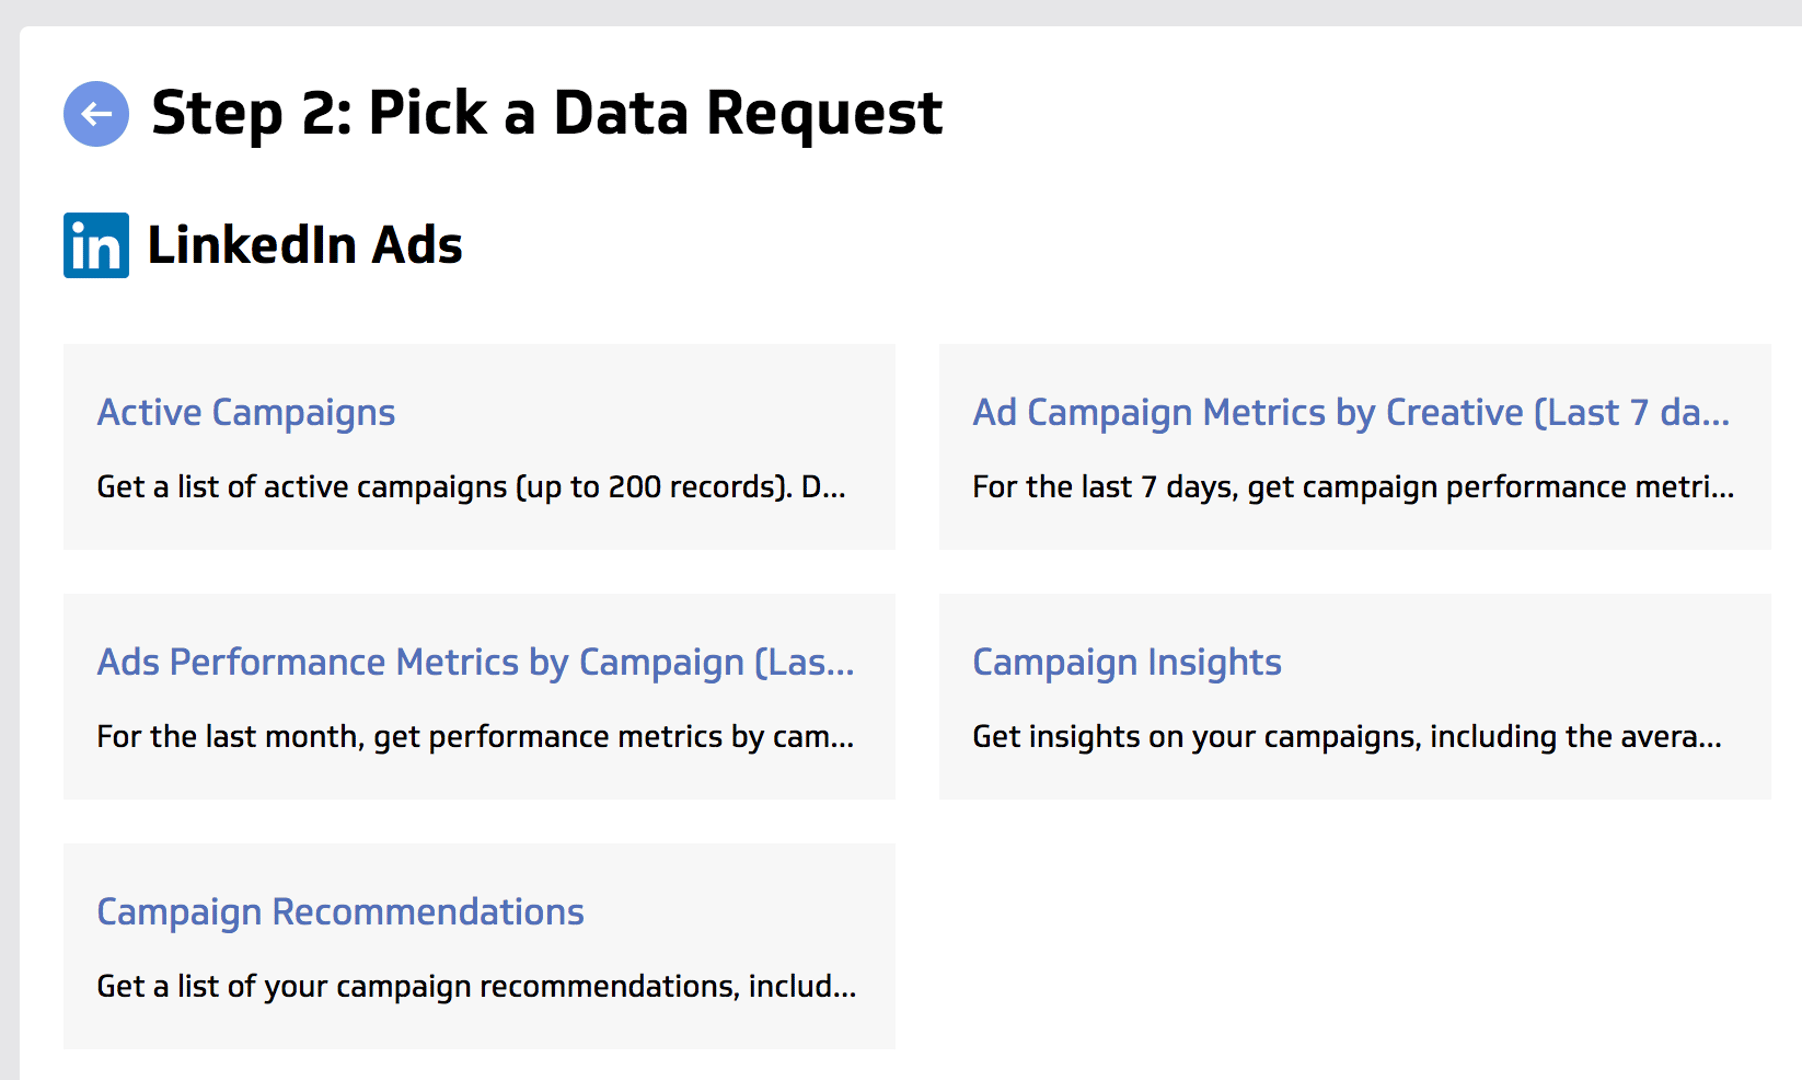
8. Connect to your LinkedIn account
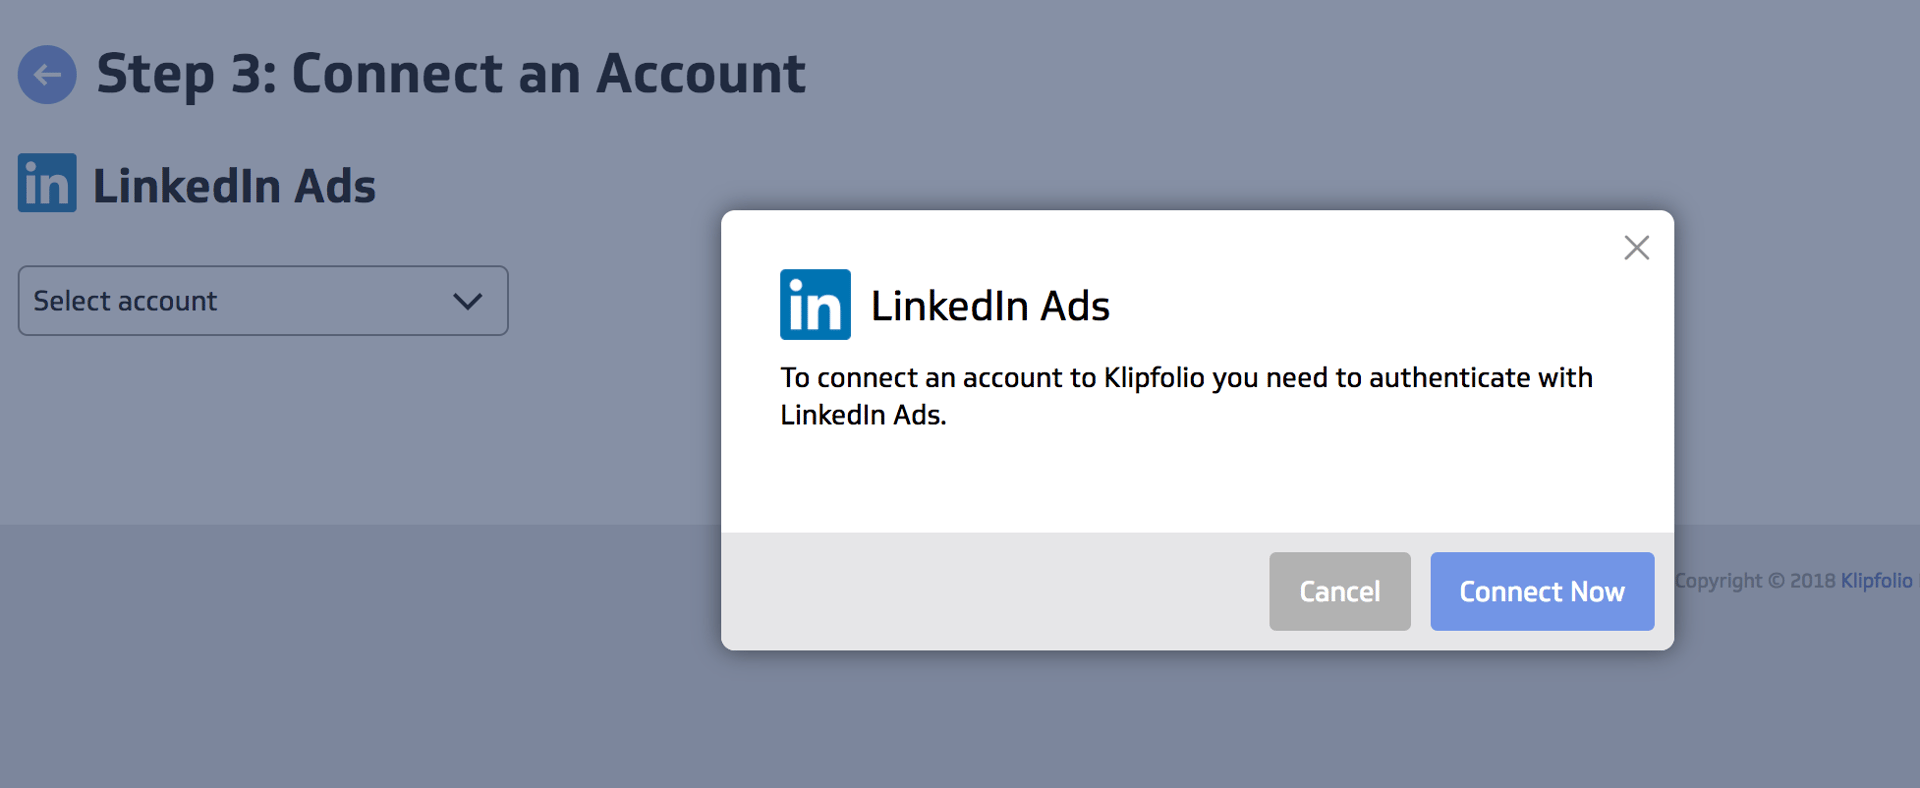
9. Choose your Campaign Name and click Get Data to pull in your metrics
10. If you’re happy with how your data looks continue into our Klip Editor
11. Pick your data visualization from the right hand side and you’re off to the races!
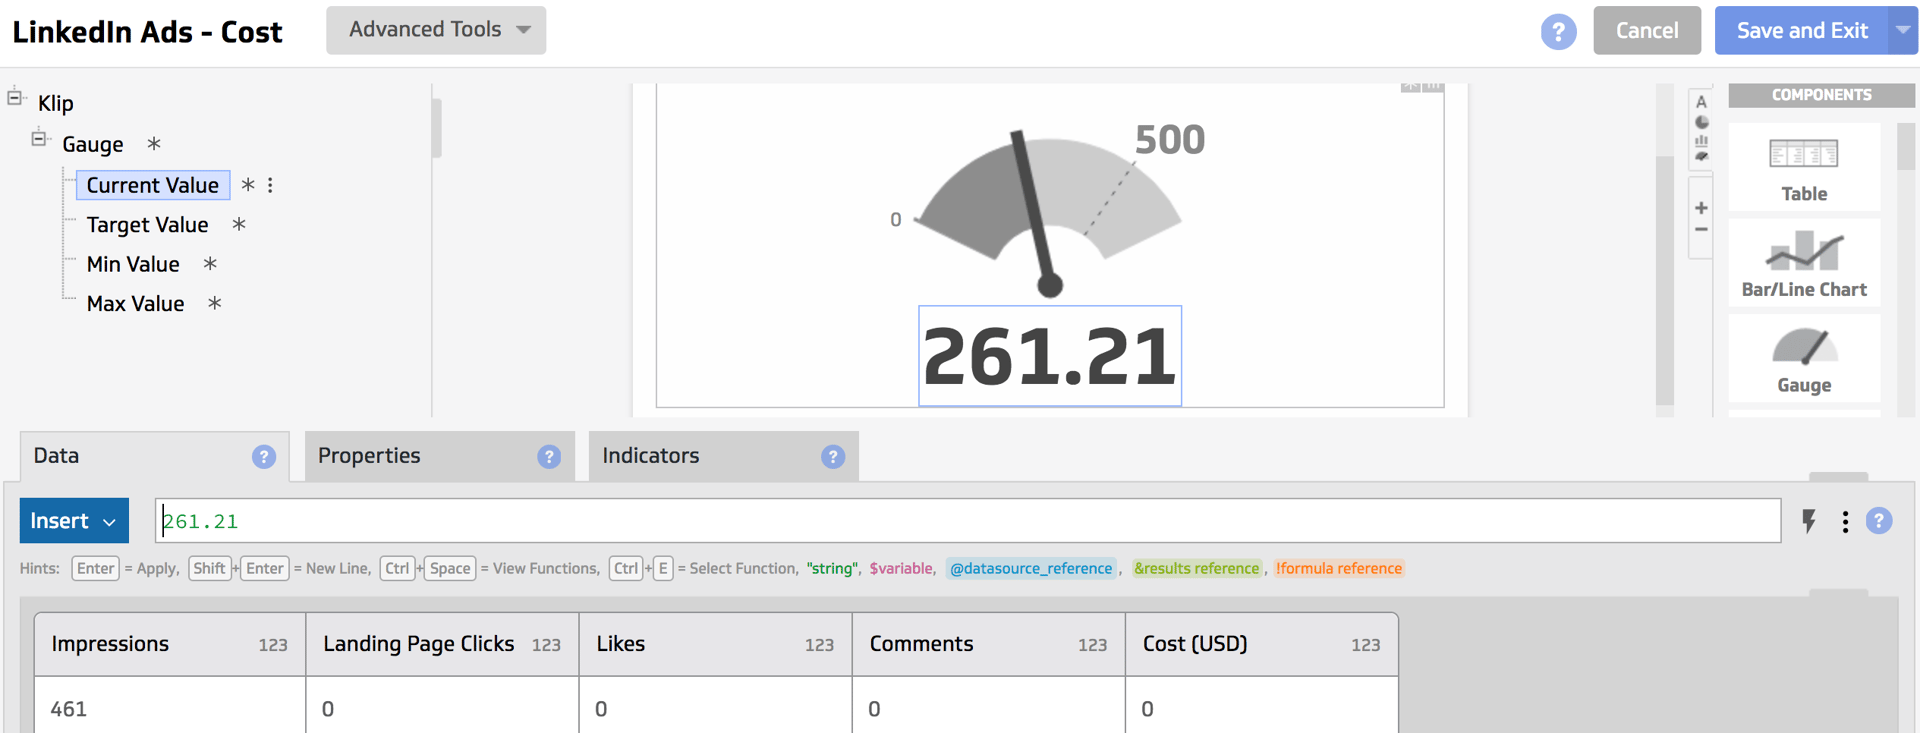
Building advanced dashboards
Are you comfortable using APIs and building queries? The sky's the limit for you. You can build your own queries to pull in the data you want from your LinkedIn Ads account.
Use those custom queries to build visualizations that help tell the story of your data.
If you need a quick API refresher, check out this handy video we created.
Proving your LinkedIn Ads performance with dashboards
So I think we can all agree, proving social advertising ROI is tough. But all is not lost! Using a platform like Klipfolio can help you create a visual story of how your efforts and ads are really paying off. And this can help to break down barriers you might have with other departments who don’t always know if marketing teams are pulling their weight.
Related Articles

Top 10 Marketing Dashboard Ideas for Tech Companies

17 KPIs Every Data-Driven Manager Needs to Lead Their Team
By Danielle Poleski — October 14th, 2025
The 9 Reddit KPIs You Should Be Tracking
By Mark Brownlee — September 17th, 2025

