

Summary - Marketing managers juggle multiple platforms and teams. These 10 essential metrics—from return on marketing investment to traffic by device—show you how to connect the dots and measure what truly matters: business impact.
As a marketing manager, you're balancing multiple campaigns, teams, and platforms while staying accountable for results. The challenge isn't collecting data—it's making sense of it. You likely track metrics across email platforms, social media dashboards, Google Analytics, and SEO tools. But when it's time to report performance or adjust strategy, connecting those dots feels like a second job.
The real issue: scattered metrics don't tell a complete story. Individual numbers—email open rates, organic traffic, cost per lead—are useful in isolation. But your team's true performance only becomes clear when you see how these metrics work together. That's when you can confidently answer the questions that matter: Are we hitting our revenue targets? Where should we invest next? What's actually working?
This guide walks you through the 10 metrics that matter most for marketing managers, organized by function. More importantly, it shows you how to connect them into a coherent picture of your team's performance.
The 10 marketing metrics every manager needs
- Return on Marketing Investment
- Incremental Sales
- Cost per Lead
- SEO Traffic
- Landing Page Performance
- Email List Performance
- Social Traffic and Conversion
- Social Visits and Leads
- Web Traffic Targets
- Traffic by Device
These metrics, individually and collectively, reveal how your marketing efforts drive business results. But tracking them across multiple platforms creates friction. The solution: consolidate your most critical metrics into a single dashboard—or a few focused dashboards by channel—so your team stays aligned and you can spot trends faster.
Three essential metrics for marketing managers
Return on Marketing Investment
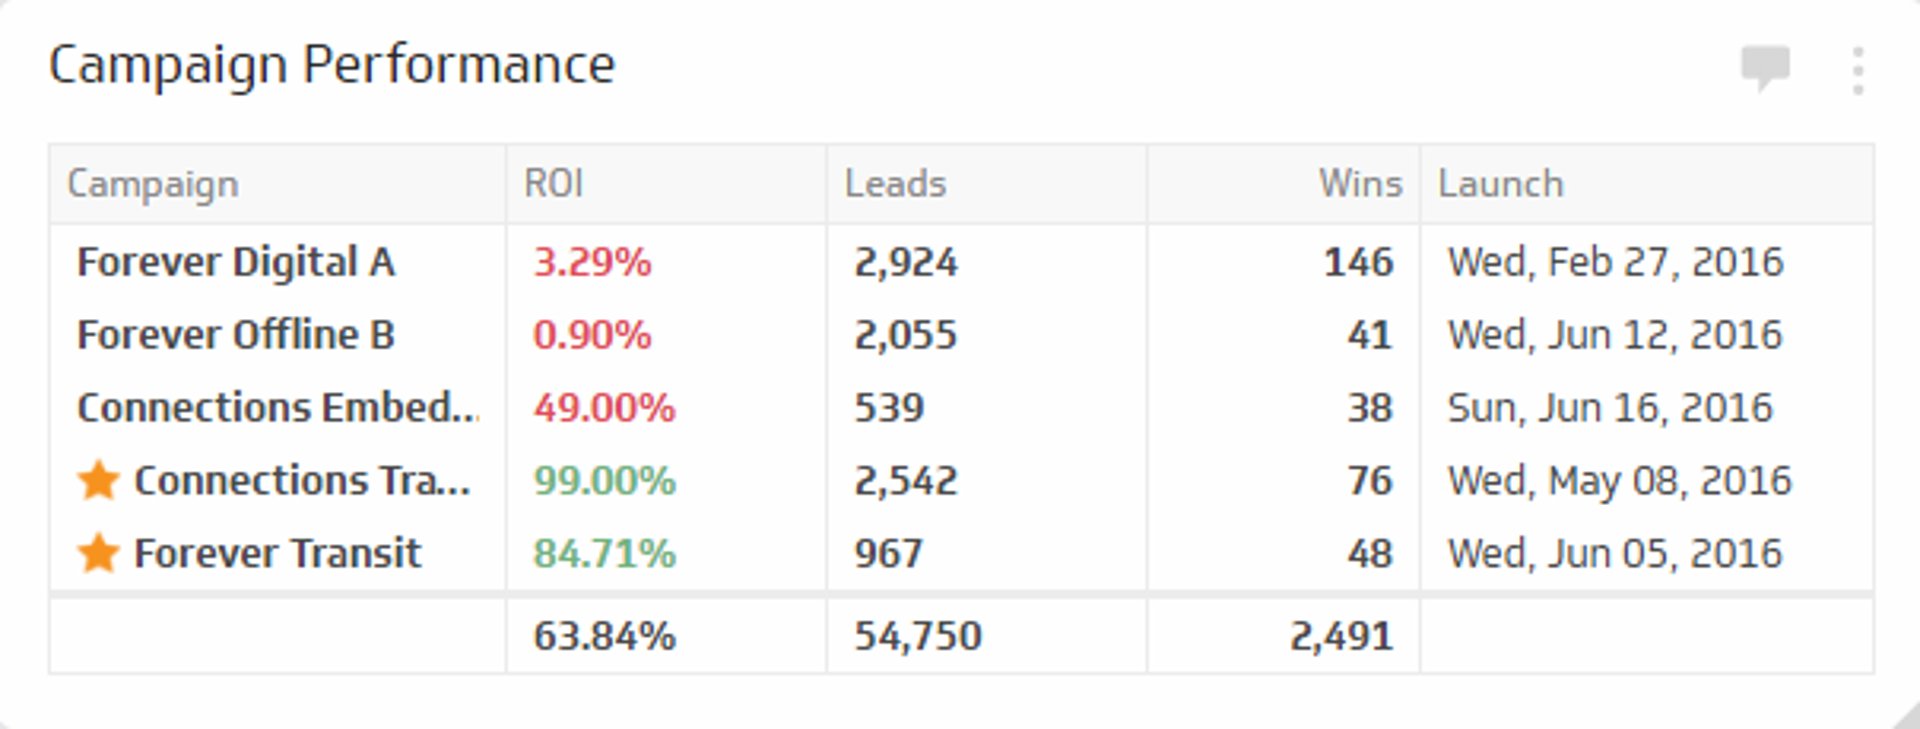
Return on Marketing Investment (ROMI) is the foundation of accountability. It shows how every dollar your department spends—including salaries, tools, and campaign costs—translates into company revenue.
Many teams focus narrowly on campaign-level ROI. That's important for optimization, but it misses the bigger picture. True ROMI compares all marketing spend against total results over a meaningful period (quarterly or annually). This reveals whether your department is delivering value at scale, not just whether individual campaigns perform.
Without ROMI, you can't justify budget requests or defend your team's headcount. With it, you have a clear business case.
Incremental Sales
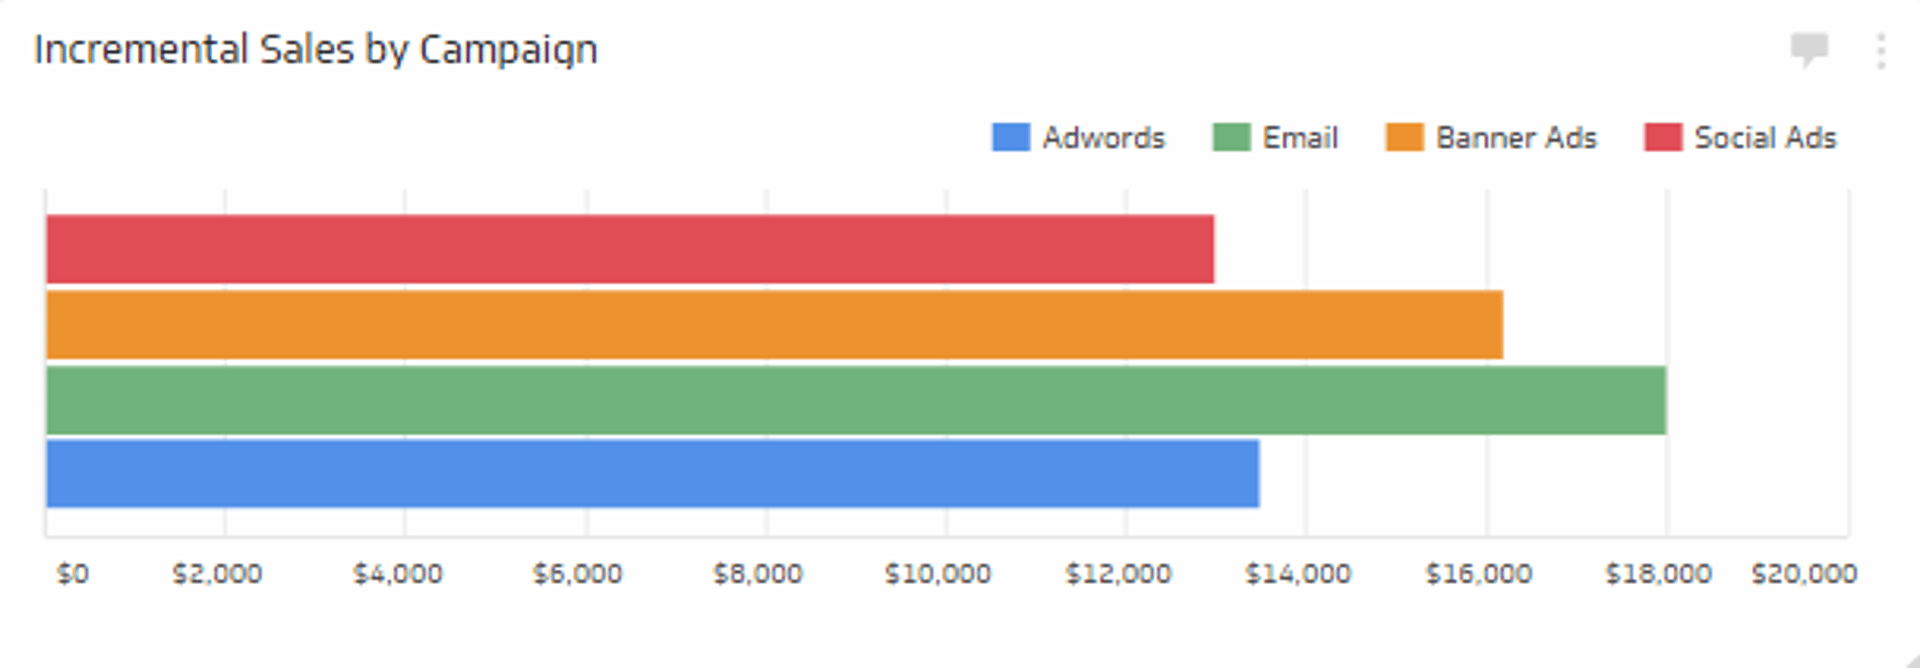
Incremental Sales answers the question every executive asks: Are your marketing efforts actually increasing revenue?
High engagement metrics—lots of clicks, shares, and impressions—can mask a hard truth: if those interactions don't convert to sales, your team isn't moving the needle. Incremental Sales isolates the revenue directly attributable to your marketing campaigns, cutting through vanity metrics.
This metric also exposes targeting problems early. If engagement is strong but sales are flat, your audience isn't the right fit, or your messaging isn't resonating. Either way, you need to know immediately so you can course-correct.
Cost per Lead
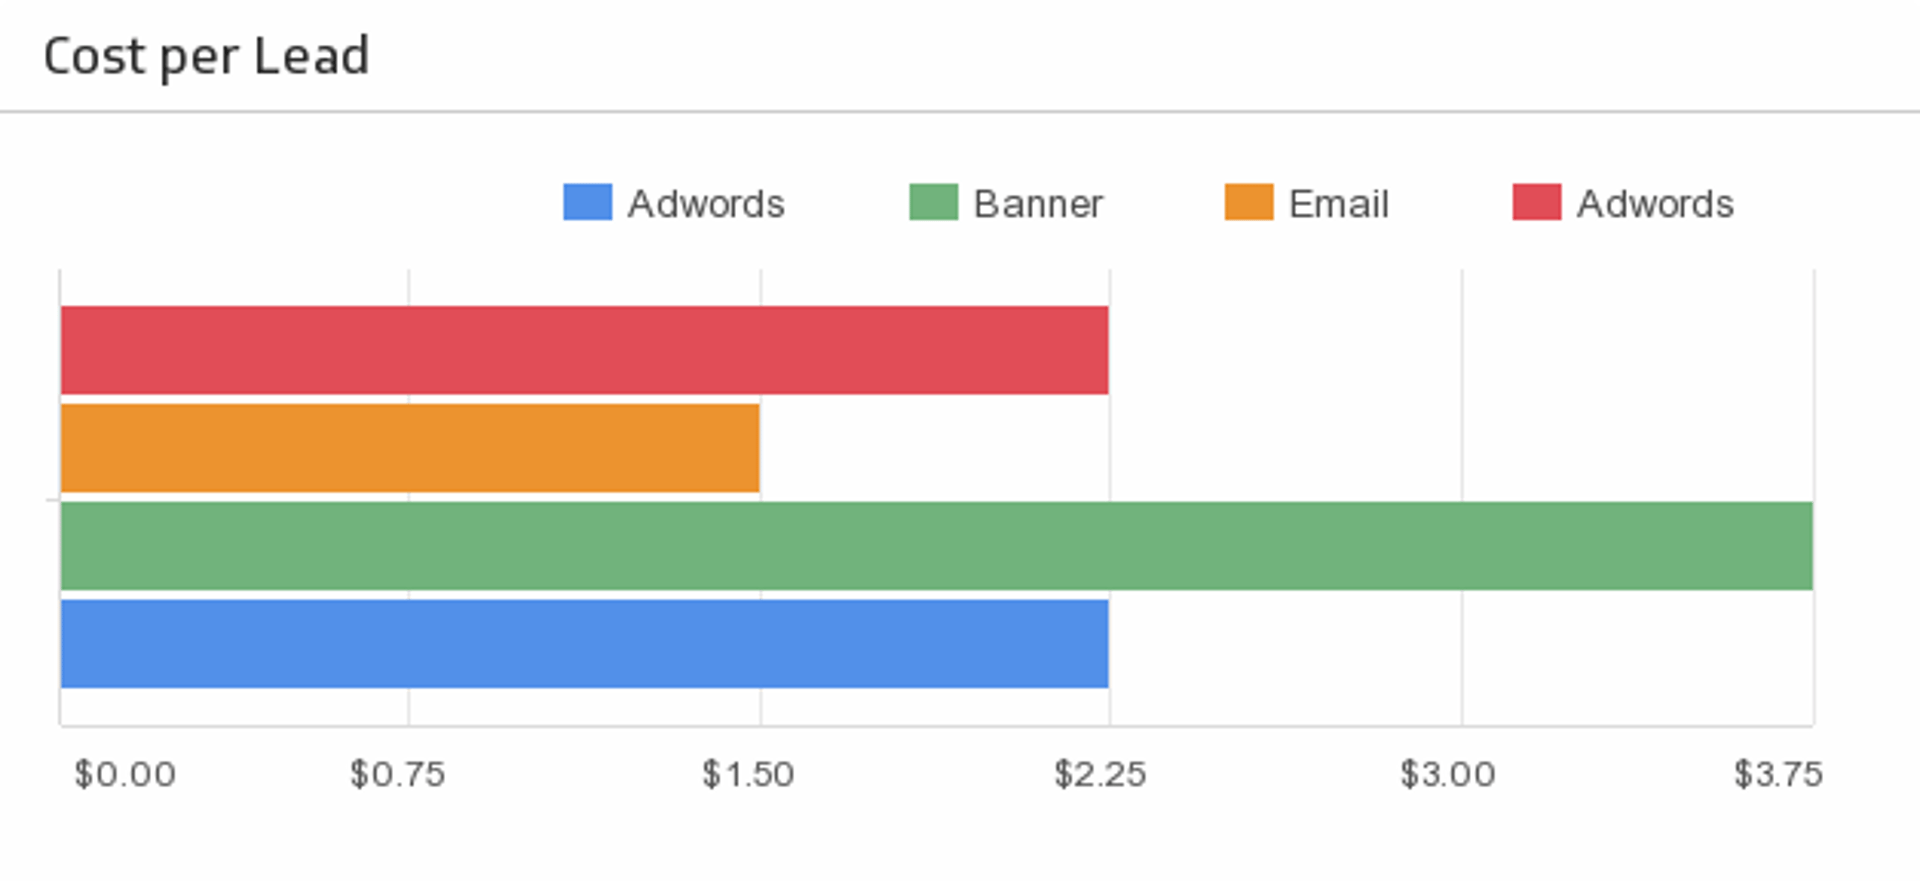
Cost per Lead (CPL) is the efficiency metric that ties your spending to output. It answers: How much does it cost to generate one qualified lead?
CPL matters because it forces a conversation about lead quality, not just quantity. A campaign that generates 1,000 cheap leads is worthless if none convert. CPL, monitored alongside conversion rate and sales cycle length, gives you a realistic picture of which channels and campaigns deserve more budget.
Track CPL by channel and campaign type. You'll quickly spot which tactics deliver affordable, high-quality leads and which are money-drains.
Metrics by channel
SEO metrics
SEO Traffic
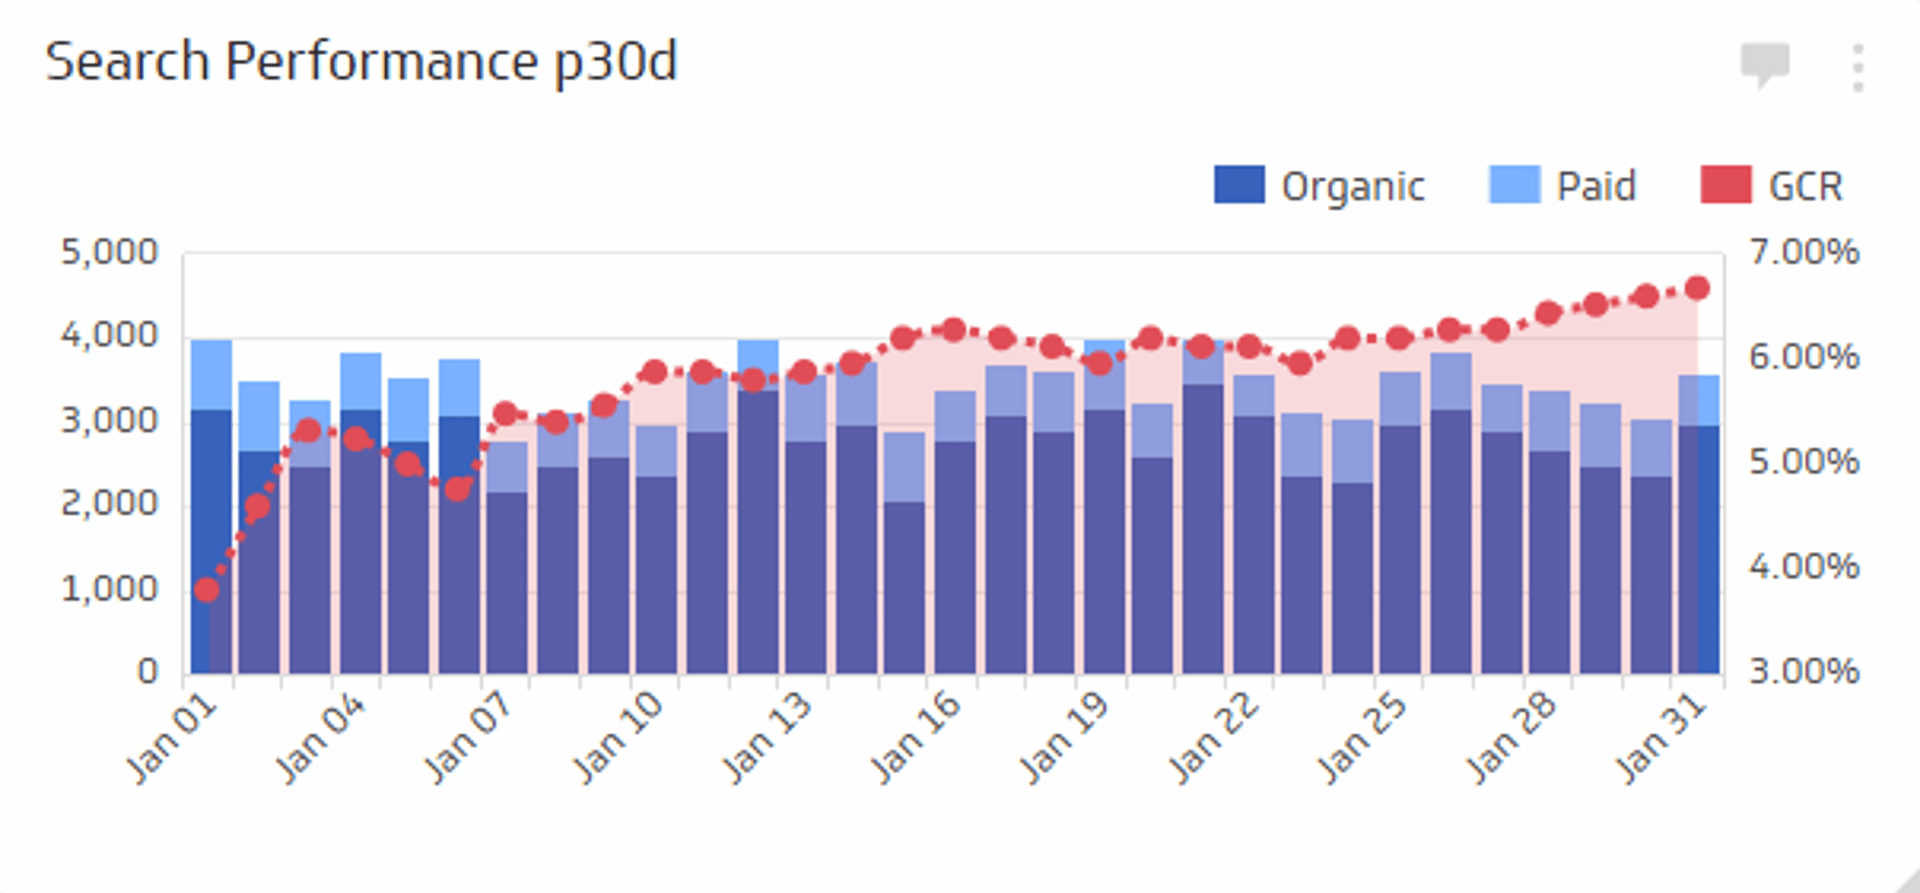
Organic search traffic is often your most valuable channel because it's earned, not paid. Unlike paid ads, organic visitors find you when they're actively searching for solutions you provide.
SEO Traffic measures how much of your total website traffic comes from search engines, broken down by keywords and landing pages. It's essential to track this in real-time because SEO is always shifting—algorithm updates, competitor moves, and seasonal trends all affect rankings. As a manager, staying ahead of these changes lets you allocate budget smartly between organic and paid search.
Landing Page Performance
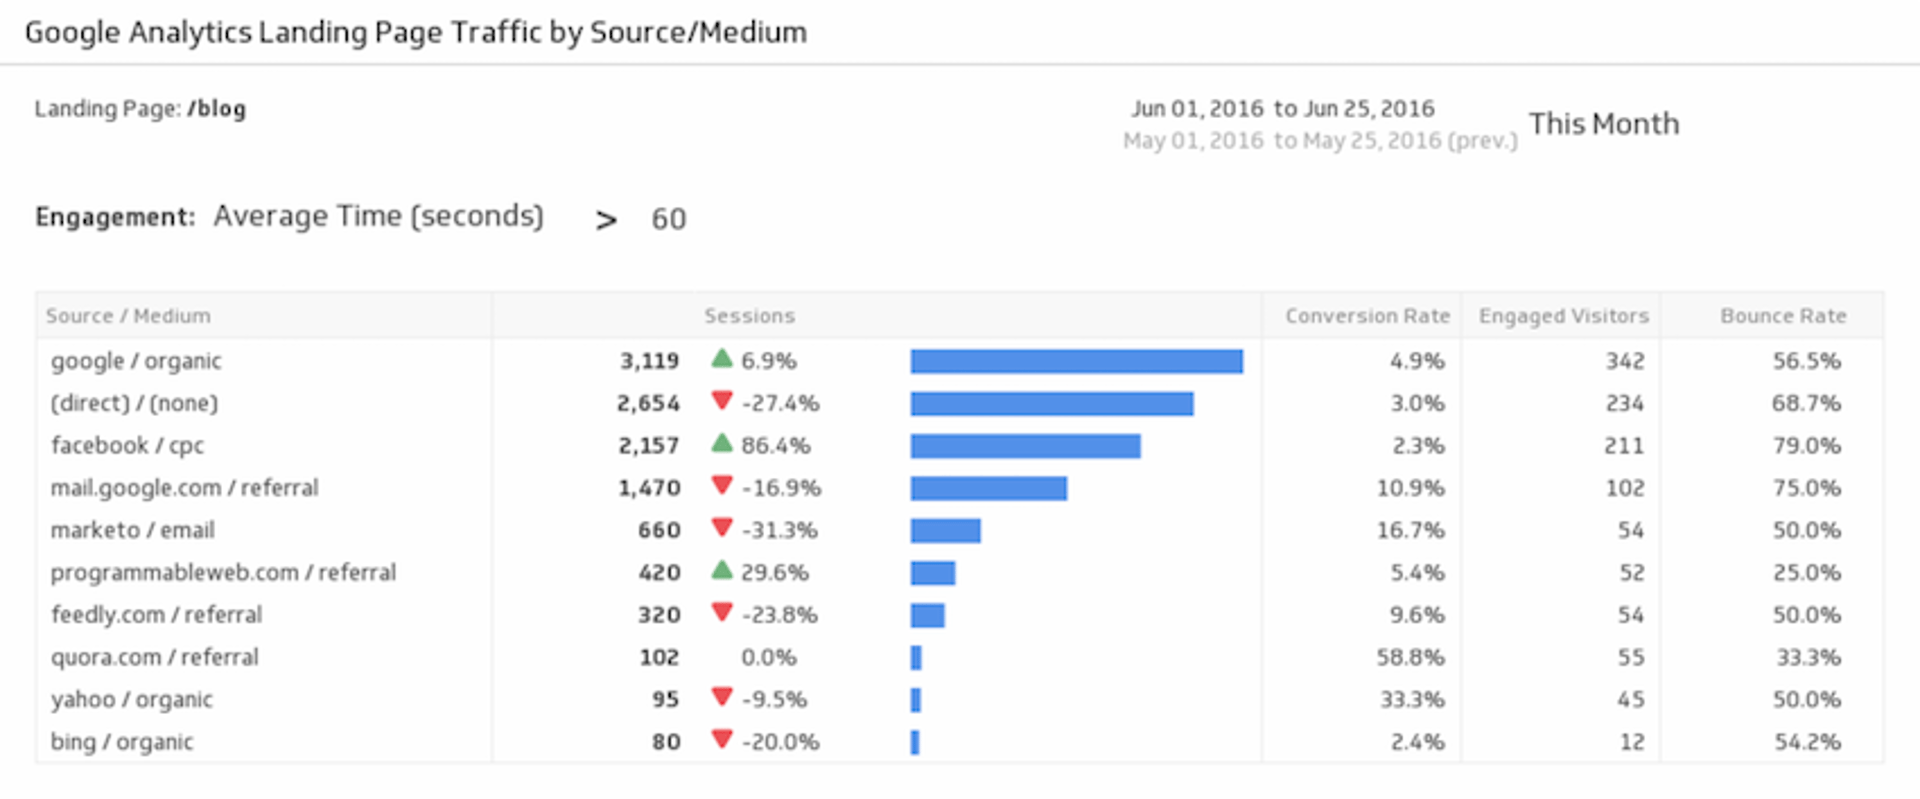
Landing pages are where traffic converts—or doesn't. This metric tracks sessions, bounce rate, conversion rate, and engaged visitors per page, showing you which pages pull their weight and which are underperforming.
Landing Page Performance isn't about quick wins. It's a long-term optimization tool. Small improvements—clearer headlines, better calls-to-action, faster load times—compound over months. By monitoring this metric consistently, you'll identify patterns: which audience segments convert best, which messaging resonates, and where friction exists in your funnel.
Email marketing metrics
Email List Performance
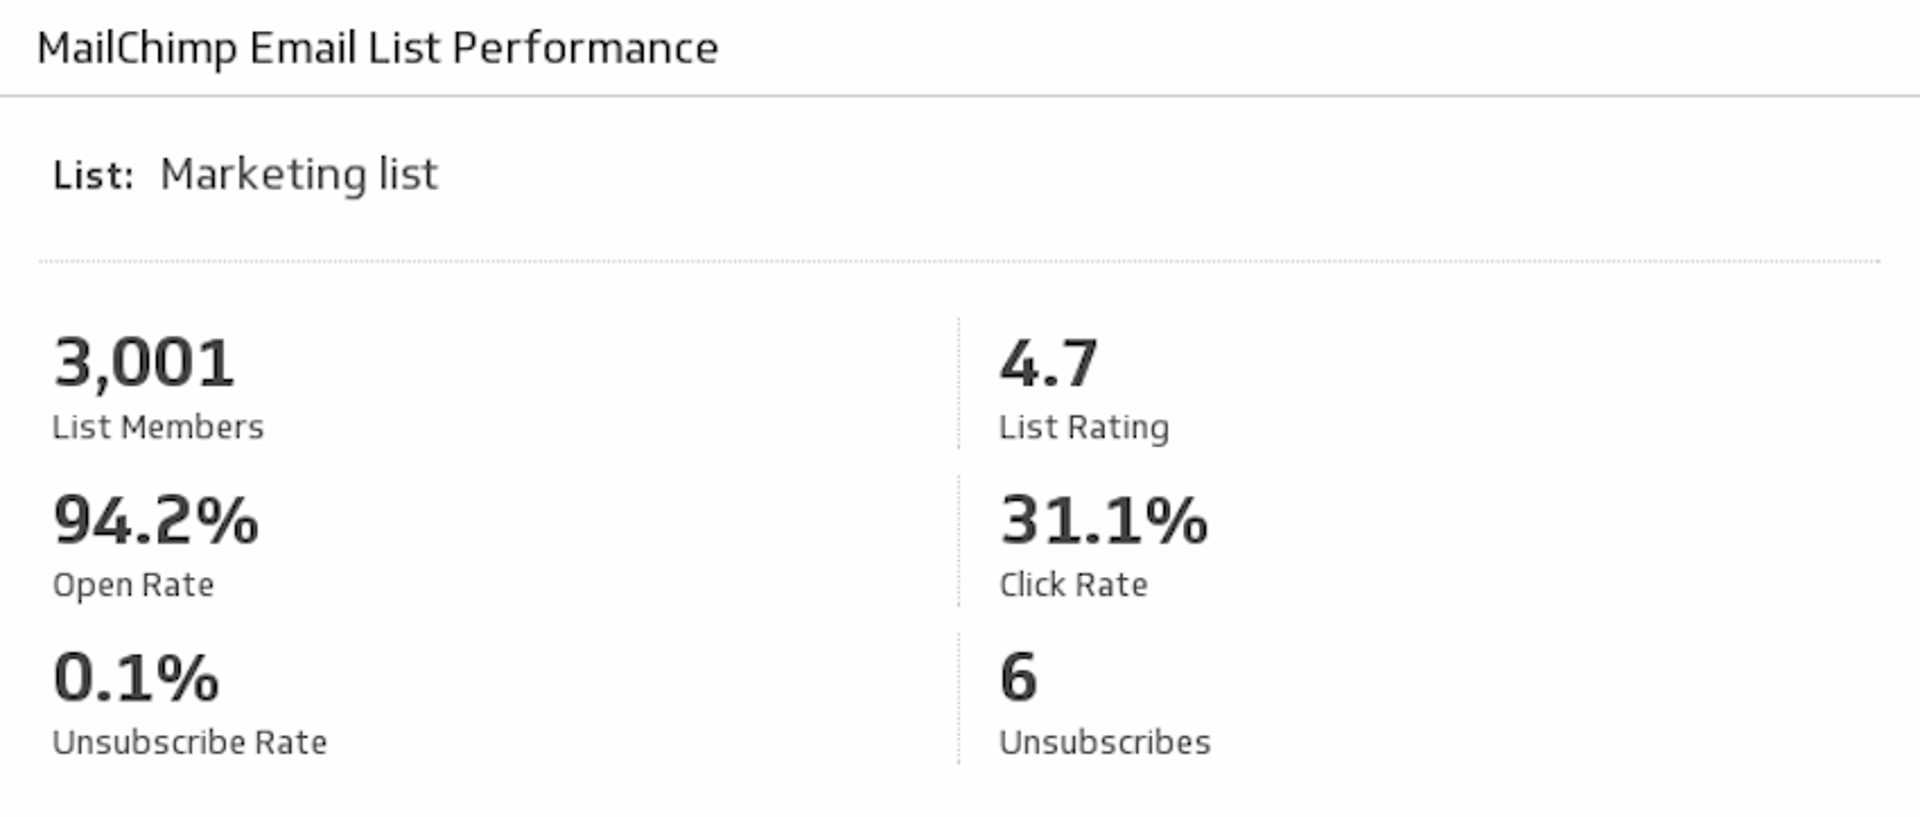
Email remains one of the highest-ROI channels for most teams. Email List Performance tracks the health and effectiveness of each list: sends, opens, open rate, clicks, and click rate.
This metric is your starting point for conversations with your email team. If open rates are dropping, investigate subject lines and send frequency. If click rates are low, test new content or calls-to-action. By comparing performance across lists, you can identify which segments are most engaged and which need re-engagement or cleanup.
Social media marketing metrics
Social Traffic and Conversion
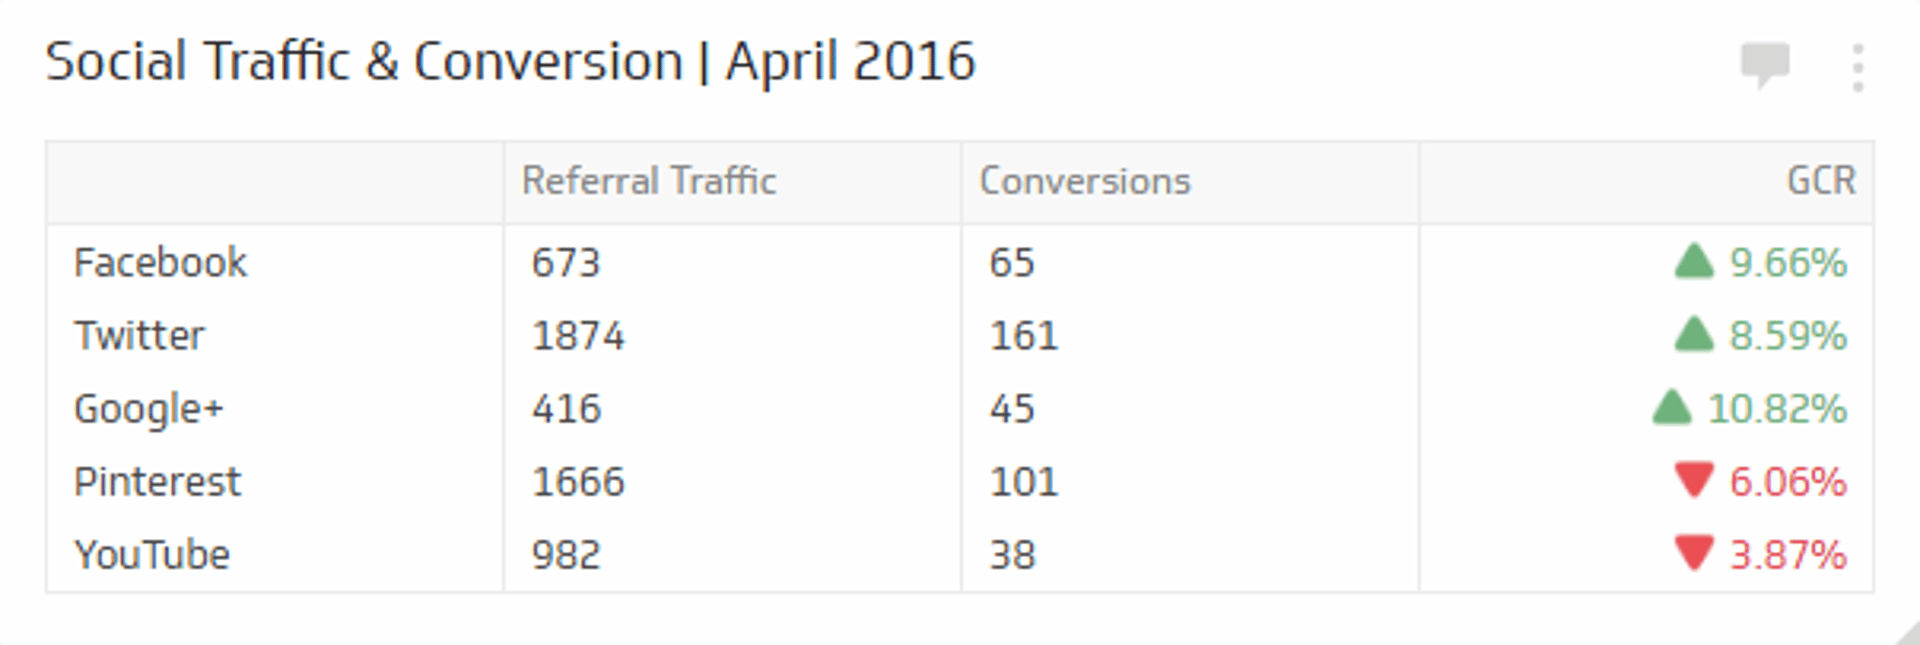
Social media can feel like a vanity game—lots of likes and shares, but unclear business impact. Social Traffic and Conversion ties your social presence directly to your conversion goals, showing which platforms drive the most valuable visitors.
You may discover that Instagram generates impressive engagement but LinkedIn drives actual leads. Or vice versa. This metric forces you to allocate budget based on business results, not social metrics. Use it to inform platform strategy, content decisions, and budget allocation.
Social Visits and Leads
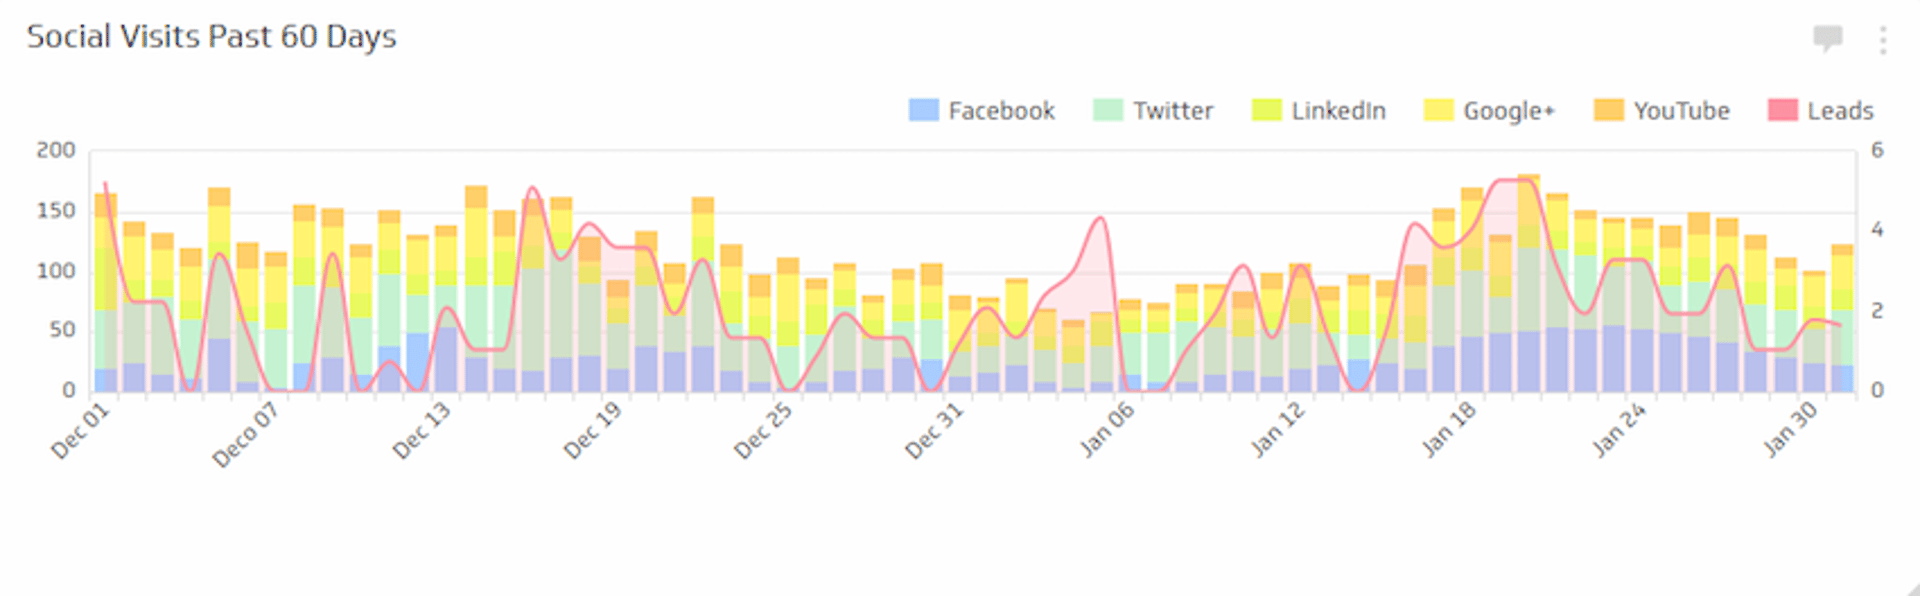
Social Visits and Leads directly measures the ROI of your social media campaigns. It connects traffic from social platforms to actual lead generation, removing the guesswork about social's business value.
This metric proves that social media isn't just for brand awareness—it's a lead generation engine when executed strategically. Track it by platform and campaign to identify which social tactics deserve expansion.
Web analytics metrics
Web Traffic Targets
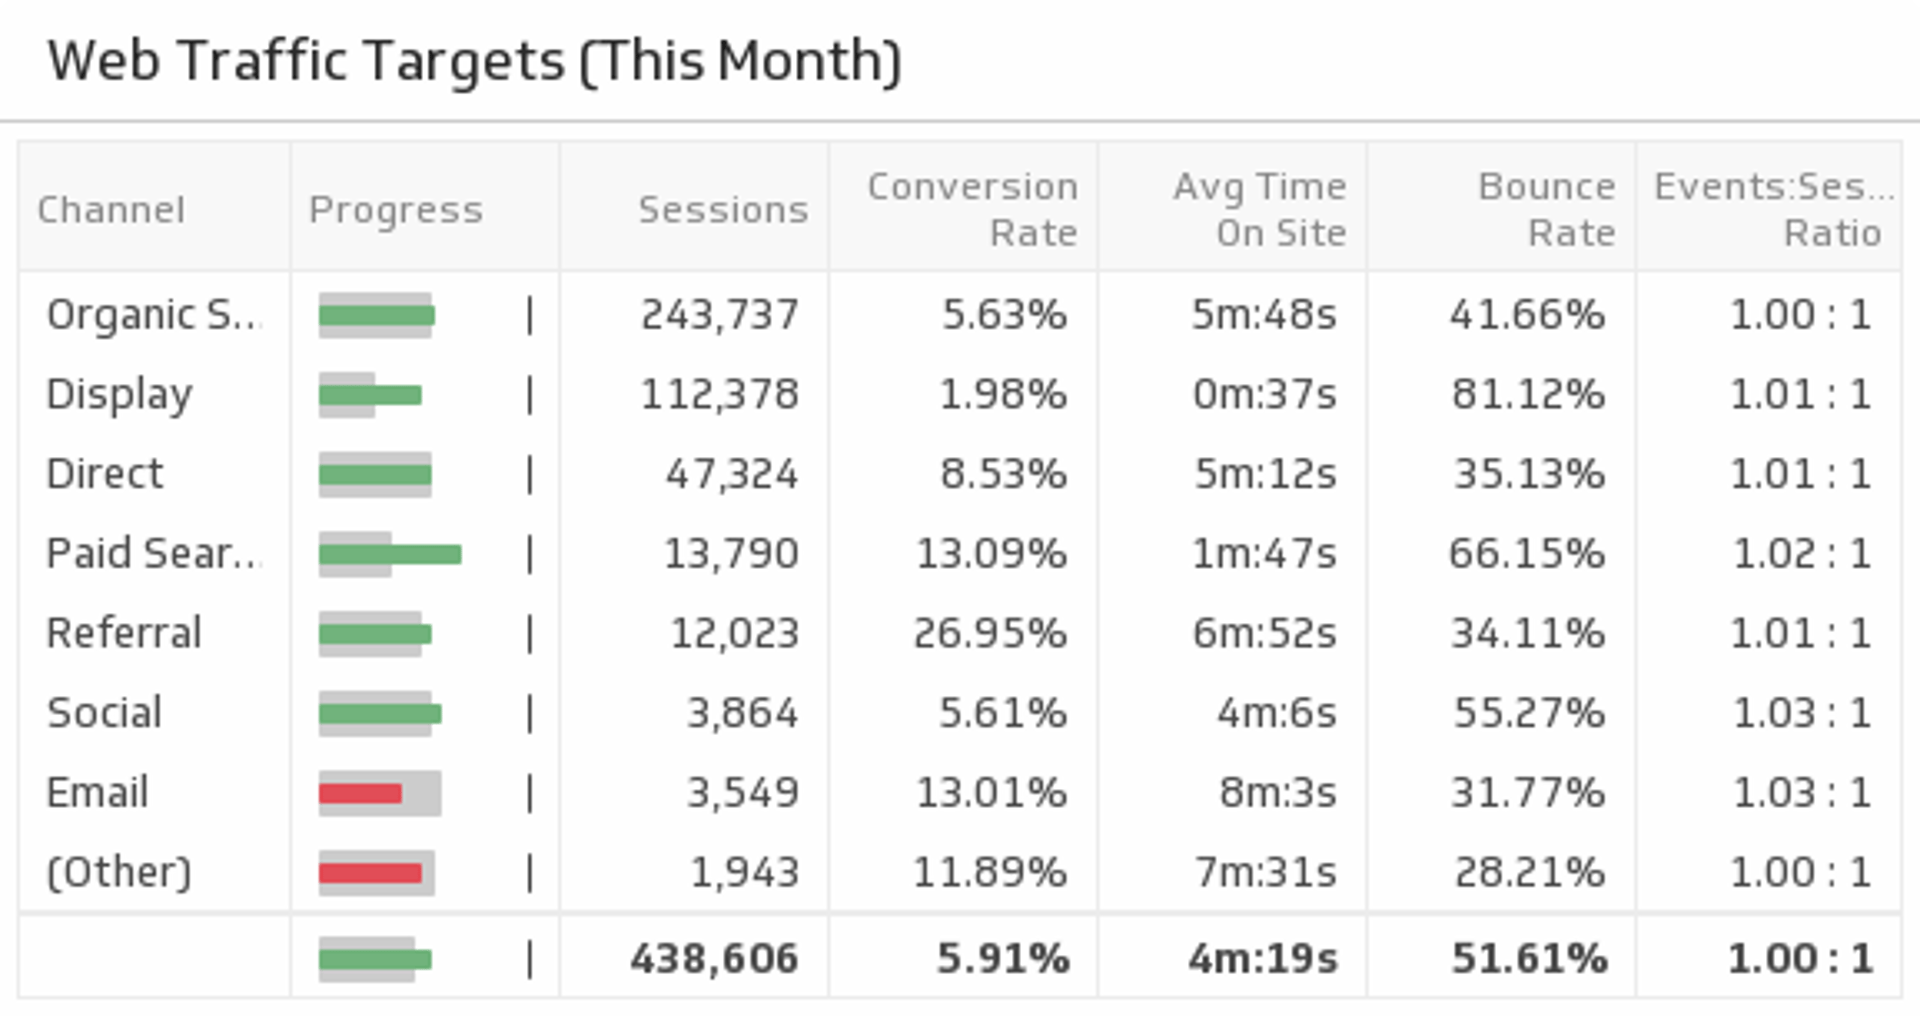
Web Traffic Targets is your big-picture metric. It aggregates traffic from all sources—organic, paid, email, social, direct—and measures it against your monthly or quarterly goals.
This is the metric to pull up in team meetings when you need to show overall progress. It's simple, clear, and directly tied to business objectives. When traffic is on track, your team knows they're winning. When it dips, everyone understands the urgency to troubleshoot.
Traffic by Device
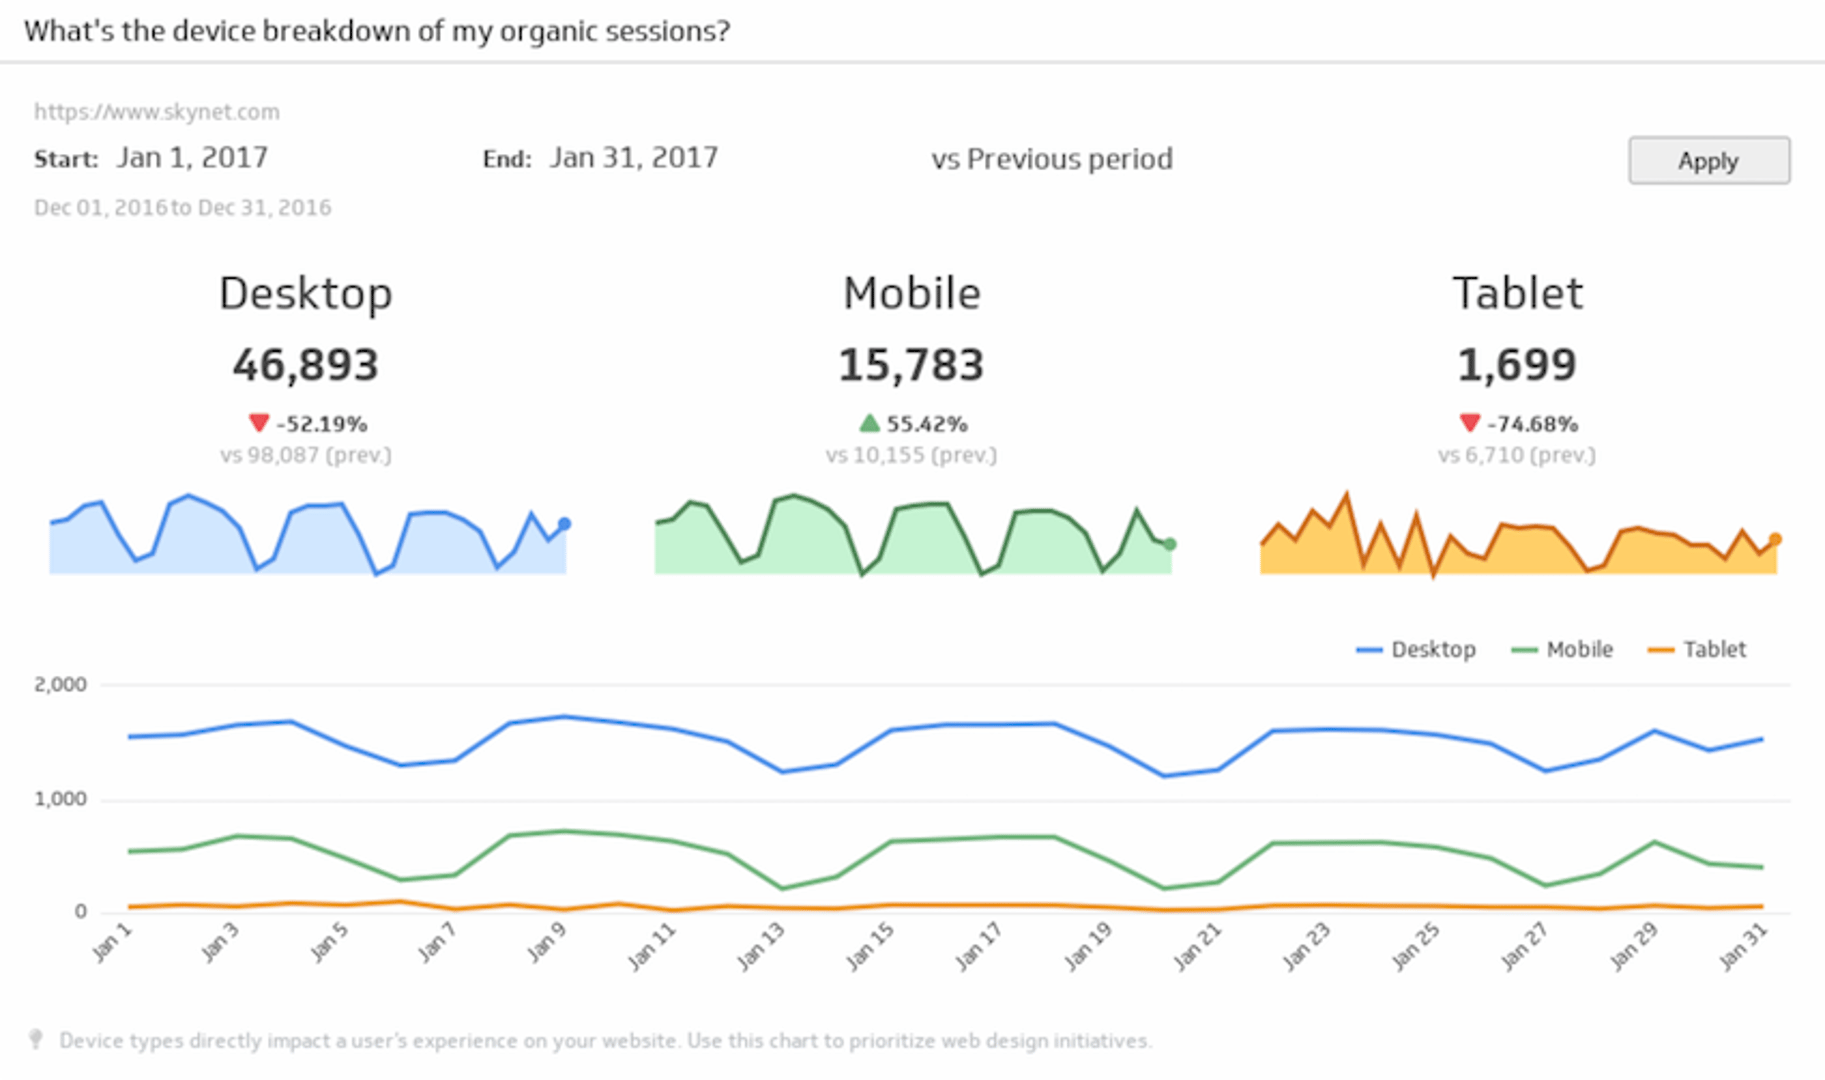
Customer journeys are increasingly mobile-first. Traffic by Device shows what percentage of your visitors arrive on desktop, mobile, or tablet—and how each segment converts.
If your target audience is mobile-heavy but your website isn't optimized for mobile, you're leaving conversions on the table. This metric informs decisions about web design, page speed optimization, and even ad targeting. It also guides conversations with product and design teams about where to focus resources.
The power of connected metrics
Individual metrics tell incomplete stories. Return on Marketing Investment without Incremental Sales doesn't tell you if revenue is actually growing. SEO Traffic without Landing Page Performance doesn't show if organic visitors convert. Email List Performance without Cost per Lead doesn't reveal if email is efficient.
The breakthrough comes when you connect these metrics into a coherent dashboard. Suddenly, you see the full picture: which channels drive the most valuable traffic, where your team excels, and where you need to invest or improve.
This is also where team alignment happens. When everyone sees the same metrics—whether they're an SEO specialist, social media manager, or email marketer—they understand how their work contributes to shared goals. It's no longer about individual channel success; it's about collective business impact.
Getting started with marketing dashboards
The most effective way to manage these metrics is to consolidate them into focused dashboards. Rather than one monolithic dashboard, consider creating separate views for:
- SEO & Organic Performance (SEO Traffic, Landing Page Performance, Web Traffic Targets)
- Paid & Conversion (Cost per Lead, Social Traffic and Conversion, Web Traffic Targets)
- Email Marketing (Email List Performance, Cost per Lead, Incremental Sales)
- Executive Overview (Return on Marketing Investment, Incremental Sales, Web Traffic Targets)
Each dashboard tells a specific story while feeding into the larger narrative of marketing performance. Your SEO team focuses on organic metrics; your paid team monitors conversion efficiency; executives see business impact.
Tools like Klips make this easier by pulling data from 100+ sources—Google Analytics, HubSpot, Facebook Ads, email platforms, and more—into a single, real-time view. You can refresh data as often as needed (from one minute to 24 hours) and distribute dashboards to stakeholders via email, embeds, or public links.
Final thoughts: Metrics drive alignment
As a marketing manager, your job is to orchestrate multiple teams, channels, and campaigns toward a shared goal. Scattered metrics across disconnected platforms make that nearly impossible. You spend your time hunting for data instead of leading strategy.
Connected metrics change that equation. When your team can see how their work impacts overall performance—and how their channel fits into the bigger picture—accountability shifts from individual effort to collective results. SEO specialists understand how their traffic feeds conversion metrics. Email marketers see the direct line from their campaigns to revenue. Everyone knows what success looks like.
The energy you spend juggling multiple platforms and platforms drops dramatically when you have a single source of truth. Your team stays focused, decisions become faster, and you can confidently answer the questions that matter: Are we on track? Where should we invest? What's working?
Start with the 10 metrics outlined above. Choose the ones most relevant to your business model and channels. Then consolidate them into dashboards your team can access daily. The clarity you gain will transform how you lead.
Related Articles

5 tips to understand (and organize) your restaurant data
By Saleem Khatri — June 9th, 2026
6 Facebook ads reports every agency needs to attract and retain high-ticket clients
By Tanya Brody — April 10th, 2026
6 dashboards I use daily to run my SaaS company
By Allan Wille, Co-Founder — April 10th, 2026
