

Summary - Ascentis employees have become more ‘metrics-driven’ since the company started using Klipfolio. This includes their executive team who are using Klipfolio dashboards to present key company metrics during board meeting presentations.
Ascentis offers easy-to-use human capital management, HRIS, online payroll, talent management, recruiting and timekeeping solutions. Their aim is to support greater business efficiency and accuracy for their customers.
Meet Jose...
Jose Sebastian Battig is the EVP of SaaS Ops, Corporate Technology, Software and Systems Architecture, and Security at Ascentis. He typically starts his mornings in the office off by checking his calendar and sifting through emails. Once the emails are done, he checks their corporate chat tool to see if there’s anything critical happening with the teams he manages. His days are filled with meetings, but he does have time between them to quickly check the company's Kanban metrics dashboard.
Jose typically uses the data from his dashboards to fuel conversation in 1-on-1 meetings with his managers and in other strategic planning sessions.
Making sense of raw Excel data was causing headaches
Before using Klipfolio for their reporting, past managers at Ascentis would have to export raw data into Excel spreadsheet dashboards from multiple software sources. A lot of effort was being put into making sense of the various data sets.
“The Excel reporting approach was manual, error-prone, and inefficient. Because of this, our metrics and analysis would be insufficient and not worth the effort. It was a lot of work just to get the data. Usually, we would stop short of going deeper into the facts because these efforts were eating into our employee's daily task time.”
Jose and his team knew there had to be a better way to make use of this data by bringing it all together in one place and looking at it in real-time.
“I love Klipfolio’s Integration with Google Drive! We use Google Drive as our primary data storage and collection tool and have created automated Google Scripts that feed the data into Klipfolio exactly how we need it.”
Finding the right BI solution
As a company, Ascentis is very cost/benefit conscious. They looked at a few other BI solutions in the marketplace, and Klipfolio stood out the most.
“We had one executive on our team who used Klipfolio in the past, which helped speed along the onboarding process. After seeing how amazing the initial metrics looked and how easy they were able to build them, I decided to take a shot at creating a couple of dashboards that showcase my team’s operational metrics.”
Dashboards keep remote and in-office workers united
Ascentis has a mix of remote and in-office employees. For their remote employees they have published live URL links to their dashboards so they can be accessed from any web browser.
“Klipfolio is relatively easy to use and is an amazing bang for your buck. I love that I can publish and share our dashboards with a simple URL.”
For their employees working in-office, they have strategically set up a number of TV wallboards displaying what they call "Information Radiator" metrics that are relevant to each department.
“Our employees have become more ‘metrics-driven’ since the company started using Klipfolio. This includes our executive team who are using Klipfolio dashboards to present key company metrics during board meeting presentations.”
Metrics that impact revenue
The various departments at Ascentis use Klipfolio to track many different corporate metrics. Here are their most impactful ones:
SaaS environment uptime (per product pillar)
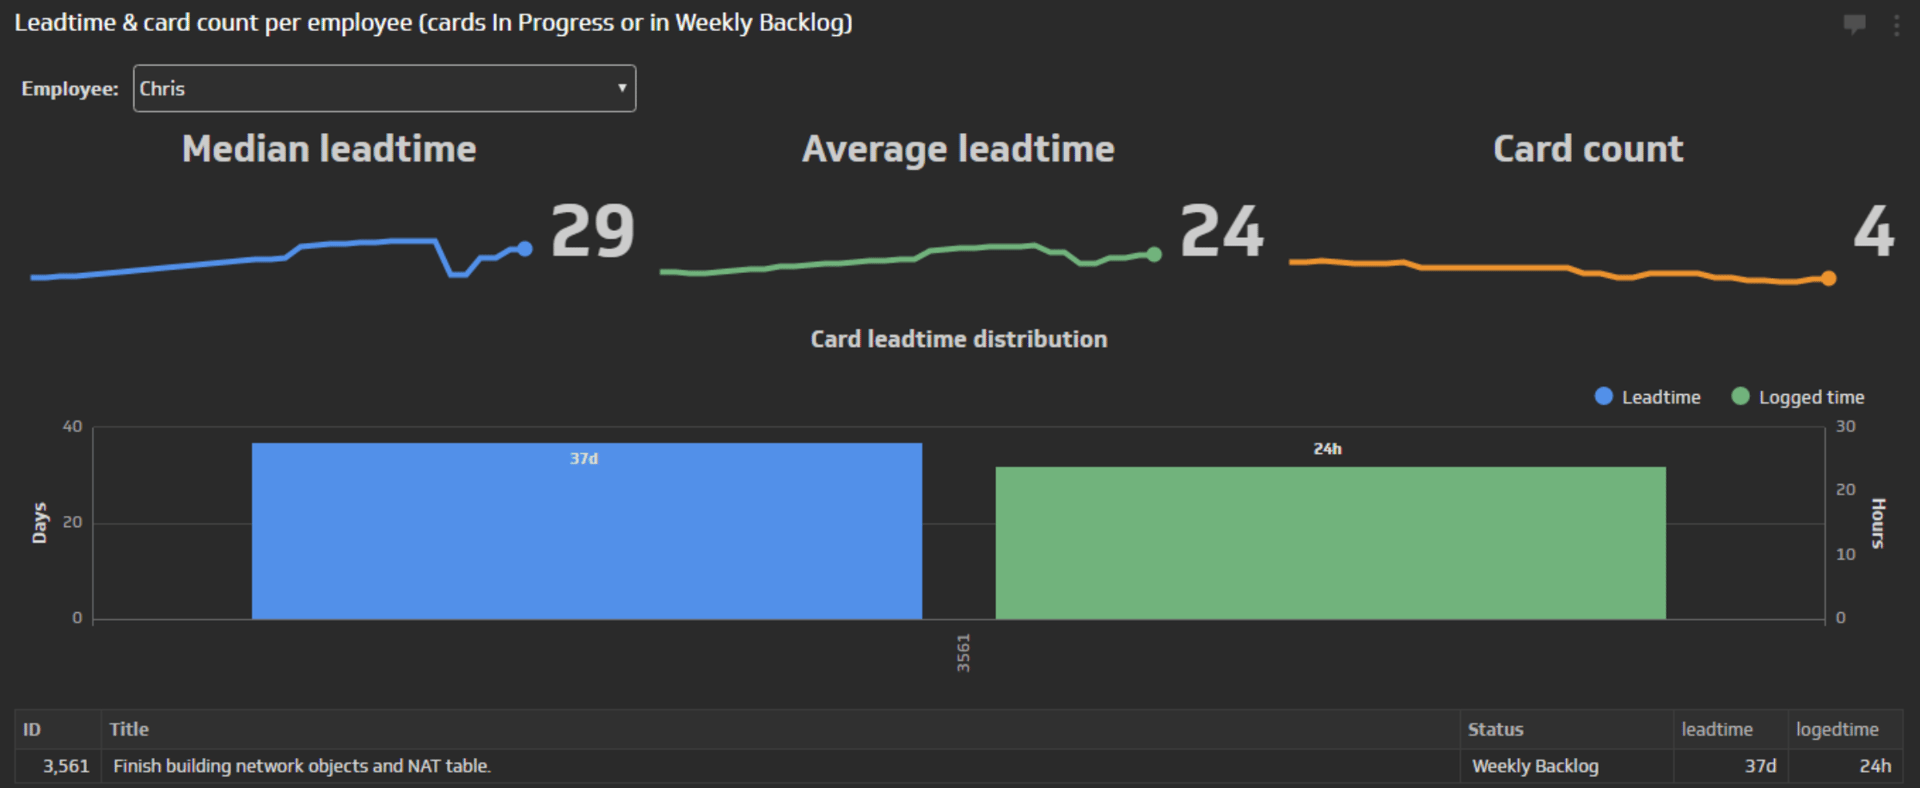
Project progress - burndown chart and lead time
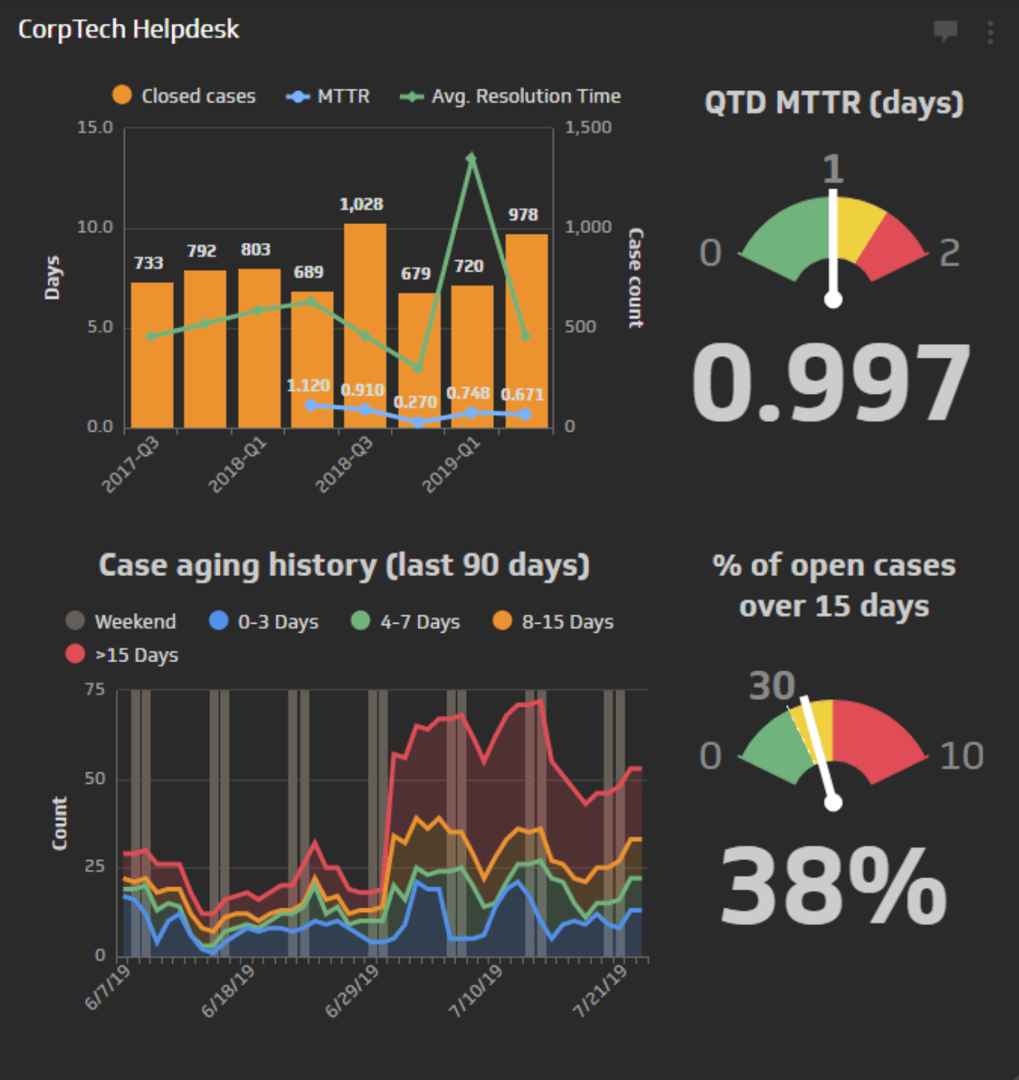
Helpdesk productivity - MTTR, average resolution time of tickets, case aging, and so on...
“Our favorite Klipfolio visualization is our ‘Systems Uptime’ dashboard. Not only does it look amazing on a TV but it is also very informative. Using only a few gauges and a news widget, we can look at historical uptime information, current month uptime, and all recent incidents.”
Using real-time data to mitigate team performance issues
Ascentis has built an entire dashboard geared towards making employees aware of team performance issues in real-time.
“Before implementing Klipfolio, our employees had no way of tracking how much they spent executing tasks that added little or no value. These were the kind of tasks that were done because 'it's how we've always done it'. We identified the biggest offender of these processes, and built a dashboard to show the number of times someone performed it. The data is refreshed multiple times a day providing the team with full awareness. We've been able to reduce these tasks by 50% after only a couple of months of having access to this data Klipfolio. The team now is focused on replacing the tasks with other approaches that provide higher added value for the organization.”
Jose and his team are now holding regular stakeholder meetings to discuss mitigation strategies. The team is able to take action when they see the numbers starting to go off course.
Jose’s Klipfolio ‘Pro-tip’ for new dashboard builders:
“Use the slice() function if you decide you don’t want to model your data sources. Also, try using the View Klip Source functionality when you want to repeat a certain condition in multiple places, particularly when adding indicators in table columns.”
Related Articles

6 dashboards I use daily to run my SaaS company
By Allan Wille, Co-Founder — April 10th, 2026
The Hidden Value of SaaS Sign Up Rate Benchmarks
By Priyaanka Arora — January 10th, 2026
Klipfolio Partner How-To #1: Duplicating dashboards across client accounts
By Stef Reid — November 27th, 2025