
Summary - The latest experience in Klipfolio is out of Beta! A PowerMetric is a new kind of building block that offers the fastest and simplest way to go from data to insights.
You’ve got data, now you need metrics
Here at Klipfolio, our vision is to help everyday people succeed with data. With our newest Klipfolio experience, we are doing just that, but taking it to the next level.
PowerMetrics is here
What are PowerMetrics?
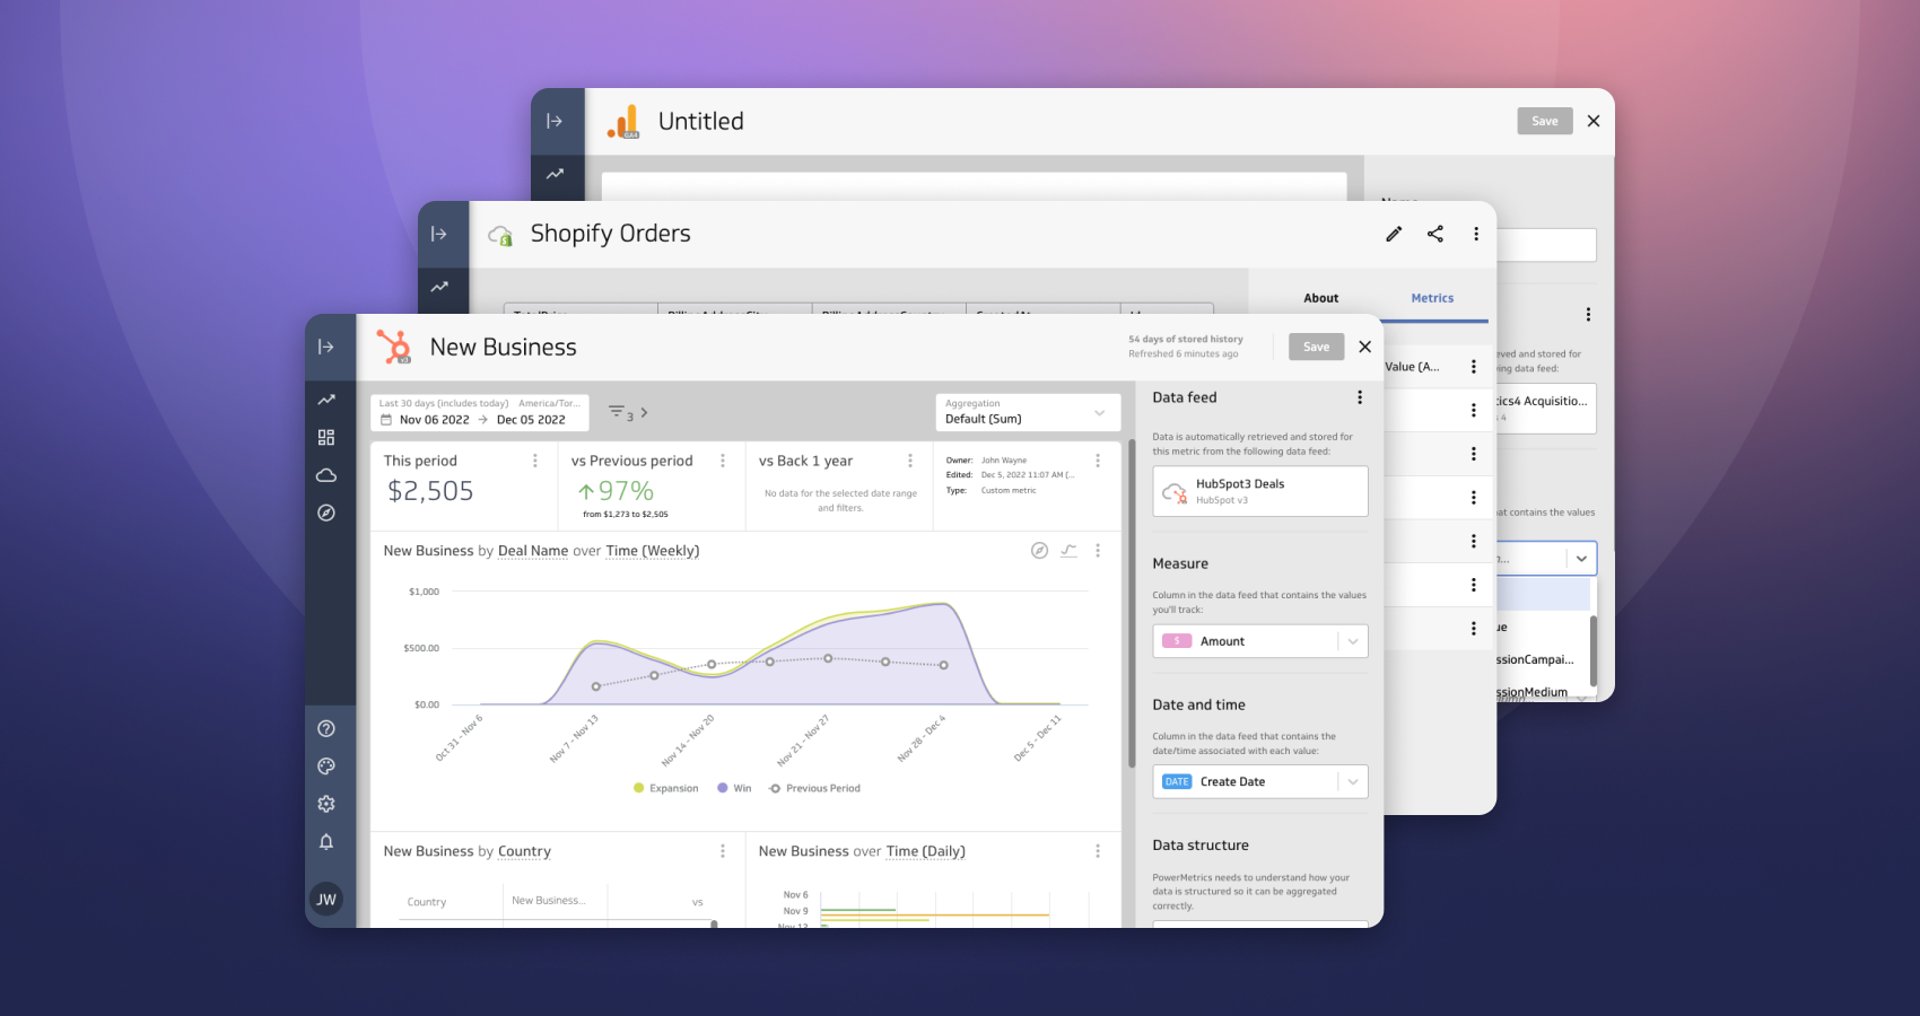
Metrics are a new kind of building block within Klipfolio that offers the fastest and simplest way to go from data to insights to help you work faster, visualize your data instantly, and create dashboard reports in a simple, intuitive way. When you create metrics, you build them once and get to use them over and over again to tell your data story.
What makes PowerMetrics awesome?
They help you dive deeper into your data...
- Change visualizations with a single click.
- Apply filters and choose date-ranges instantly.
- Capture data history for all your important business metrics.
- Compare results with the prior period.
- Add linear or moving average trend lines.
- Look at your data visually in new ways using segments.
- Help build dashboards quickly and deliver the most impactful metrics to your team, manager, and executive suite.
Getting friendly with key terms
Metric: A Metric stores your data and gives you more than just the numerical values you want to monitor - it comes with built-in filters, stores your data history, and provides unlimited ways to visualize your data. PowerMetrics supercharge your metrics so you can see trends at a glance, slice and dice your data, and make confident business decisions by understanding your performance.
Metric HQ: The easiest way to connect data to a Metric in Klipfolio. All the heavy lifting is done for you. Available both in the application and via the web, Metric HQ allows you to choose from a list of services or specific pre-built Metrics to track. In a couple of clicks, you have visibility into your data.
Dashboard: An interactive workspace within Klipfolio where you can pull together different views of your Metrics in a snap.
People ? PowerMetrics
“PowerMetrics are much easier than building Klips and it’s a great way to track KPIs. I really like that you have the ability to filter and segment the data with a couple clicks.”
- Vinicius Simioni, Agente Imóvel
“I like the simplicity and elegance of PowerMetrics. This is a great feature for non-technical people who wouldn’t have a dashboard otherwise.”
- Brice Sloan, Sloan SG
Getting started with PowerMetrics
Here are some quick steps to follow as you start your data journey:
1. Decide which metrics you should track.
Choosing which metrics to track is not always a "one-size-fits-all" decision. Consider your team and company-wide goals and projects. Need some help deciding? Here’s a long list of KPIs and metrics to get you thinking.
2. Add a Metric in Klipfolio.
Choose from our list of pre-built Metrics or build your own custom one. Metrics are built based on a modelled data source. If you have an existing data source you want to use, you must model it before building a Metric.
3. Explore your Metric - customize and experiment with how it looks.
This is the fun part. You get to experiment and play with your Metric. Apply different time ranges, choose a different visualization type, mix and match by segmenting and filtering - and see the impact of each of your selections as you explore.
4. Share your discoveries.
Keep everyone aware of trends in your data by sharing a Metric (or a group of Metrics on a dashboard), or, give an in-the-moment, contextual view of your discoveries by sharing a link to a Metric or dashboard.
5. Monitor your Metric every day.
Display and interact with your Metrics on a dashboard. Checking in on your Metrics every day ensures you and your team are always aware and on the same page.
Hey Data Nerds: Combine your Metrics
Use two or more Metrics in a formula, such as a ratio or a percentage. Defining a calculated Metric will result in accurate representation of the result in different time ranges.
For example:
Cost Per Click = Ad Spend / Clicks
Bounce Rate = Bounces / Sessions
Email Open Rate = Email Opens / Emails Sent

A data ecosystem
Klipfolio works as an ecosystem. It’s an exciting workspace that brings data together so you can work smarter and drive results. With Klipfolio, you have the freedom to combine your data, any way you like, all in one place.
Our team is thrilled to share this new experience with you as we continue to help people succeed with data. From data lovers to soon-to-be data wizards, Klipfolio continues to innovate in order to help our customers’ feel confident in their work and business, and make actionable decisions, backed by data.
We hope you enjoy PowerMetrics and we look forward to seeing your data story unfold! Start building here.
And as always, we’re here to help you every step of the way. If you have any questions or feedback, we want to hear it. Shoot us an email at support@klipfolio.com or check out our Help Center.
Related Articles
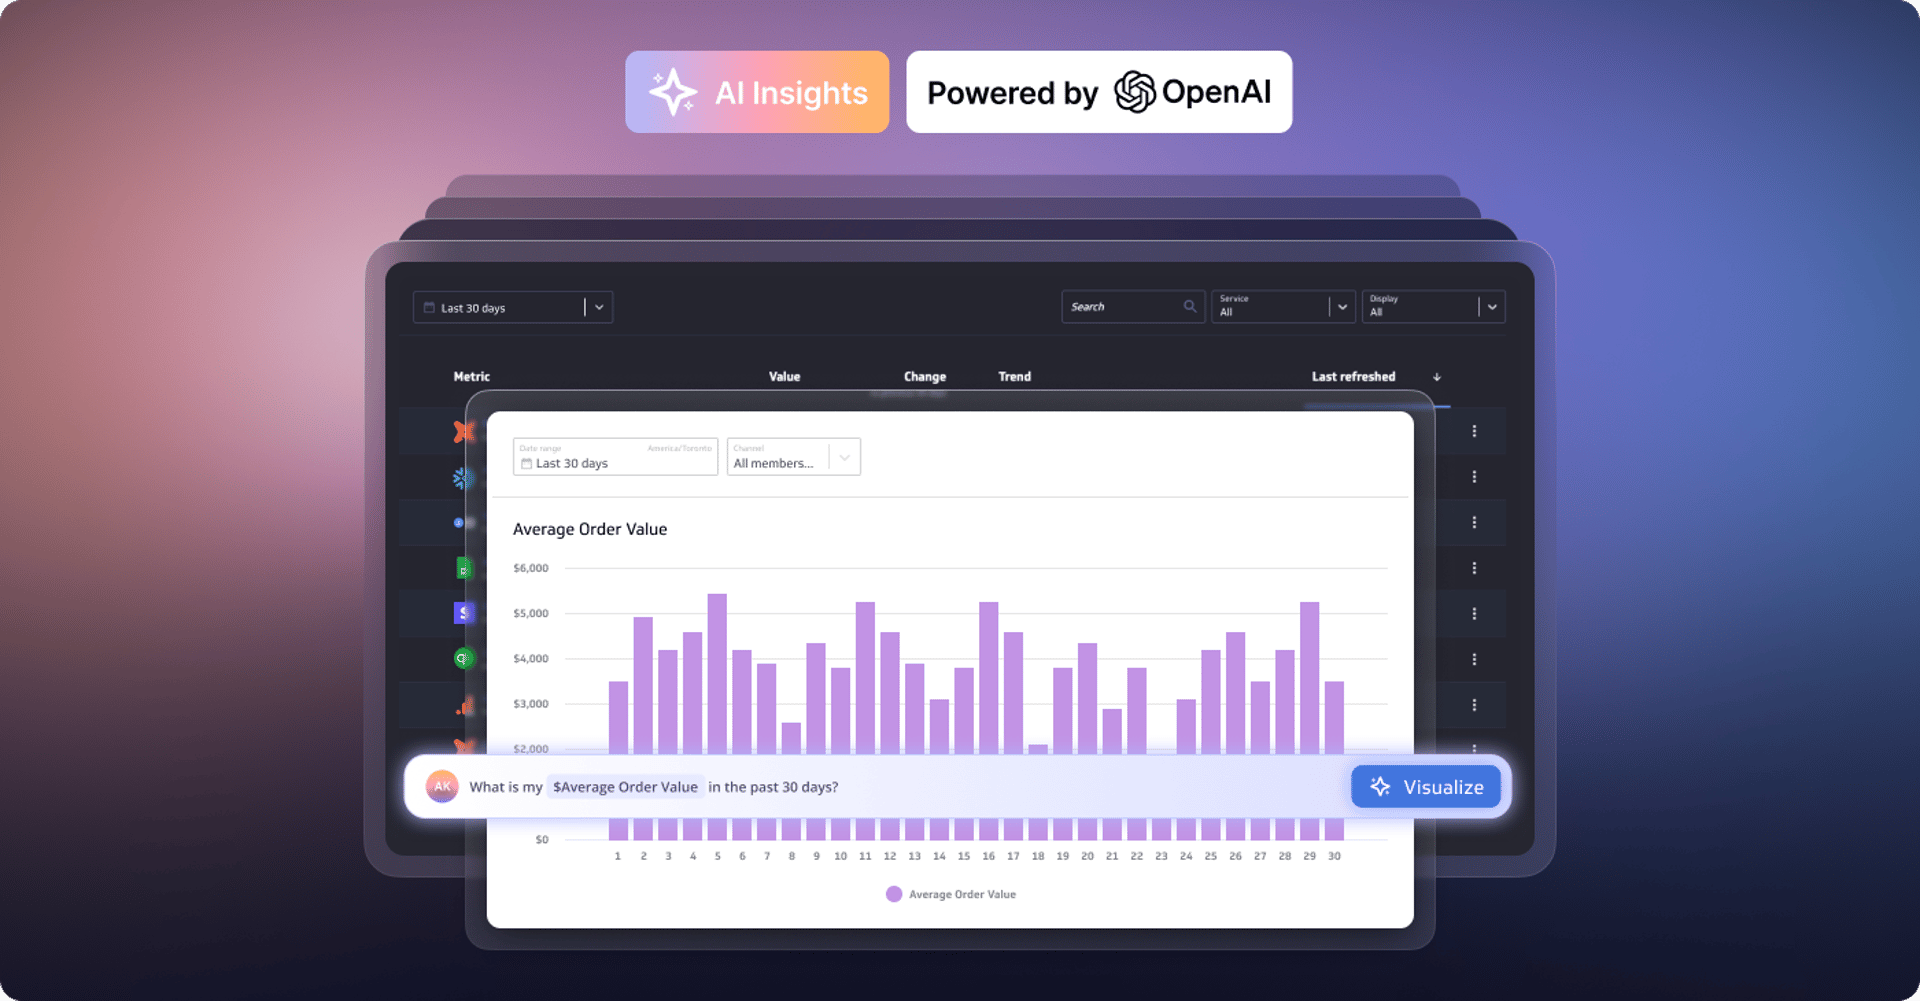
Metrics provide rich context for better AI: Introducing the new PowerMetrics AI experience
By David Mennie — June 21st, 2024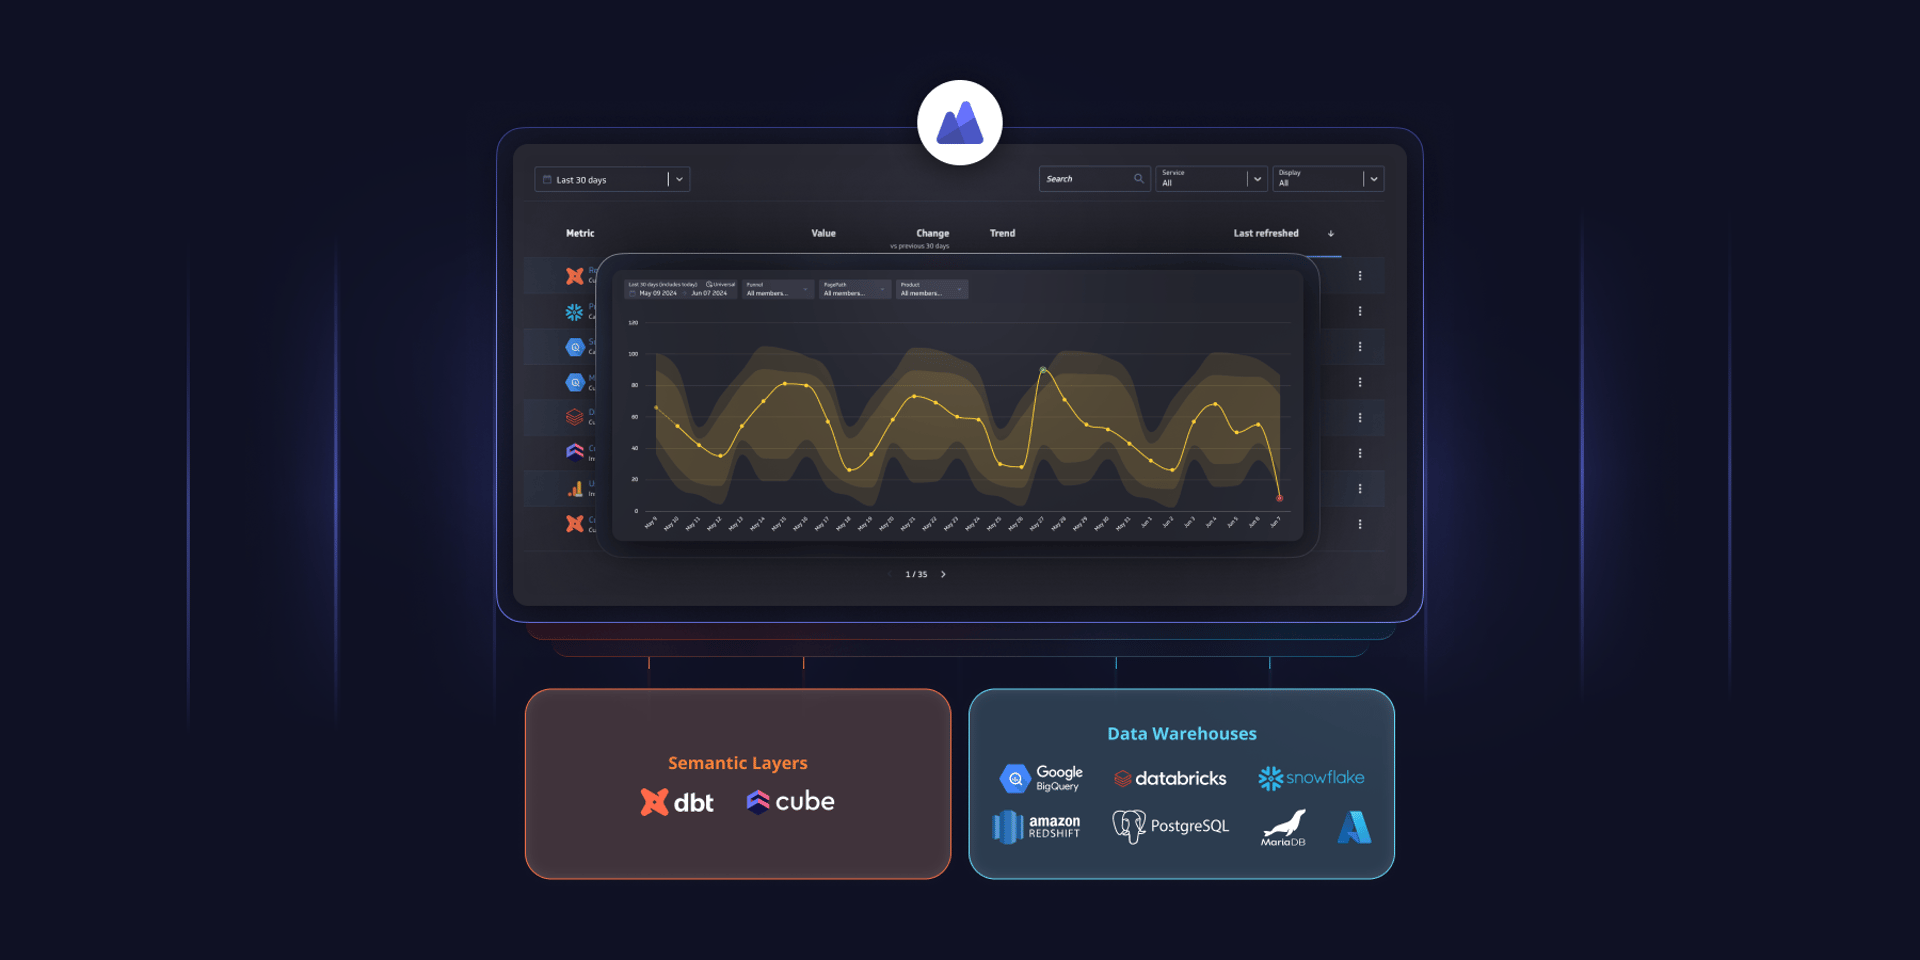
PowerMetrics - New data warehouse integrations and Cube semantic layer support
By David Mennie — June 14th, 2024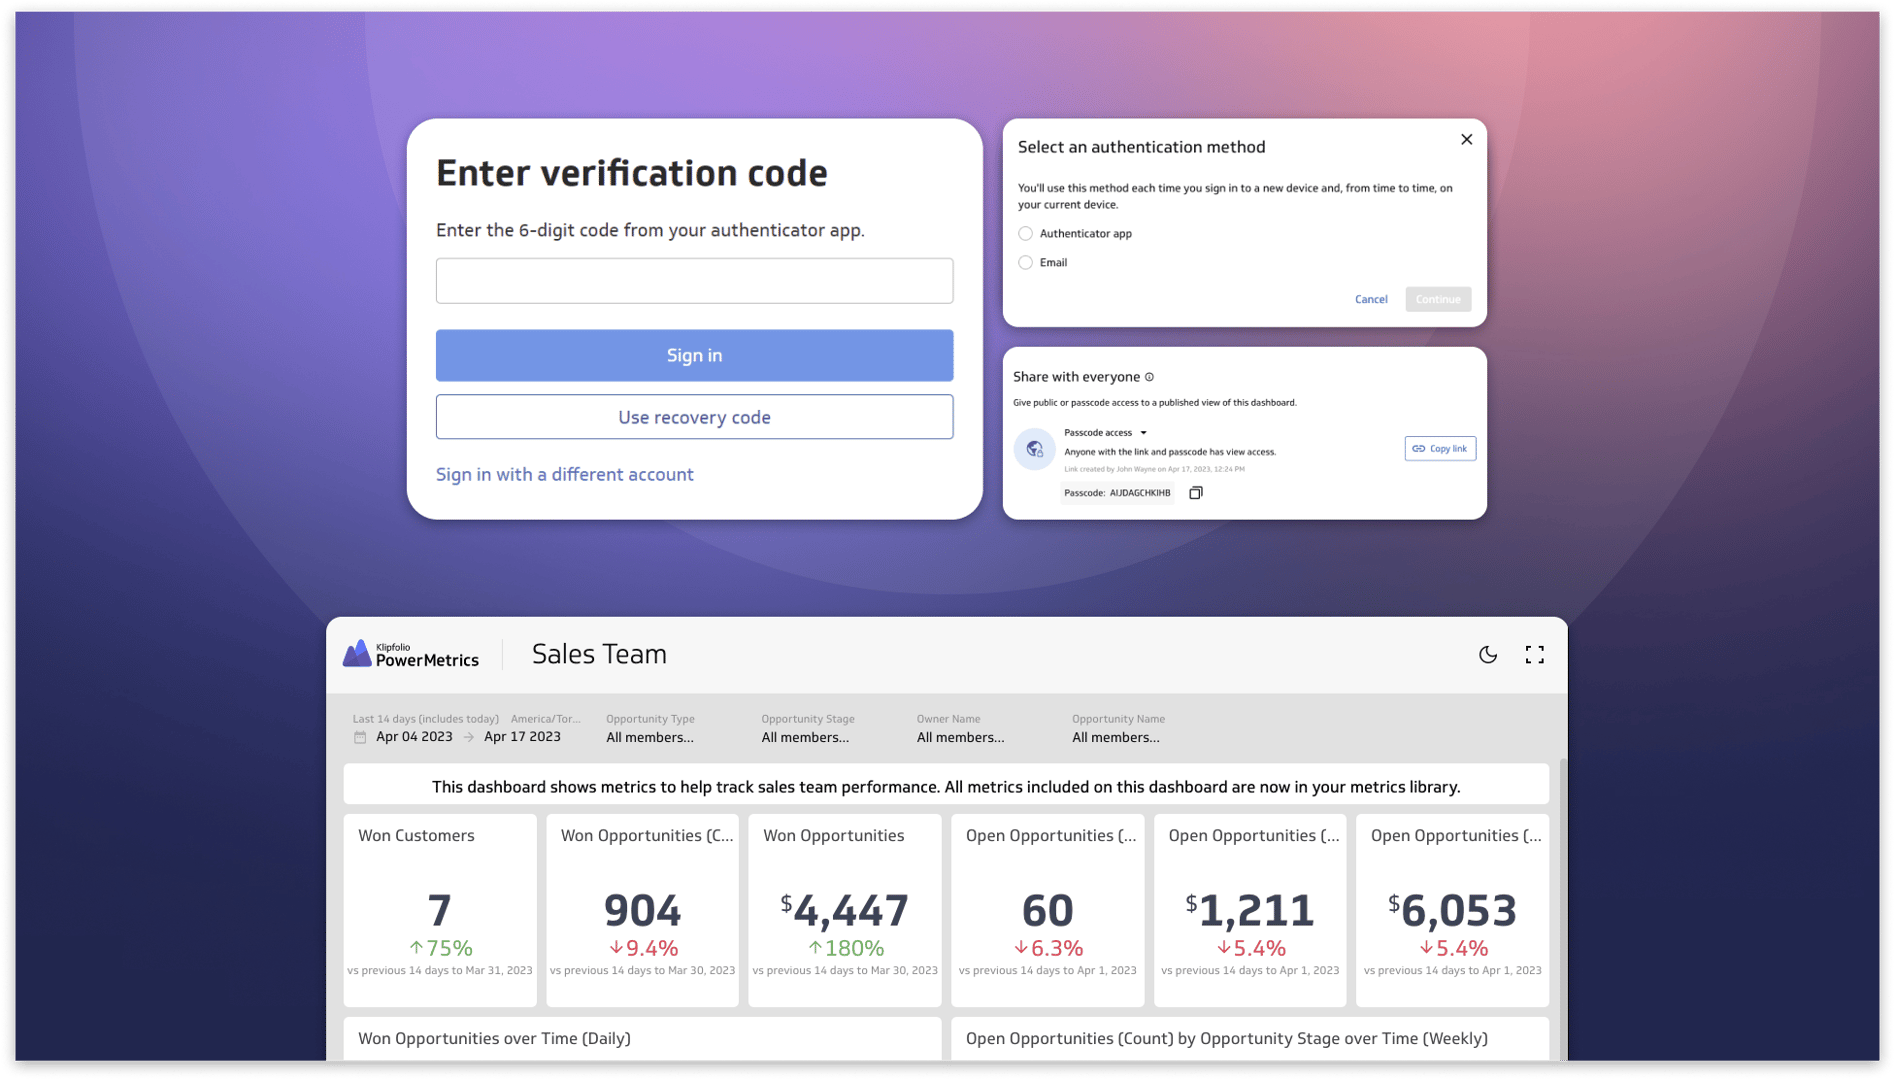
Secure and accessible dashboards for your extended team
By David Mennie — April 25th, 2023