

Boost these top 3 SaaS KPIs with marketing automation
Marketing automation only pays off when it maps to your funnel and the KPIs that signal real progress. This post covers the three SaaS marketing KPIs worth tracking: Content to Trial Lead Conversion %, True Trial %, and Trial to Win Conversion %. For each one, you will find a plain definition, why it matters to your business, and practical ways marketing automation can move the number.

Marketing automation is not new. What matters now is how you use it to move prospects through the funnel and tie every programme to the SaaS KPIs that signal real progress. Not just activity. Progress.
First things first: define your marketing automation KPIs
Defining what success looks like is a critical step in deploying marketing technologies. For a grounding in the fundamentals, see What is a Key Performance Indicator. For SaaS, three marketing automation KPIs consistently rise to the top:
Content to Trial Lead Conversion %
True Trial %
Trial to Win Conversion %
Before diving in, align on the funnel these KPIs measure.
Typical SaaS funnel stages
Visitors: Every journey starts with a visit.
Content leads: Visitors subscribe or download a resource.
Trial leads: Visitors or content leads start a free trial.
Wins: Trial users become paying customers.
1) Content to Trial Lead Conversion %
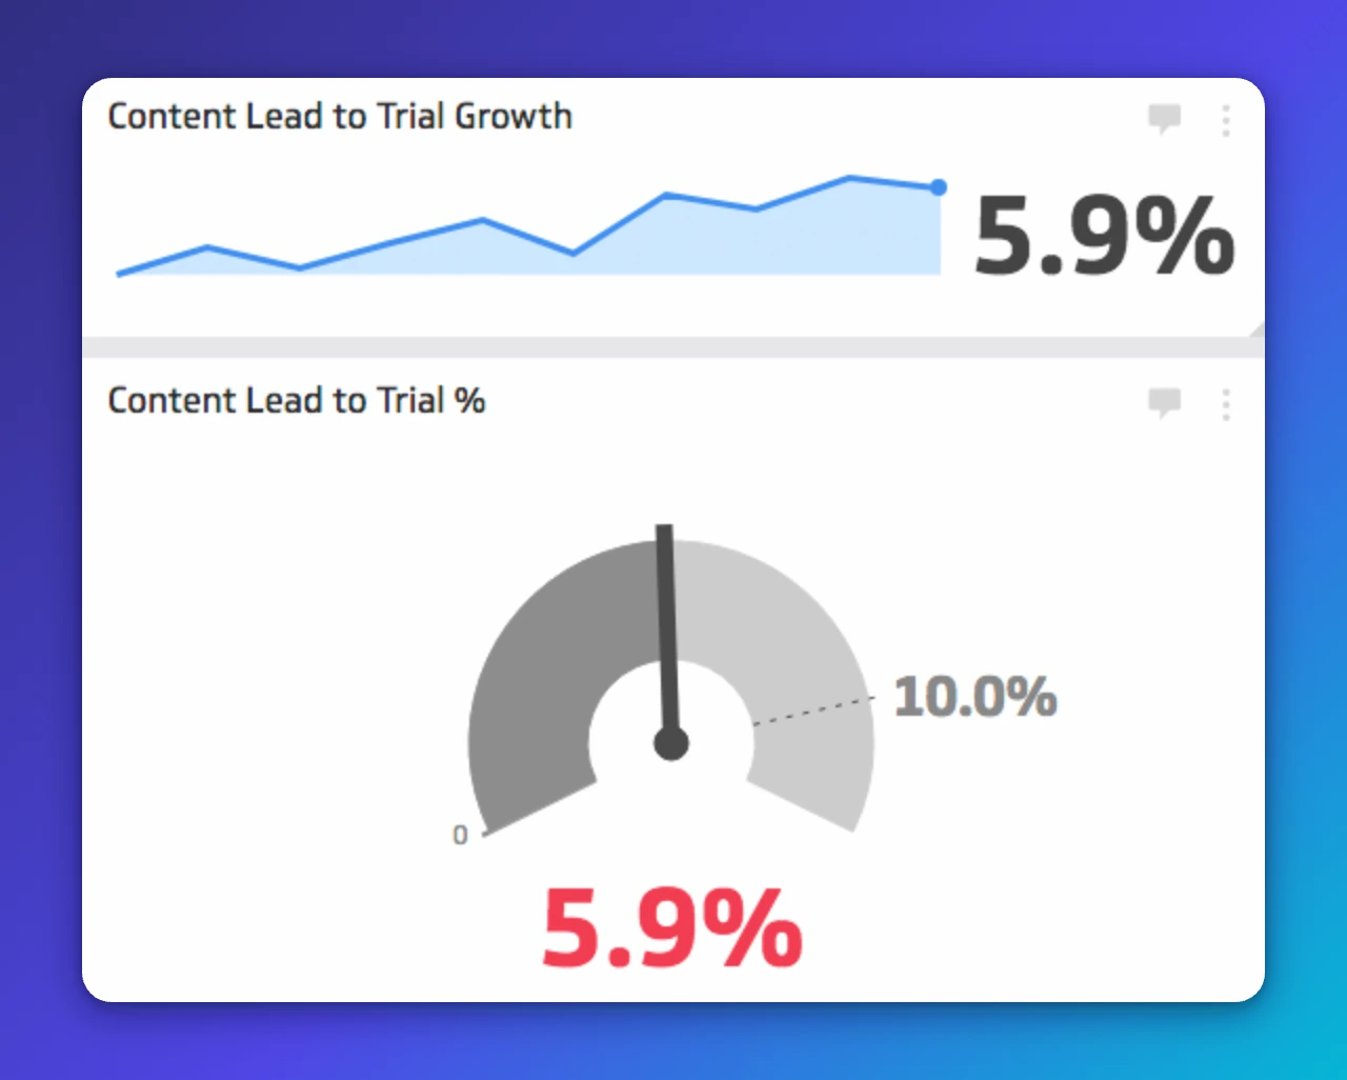
This KPI answers: How many content leads started a trial? Beyond building brand awareness, strong content moves leads toward a decision. Most prospects are not ready to trial on the first visit. Give them something useful and a clear next step, and you stay top of mind until they are.
A rising Content to Trial Lead Conversion % tells you your content is doing more than attracting visitors. It is creating intent, and intent is what turns a content subscriber into a revenue opportunity.
How can marketing automation help?
Map content to journey stages and deliver it at the right time. If a contact downloaded a guide on digital marketing KPIs, follow up with related pieces as short, sequenced emails. Short on new content? Repurpose. Pull top posts into a 5-part email course.
Lesson 1: Essential HTML tags
Lesson 2: Web traffic source metrics
Lesson 3: Using GA Query Explorer
Lesson 4: Connecting YouTube to GA
Lesson 5: Tracking Facebook Ads in GA
Instead of pasting numbers into a spreadsheet, or explaining your content mix to a generic AI tool from scratch every time, a live dashboard shows you exactly where leads are dropping off. You know what to fix without having to ask. See the Lead Generation Dashboard for a benchmark view of top-of-funnel performance.
2) True Trial %
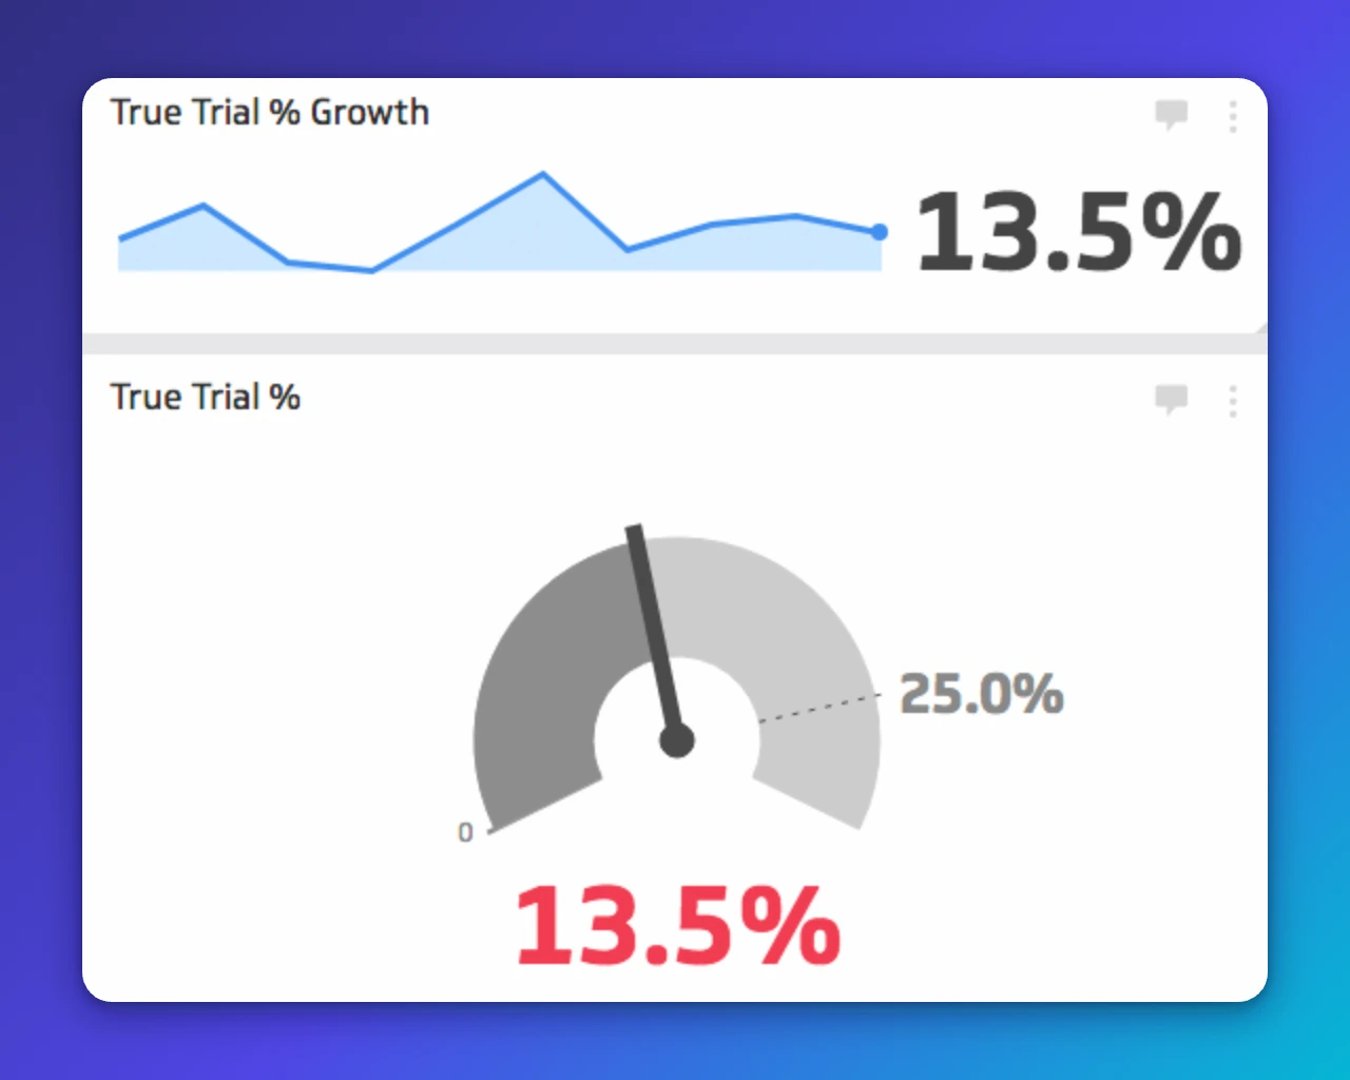
This KPI answers: What is the quality of your trials? Not all signups are equal. Many accounts never log back in. A practical definition of a "true trial" is an account that returns on day 2. Early activity is a strong signal of genuine evaluation intent, and it is one of the clearest leading indicators of revenue you have.
Trial users active in the first 3 days are far more likely to convert.
If you are waiting for someone to pull this number for you, or piecing it together from exports, you are already behind. And pasting account-level data into a chatbot to figure out who is engaged is not a workflow, it is a workaround.
How can marketing automation help?
Use product analytics and lifecycle tools to trigger messages based on behaviour. Tools like Mixpanel, Amplitude, or Segment can send events to systems such as HubSpot, Marketo, or customer messaging platforms. Move from fixed drip schedules to trigger-based nudges that respond to what each user actually does:
Trigger: Trial start: send welcome email
Trigger: Creates first visualization: send congrats email
Trigger: No login on day 2: send nudge
Trigger: No demo booked: invite to schedule
Trigger: Formula error: route to support
The goal is not more emails. It is the right message at the moment it matters, without your team having to watch every account manually. You get to know who is engaged without having to check.
3) Trial to Win Conversion %
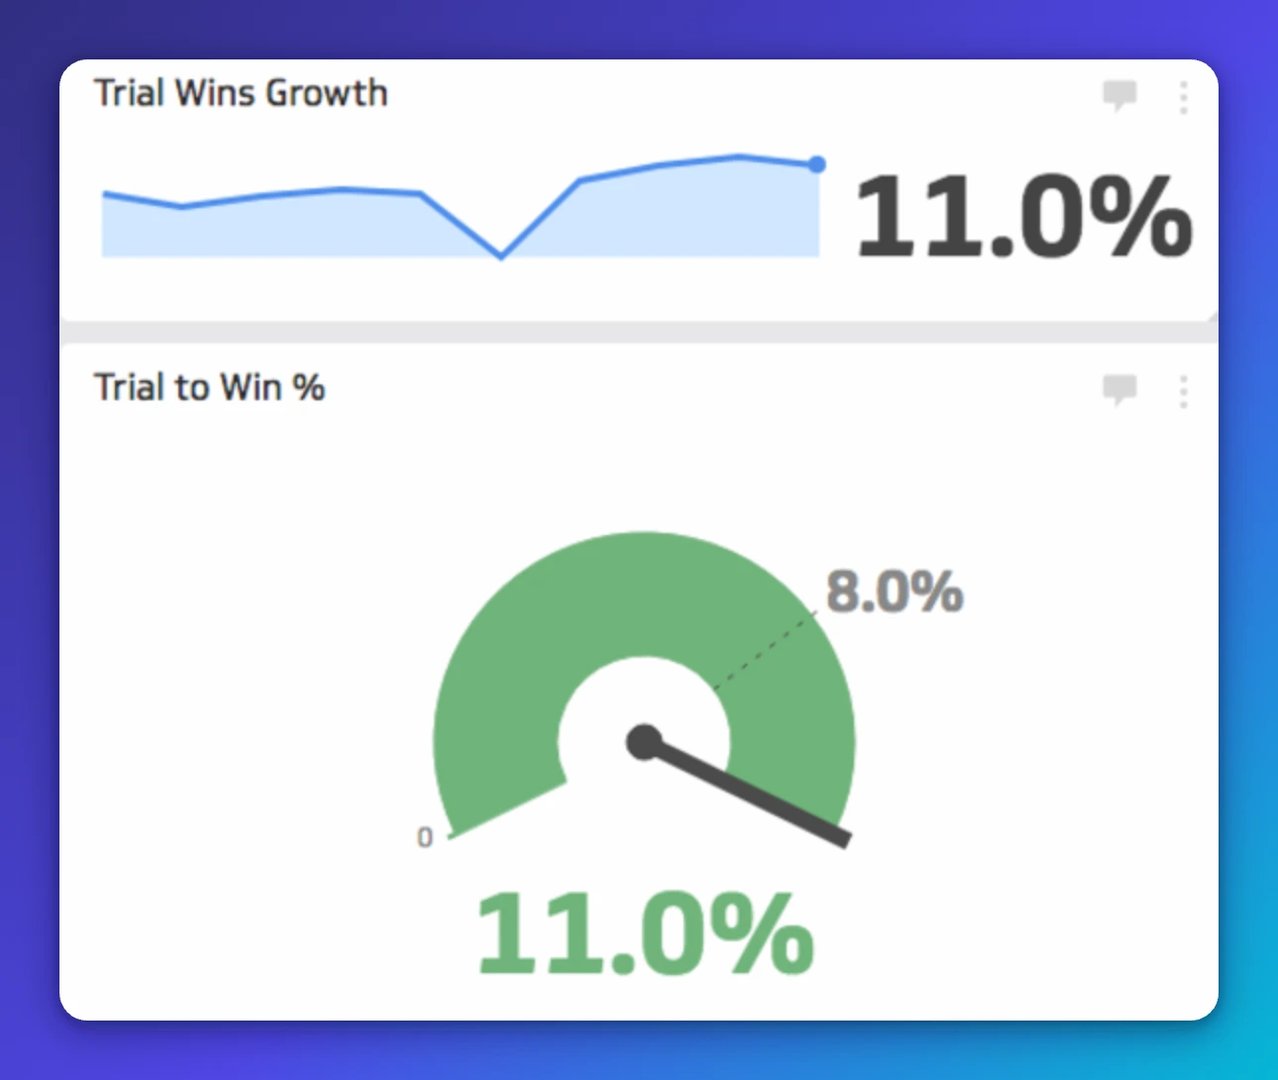
This KPI answers: How many free trials became paying customers? This is the number your leadership team cares about most. Empathy drives conversion here. Identify where engaged accounts stall, highlight moments of value, and make upgrading as frictionless as possible.
A small lift in Trial to Win Conversion % compounds quickly. It is worth knowing this number precisely, not approximately, and not 48 hours after the fact.
How can marketing automation help?
Personalize offers near the end of a trial. Simplify checkout. Offer extensions or demos to engaged accounts that need more time. When trials expire without converting, move contacts into a thoughtful nurture that reflects what they did during the trial, not a generic sequence.
Track outcomes in one place rather than figuring it out yourself across disconnected tools. A consolidated view like the Sales KPI Dashboard keeps your whole team oriented to the same number, with no one waiting for a report to be pulled.
Put the three KPIs somewhere everyone can see them
Marketing automation works when it respects the buyer's context. Track the KPIs that matter, send timely prompts, and keep every message useful. The teams that move fastest are the ones who do not have to ask "what is the number?" They already know because the number is always in front of them.
Put Content to Trial Lead Conversion %, True Trial %, and Trial to Win Conversion % on a live dashboard your team sees every day. No more waiting for someone to pull a report. No more pasting figures into a chatbot and hoping for insight. Just the numbers that tell you what to do next.
Create custom dashboards for you and your team.
Get started with KlipsAdditional resources
Updated 2026-08-28
More in How To

How your online advertising and eCommerce site are driving sales

How to use lifecycle stages and lead status in HubSpot

13 marketing metrics you need to track

6 marketing automation lessons: from data to dashboard

The hidden value of SaaS sign-up rate benchmarks

4 dashboards our marketing team uses to track the metrics that matter most
Most recent
- SEP 25What SOC 2 taught a small team about trust
- SEP 15The AI race: progress, humanity, and trust
- SEP 9The good advisor
- AUG 11Beyond simple sign-ups: how True Trials and Activation predict growth
- JUL 7Why business leaders miss important trends in their dashboards
- JUN 19The best chart for the job: Visualizing data for non-technical users