
Summary - In this blog series, I will be defining essential marketing metrics that every digital marketer needs to understand and track. This series is aimed at junior marketers, and, as such, I will be approaching the content from a 101 perspective. Throughout each post, I’ll provide practical, actionable advice and tips to help you better track your organizations marketing KPIs.
In this blog series, I will be defining essential marketing metrics that every digital marketer needs to understand and track. This series is aimed at junior marketers, and, as such, I will be approaching the content from a 101 perspective. Throughout each post, I’ll provide practical, actionable advice and tips to help you better track your organizations marketing KPIs.
I want to start this series with a metric I use extensively: web traffic sources.
Introduction - Traffic sources as a lens through which to view campaign performance
I like to think of the web traffic sources metric as a lens through which to view the performance of your digital marketing efforts. Every digital marketing campaign you launch leaves a breadcrumb trail that you can follow back to your website. As such, this metric is the way that you analyze that trail and the quality of leads brought from that source.
The web traffic sources metric isn’t a definitive metric in the conventional sense, rather it’s a collection of digital marketing KPIs that provide perspective on your performance. Here’s an example:
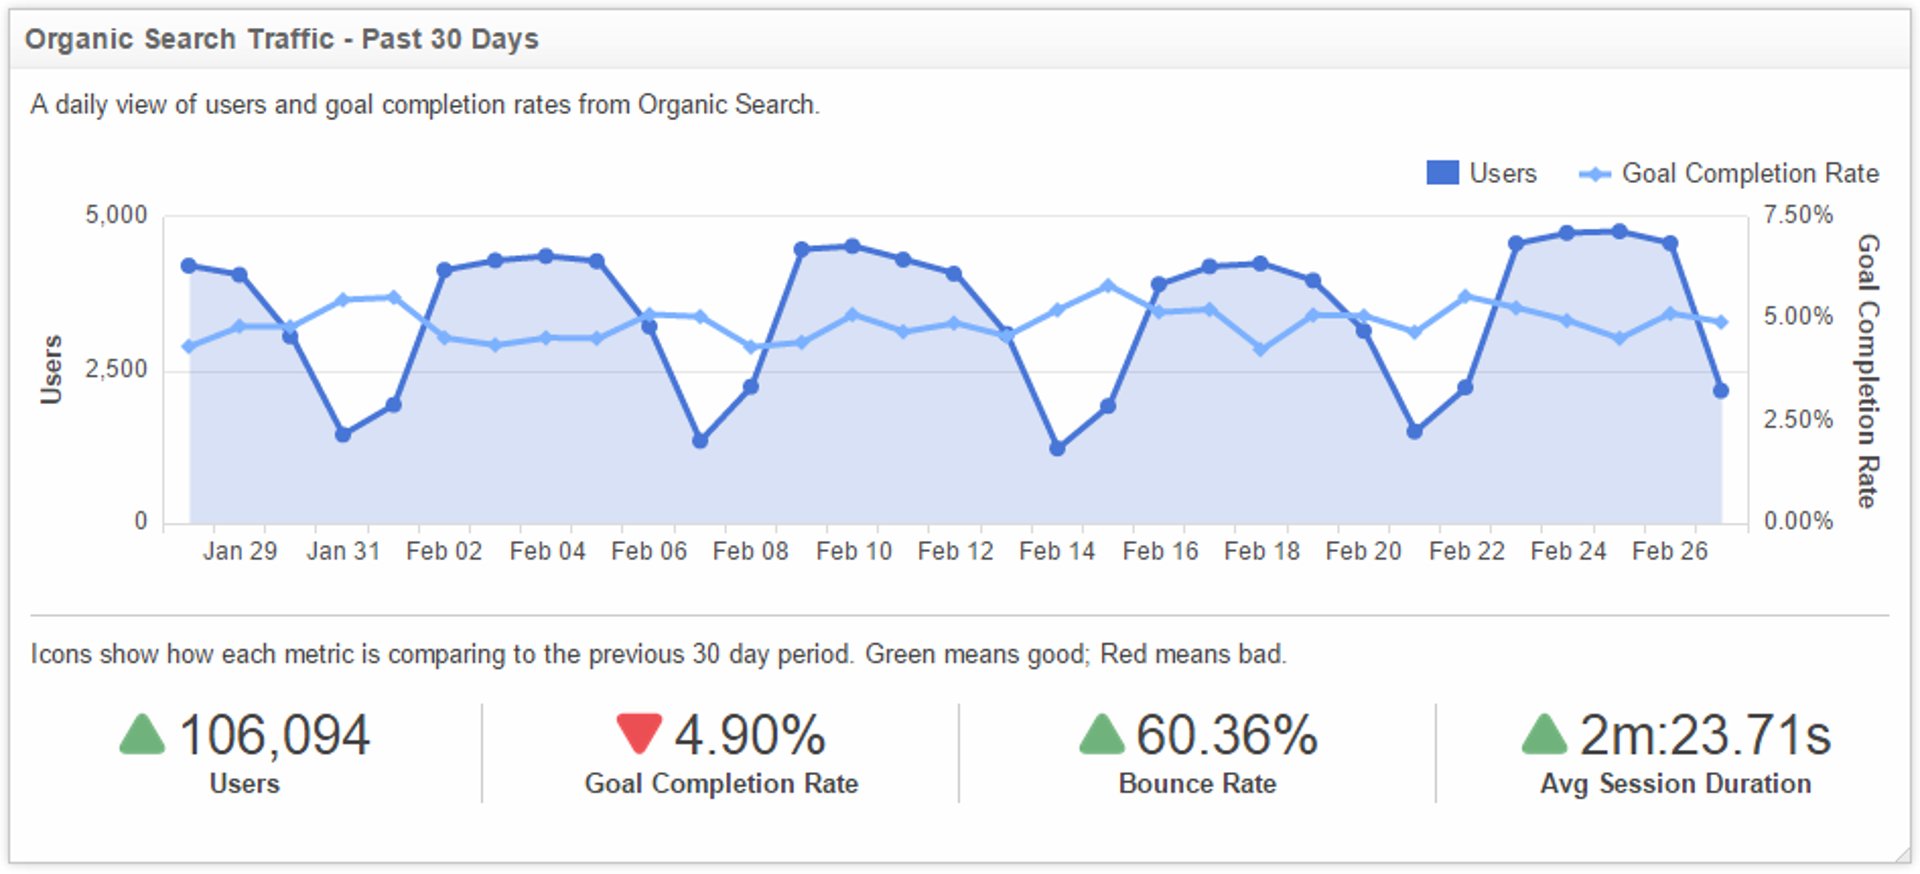
How are we doing in SEO? By viewing metrics associated with this type of visitor, we can see goal completion rates, time on site, and bounce rates to assess the quality of our content. Learn more about key metrics to add to your SEO dashboard.
Defining Sources and Mediums
Now you’ll notice that I’ve been using the phrase “Traffic Sources” in the generic sense of this is the point of origin for website traffic. When we start scratching below the surface, you’ll find that Google Analytics uses the term sources in a specific way. While I don't think I'm using this term incorrectly (I’ve found common ground on this term with other web analysts), I am using it as an umbrella term that really covers two distinct, but related terms: source and medium. Learn more: SEO traffic.
In Google Analytics, source refers to the online point of origin for a web visitor. Examples include “google” (search engine), or “facebook.com” (referring website).
On the other hand, medium refers to the method by which visitors found your website. Examples include “organic search traffic”, “referral traffic,” or “cpc” (for paid search).
More info: Traffic source dimensions
These distinctions are important, since a) Google Analytics pairs these metrics together, and b) we’ll be using Google Analytics to track this metric’s performance. To make this distinction clear, let’s look at a few examples of source / medium pairs and how they can differ. Learn how to track SEO performance on a Google Analytics dashboard in Klipfolio.
Source | Medium | What happened? |
|---|---|---|
| Referral | Someone clicked a link on Twitter (source) that has referred (medium) them to your website | |
| Advertising | Someone has clicked a paid link (medium) on Twitter (source) that directed them to your website | |
| Organic Search | Someone has submitted a keyword search (medium) using Google (source) that brought them to your website. Learn how to improve your SEO keyword ranking. | |
| CPC | Someone has submitted a keyword search using Google (source) which prompted a keyword ad (medium) which they clicked and brought them to your website | |
| None | Direct | Someone visited your website by typing your website’s URL into their browser (medium), and didn’t come to your website through a link (source) |
Tracking the traffic source metrics in Google Analytics
Google Analytics is your first resource for tracking this marketing metrics, and it will do a lot of work for you by automatically grouping visitors into different buckets for quick and easy analysis. If you don’t have Google Analytics set up, you can learn how to do that here: Getting started with Google Analytics ; or, if you don’t have access to the account, talk to your website admin to get set up, as there’s no substitute to direct access to the data.
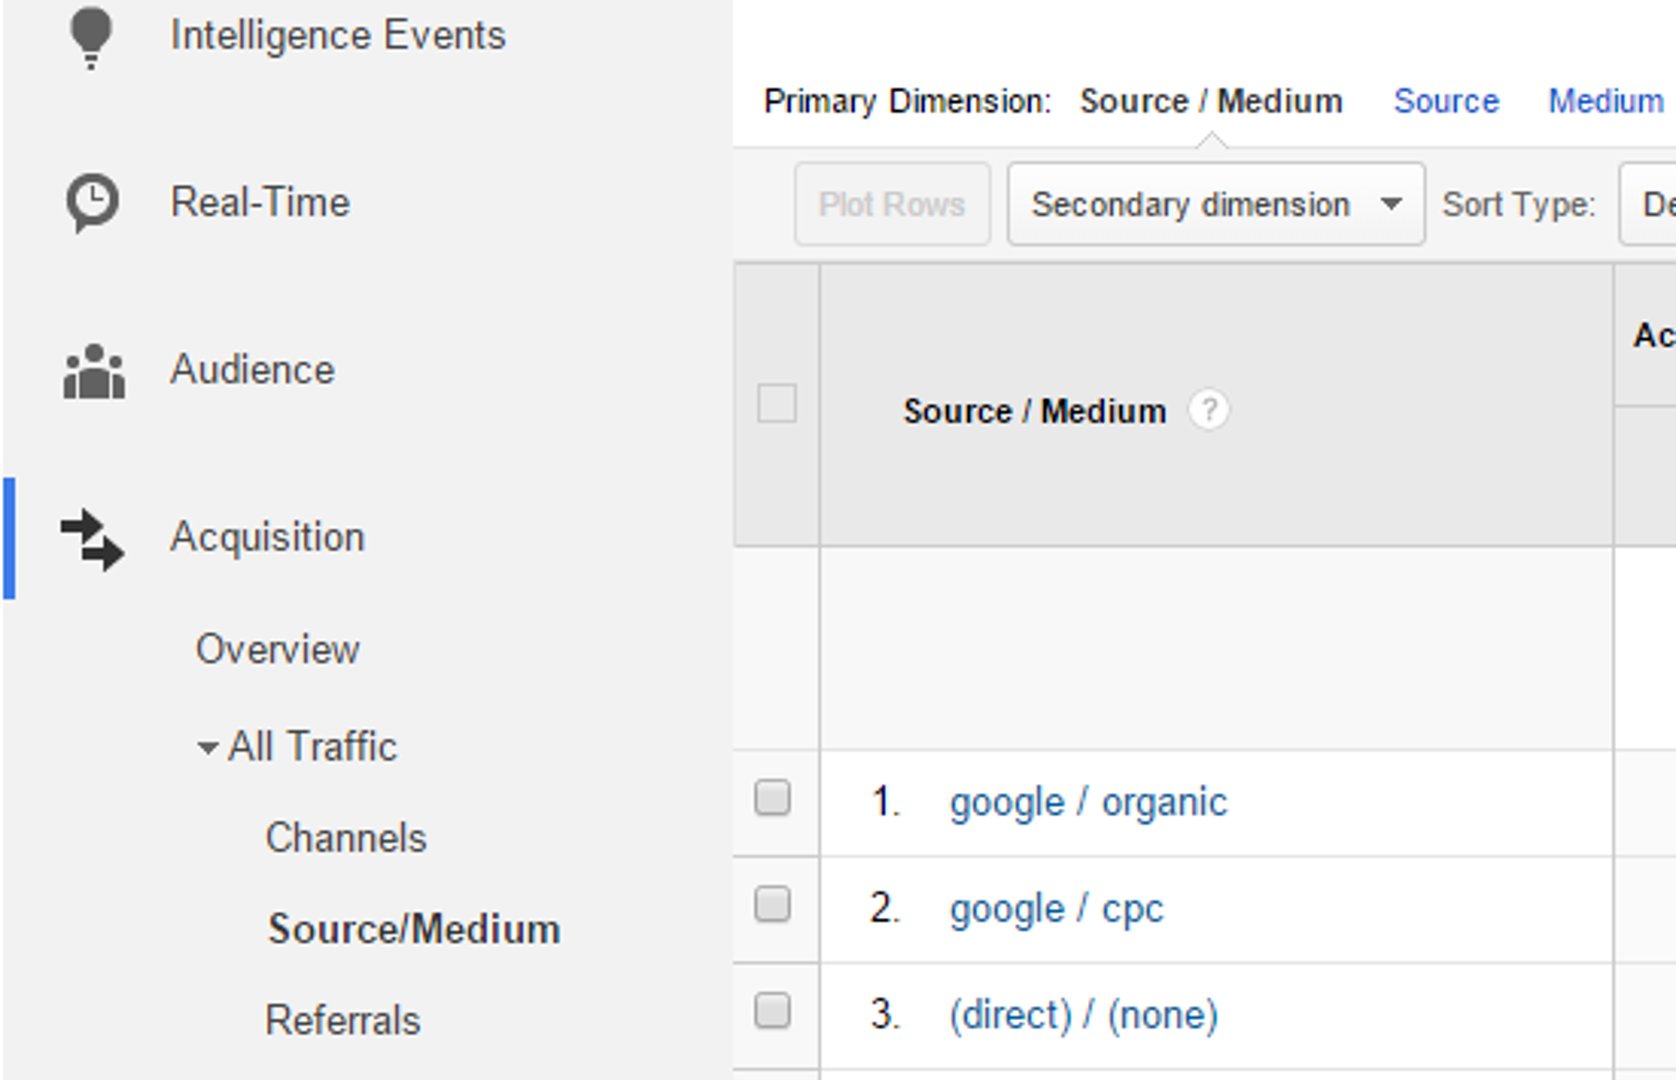
Within Google Analytics, navigate to the Acquisition section and open the Source / Medium report. This report allows you to view key behaviour, acquisition, and conversion metrics for each traffic source. While you can use segments and secondary dimensions to do some deep analysis on this traffic, I recommend you start by understanding the default report.
6 things to look for when analyzing traffic sources
1. Goal completion rates
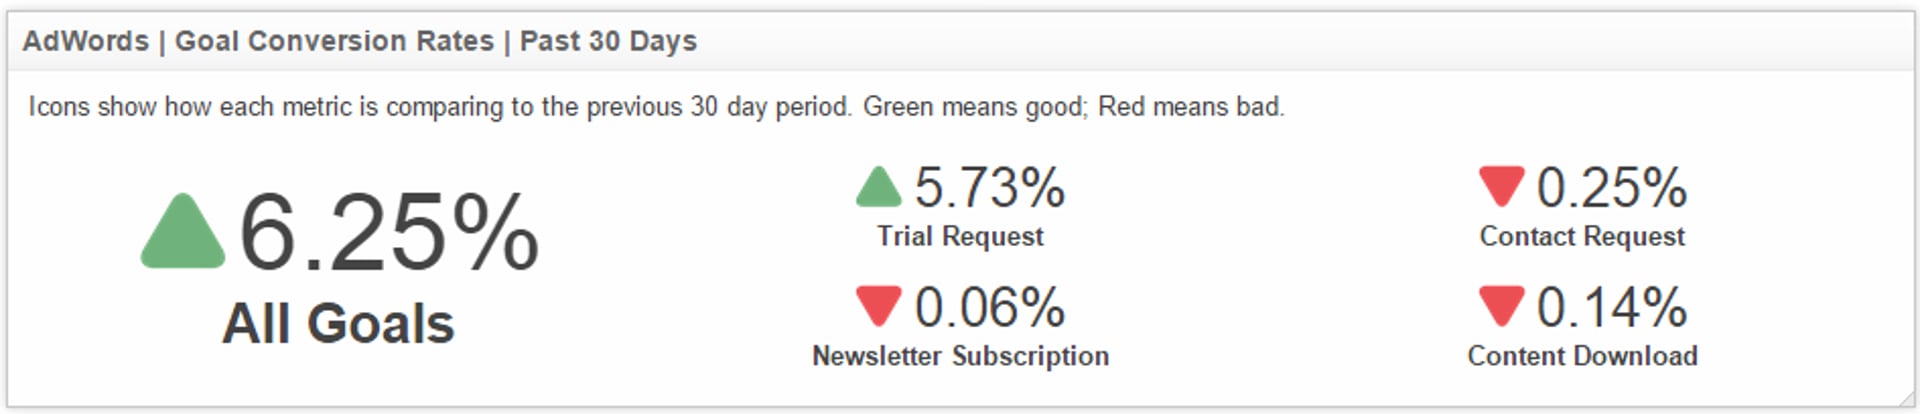
Goal tracking in Google Analytics allows you to map user behaviour and interactions to specific marketing objectives. For example, you may have goals to track contact requests, online purchases, or social media shares. Goal completion rates are closely tied to the quality of traffic. Pay extra close attention to this metric when evaluating paid channels like AdWords or Banner Ads.
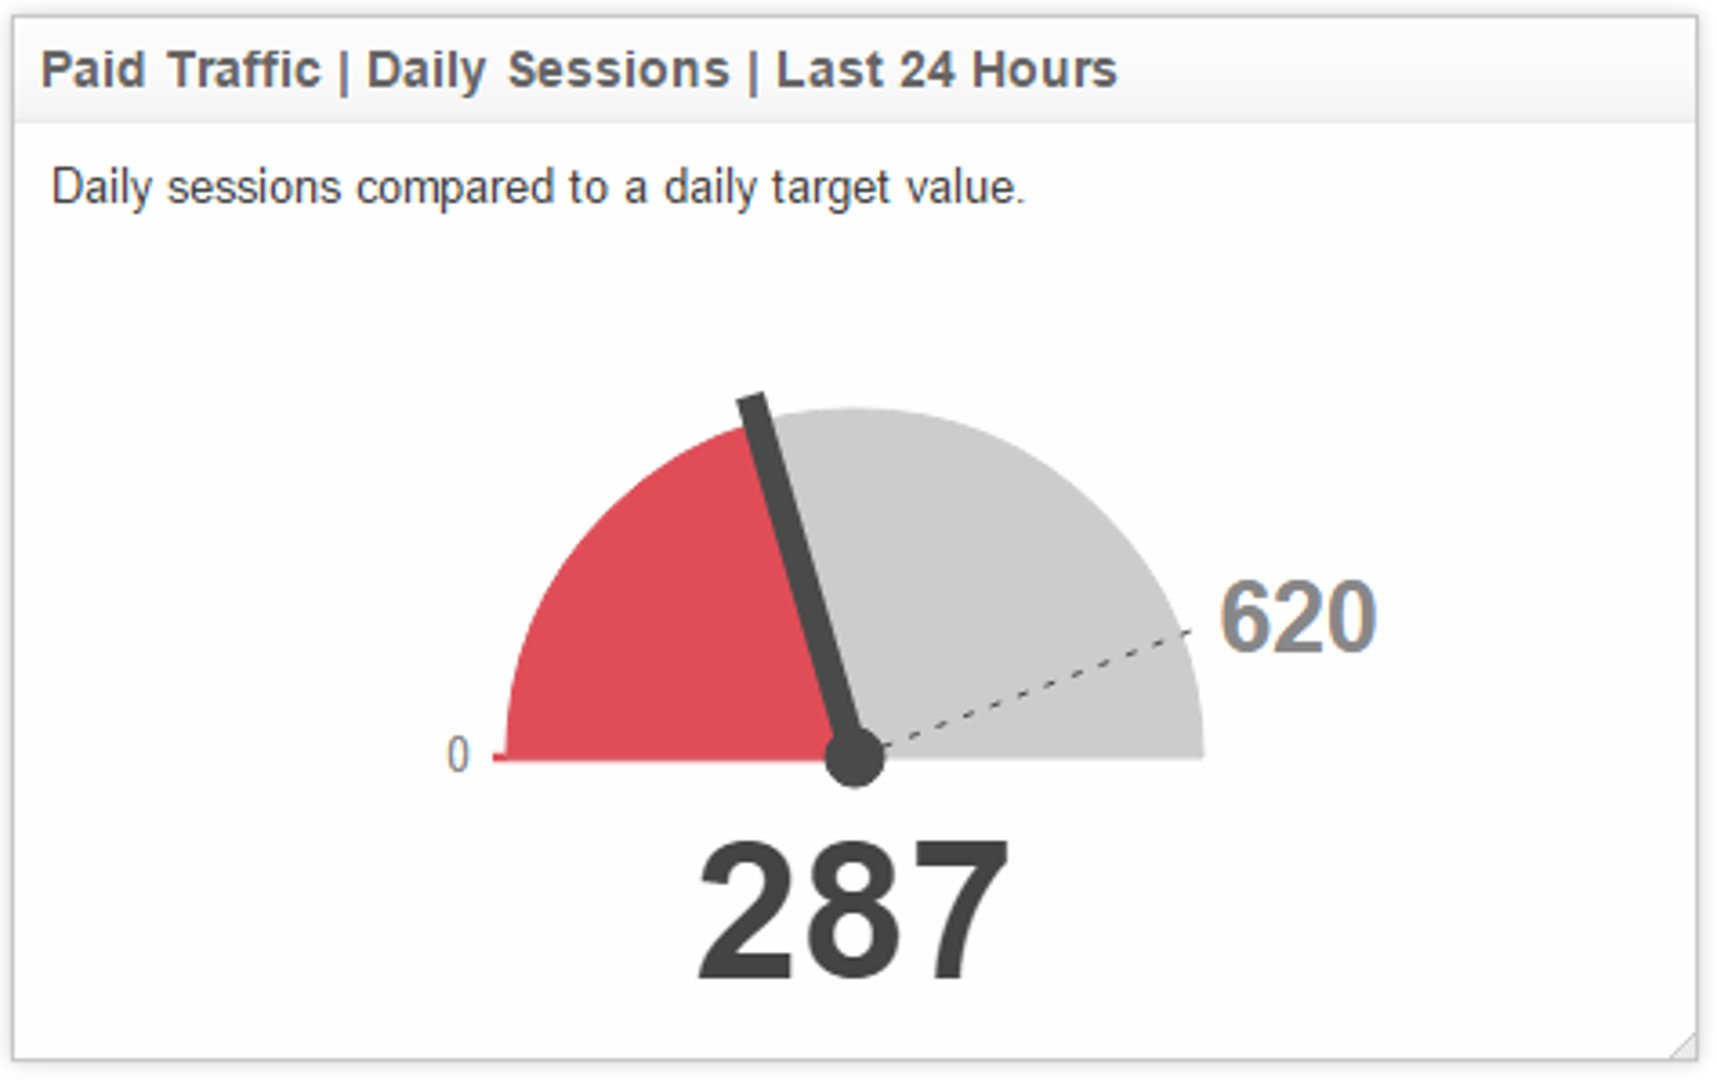
2. Sessions
This metric calculates the total number of sessions for each default channel grouping based on the 'engagement' options selected in the dropdown. This means that the number displayed in the table can change drastically. For instance, if you define engagement as "4 or more pageviews," only the sessions that an average of 4 or more will be displayed in the 'Engaged' row (similarly, only sessions with a value less than 4 will be displayed in the 'Not Engaged' row).
3. Bounce rate
I call bounce rate a “first impression” metric. A high bounce rate means people land on your website, don’t like what they see, and immediately leave. For some source/mediums, a high bounce rate is normal. You should compare different types of traffic sources, and determine what’s an acceptable bounce rate for your website, and the type of campaign you're running.
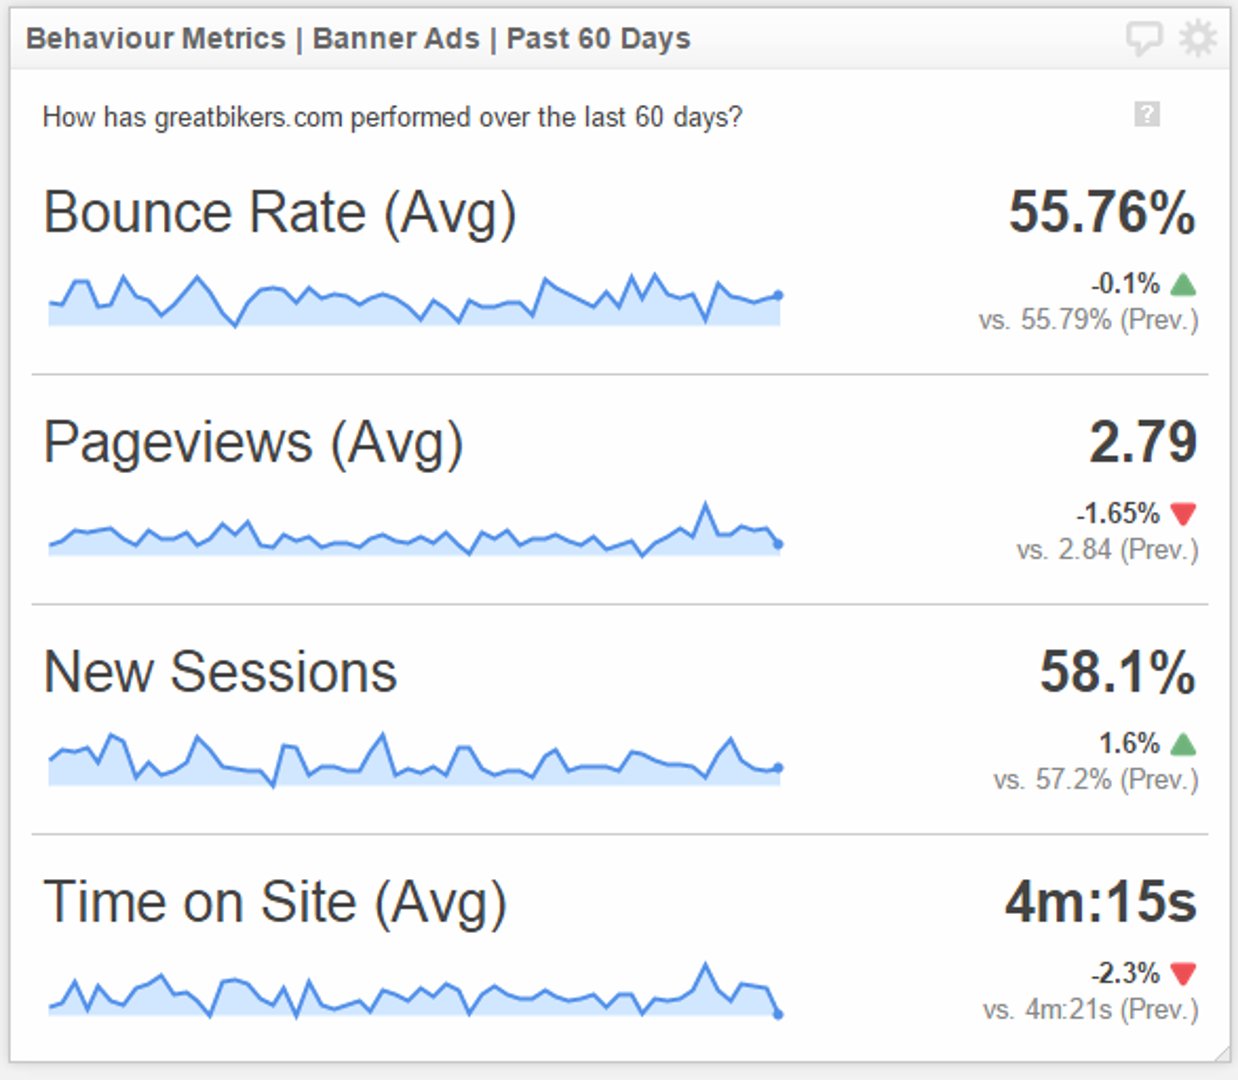
4. Pages / Session
This metric is important to track for unpaid traffic sources like organic search traffic and referral traffic. The reason I say this is that paid sources will often be brought to a landing page which is focused on converting traffic and provides fewer links to the rest of your website. Unpaid sources, on the other hand, will bring traffic to content pages like a blog that will, hopefully, engage users.
5. % New Sessions
In order to grow your website traffic, you will need to cast an ever wider net to bring in new web visitors. Certain channels, like referral or email traffic may primarily bring in returning traffic, while paid channels, like cpc or banner ads, will fill the top of the funnel with new visitors.
6. Time on Site
Is the content on your website compelling enough to engage web visitors for a significant amount of time? This is a strong indication of how well you're targeting your content for paid advertising campaigns.
How to use this metric in your marketing department
For the majority of marketers, the traffic sources metric is one that is reported on with a low degree of frequency, typically only during monthly performance evaluations. However, by breaking out of this reporting mould, you can use this marketing metric as a vehicle for tactical, real-time decisions that have immediate results.
In fact, this scenario played itself a few weeks ago here at Klipfolio. You see, we were running some paid advertising and noticed that 24 hours after campaign launch, the traffic quality from this advertiser was abysmally poor. Our monitoring dashboard alerted us of the issue, and we reached out to the advertiser and shifted our inventory to a more productive, reliable channel. Another 24 hours later, everyone was happy to see improved results (especially our CMO).
The takeaway? Being an expert on the traffic sources metric is only half the battle. The other half is make sure everyone in your department is aware of this metric, especially when the traffic source pertains to a particular activity or a campaign. One effective way to do this is to create a web analytics dashboard that summarizes your web performance in a way non-Google Analytics experts (like your CMO or VP of marketing) will understand.
Get started with our Google Analytics Dashboard today.
Useful resources
Related Articles

5 tips to understand (and organize) your restaurant data
By Saleem Khatri — June 9th, 2026
6 Facebook ads reports every agency needs to attract and retain high-ticket clients
By Tanya Brody — April 10th, 2026
6 dashboards I use daily to run my SaaS company
By Allan Wille, Co-Founder — April 10th, 2026
