How Lexington Podiatry Enhanced Patient Satisfaction with Survey-Powered Dashboards
Lexington Podiatry is a Kentucky-based medical clinic that provides world-class ankle and foot care. In its efforts to increase patient satisfaction, it partnered with Klipfolio to uncover trends in patient sentiments, expectations, and problems.
Hospitals & Health Clinics
Patient Experience Optimization
Maximizing customer satisfaction requires properly monitoring, understanding, and improving relevant performance metrics. To generate better insights faster, you need data visualization tools that make your information easier to summarize, interpret, and share. The more intuitive your data is, the faster you can gauge customer sentiments, identify pain points, and evaluate the success of customer-focused strategies. Lexington Podiatry streamlined how they monitor customer satisfaction by choosing a real-time dashboard solution, Klipfolio Klips, to enable timely responses, clearer goals, and more efficient team alignment.
Introducing Lexington Podiatry
Lexington Podiatry is a Kentucky-based podiatric practice that treats a wide variety of foot and ankle conditions. To improve the quality of their practice, they sought a patient-focused approach, aiming to identify and resolve the common issues patients encountered when seeking treatment at the clinic, such as slow wait times, poor staff treatment, and scheduling.
They began to distribute surveys to their patients via email after each appointment. Initially, the clinic’s goal was to source and share patient testimonies to improve trust. However, they realized they could use the survey results to improve their practice and enhance satisfaction. They already had the necessary data collection tools: CampaignMonitor to share emails and SurveyGizmo to host surveys. All they needed was a tool that could help them organize, view, and analyze their results.
Visualizing problems to create solutions
To make results easier to digest and interpret, Lexington Podiatry fed their survey data to Klips, which allowed them to create data visualizations and dashboards. The dashboards helped them interpret performance and examine trends at a glance.
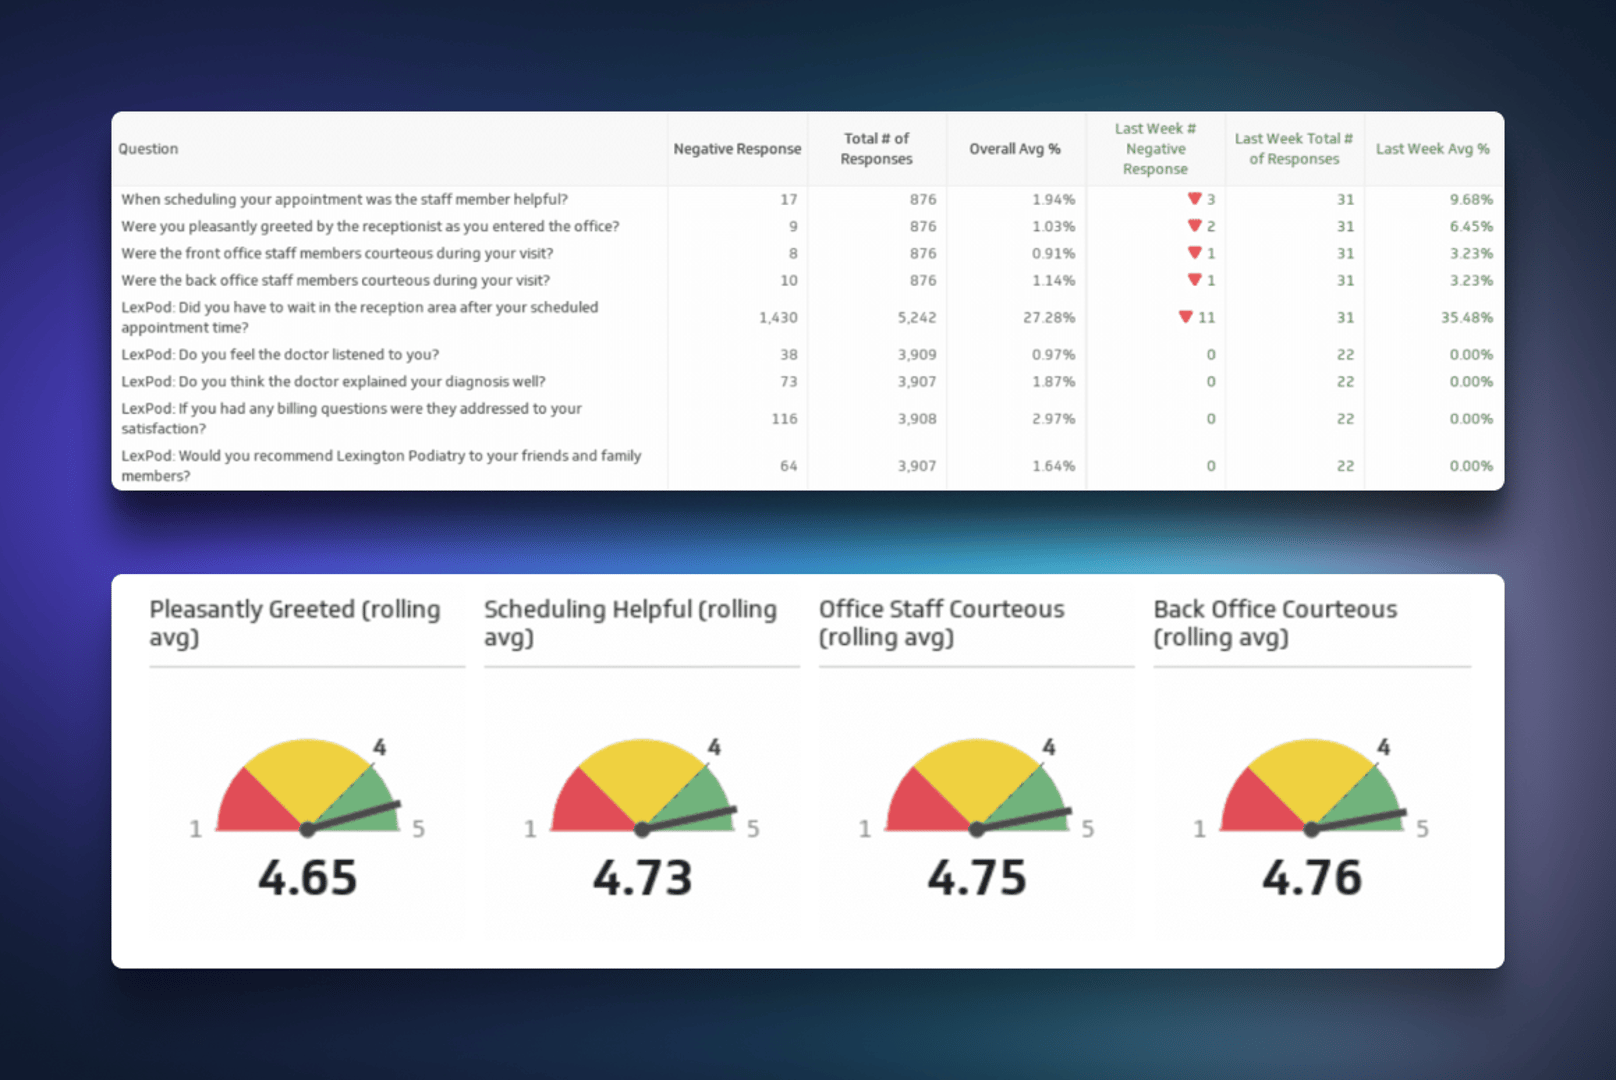
Examples of survey results Lexington Podiatry tracked include:
Satisfaction with wait times
Satisfaction with staff interactions
Satisfaction with care practitioner interactions
Likelihood of recommending the practice to family and friends
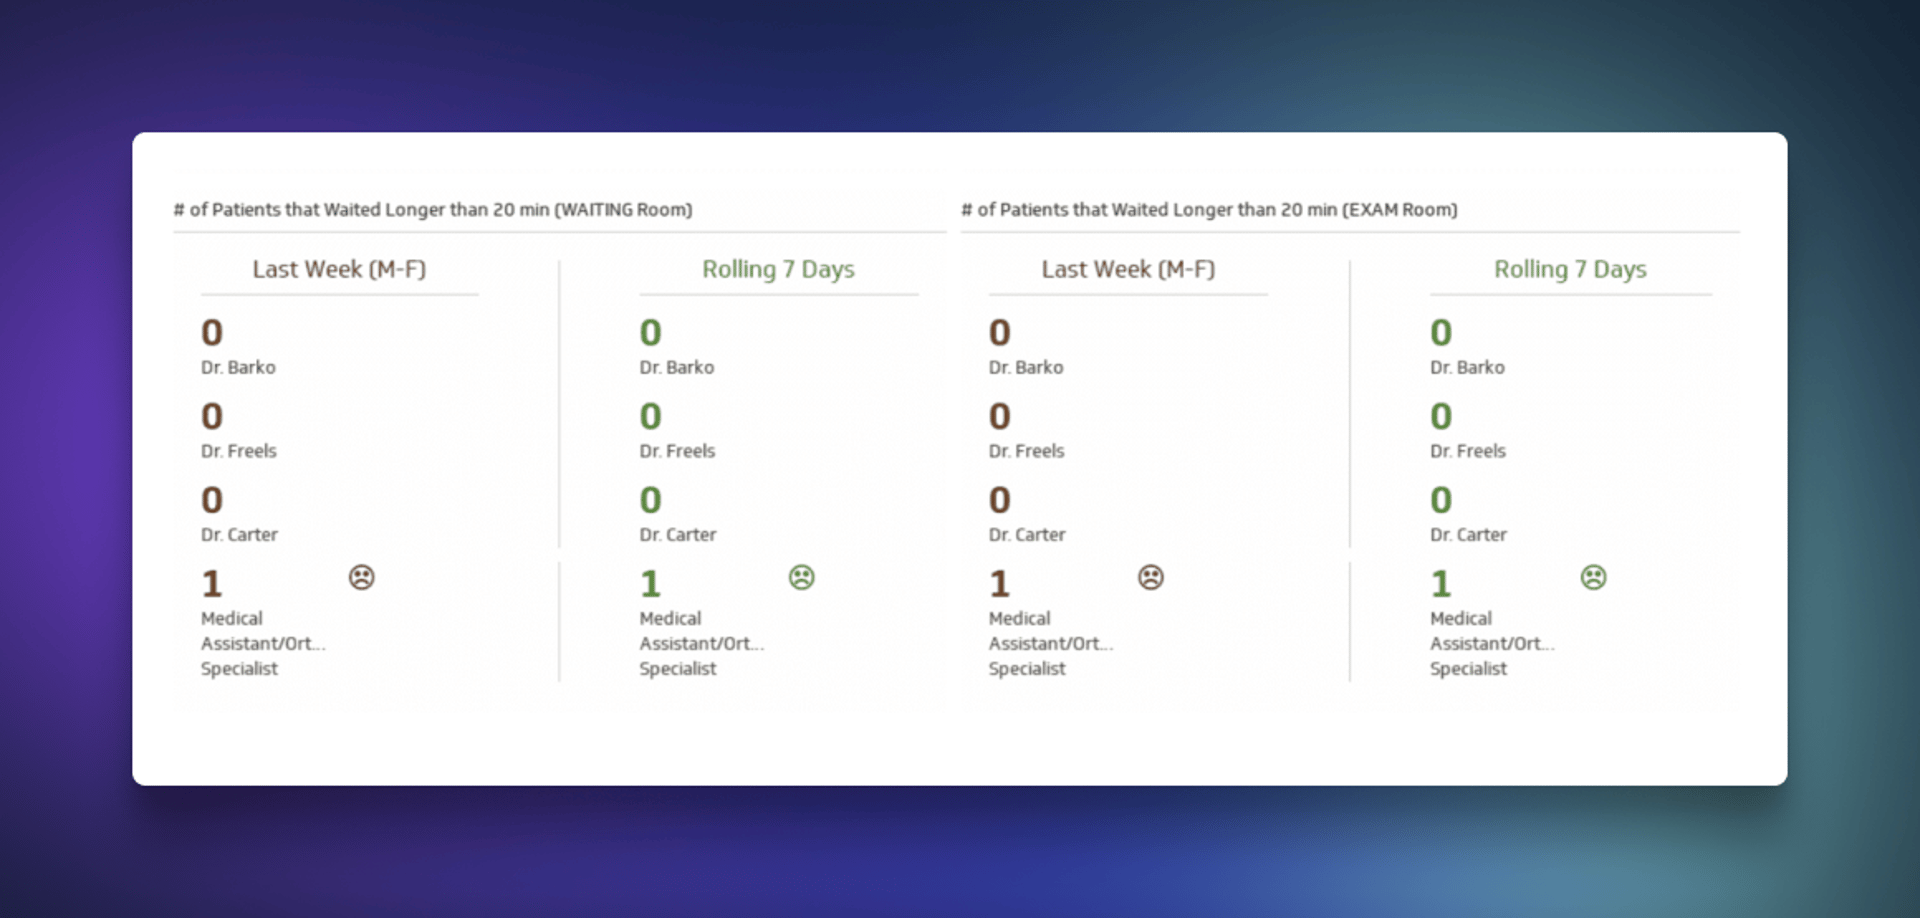
The survey results dashboard helped them look at trends over time. For example, the responses tell them if customers are dissatisfied with waiting times in the exam room. Lexington Podiatry can then pinpoint where the problem stems from and begin identifying solutions, such as adding more staff or cutting back on appointments when they are short-staffed due to vacation or a new person in training.
One of the problems the survey dashboard highlighted was the insufficiency of providers in comparison to appointments requested. Because surveys provided a near accurate measure of demand, Lexington Podiatry could add the appropriate number of staffers, keeping operations efficient while spending only necessary costs.
“At a glance I can ask myself, do I need to worry or not worry? Do I need to make an adjustment or not?”
Monitoring progress
Survey dashboards aren’t just helpful for diagnosing customer pain points — they also allow Lexington Podiatry to set customer satisfaction goals and measure progress.
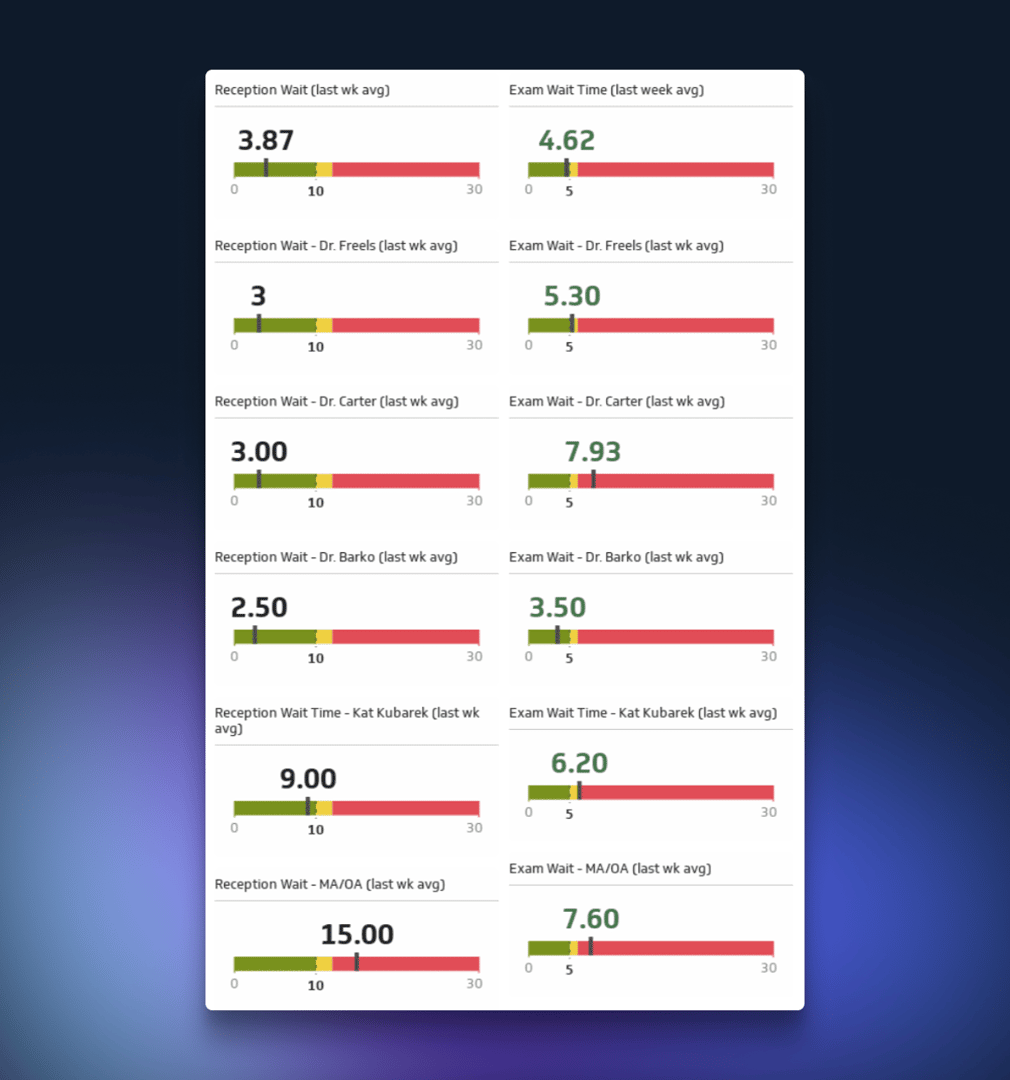
Every Tuesday, the administration team (doctors, providers, billing, IT, marketing, and HR) meets to review the survey results dashboard and discuss necessary pivots. In the example above, Lexington Podiatry measures each provider’s exam and reception wait times against assigned targets and national averages.
Although the national average for wait times is high, the practice assigns in-company “moonshot goals” that are reflected in their Klips. As shown in the image above, the company aims to reduce reception wait times to 10 minutes or less, but most providers achieve wait times of just 3-4 minutes. Making performance visible motivates all providers to put in their best efforts.
Measuring beyond customer satisfaction
In addition to the survey-results dashboard, Lexington Podiatry uses a separate visual dashboard to track financials such as expenses, collections, and to set new financial goals to ensure the practice remains profitable. The dashboard allows everyone from the top down to see the performance.
Lexington Podiatry improved patient satisfaction by 30%
How will you enhance your customer experience?

Make evidence-based decisions with Klips
As Lexington Podiatry showed, Klips are great for enhancing the customer experience. They create intuitive visualizations of data, helping you map out trends and diagnose issues at a glance. Having evidence makes it easier to generate solutions and increase performance efficiency.
Customer satisfaction is just one of the many metrics you can track with dashboard tools. The more data you collect, the easier it will be to understand what drives your company’s success. Social media dashboards, for example, can show you which platforms attract the most customers, while customer support dashboards illuminate the most common concerns customers raise.
Gather data to better understand what makes your company tick, apply these insights to your strategies, then visualize progress through dashboards.
Strength in numbers. And in stars.
We love what we do. And so do our customers.