Nakoa Saves 2 Hours Weekly Per Client Report With Klips Real-Time Dashboards
A global digital marketing agency turned fragmented channel data into live, client-ready dashboards. By adopting Klips, Nakoa consolidated reporting, moved faster on underperforming campaigns, and saved about two hours per client each week without adding headcount.

Marketing Agencies
Improved Margins
Data drives every campaign decision at Nakoa Digital, yet manual reporting slowed the team and limited how quickly clients could act. The agency replaced scattered spreadsheets and basic reports with Klips real-time dashboards. With live connections, wide connector coverage, and approachable design, Nakoa unified performance data, improved day-to-day monitoring, and reduced weekly reporting effort by roughly two hours per client.
Introducing Nakoa Digital
Nakoa is an international digital marketing agency based in Western Europe. The firm manages marketplace, retail, and digital marketing programs across global markets. After partnering with brands at different stages of growth, the founders saw the same pattern: strong ambitions, weak data foundations, and teams that struggled to translate channel metrics into a coherent strategy.
The challenge
Early reporting lived in Google Data Studio for Google data, with Excel and Google Sheets filling the gaps for non-Google channels. Campaigns ran on dozens, sometimes hundreds, of platforms, which meant constant exports, cleaning, and copy-pasting to get a single view. The team had the right instincts, but speed suffered. Data silos produced partial pictures, and weekly rollups demanded hours that could have gone to optimization and creative testing.
The solution: Klips real-time dashboards
Nakoa evaluated more powerful reporting options and chose Klips for its mix of connectivity, flexibility, and daily usability. The team connected cloud apps and databases alongside static files, then used Klips to combine sources and build the calculations they cared about, all in one place. Helpful support accelerated the first builds and removed roadblocks as the agency scaled to more clients and data sources.
“Klips drives employee engagement. Our dashboards keep us notified and allow us to act quickly when something is not performing well for a client. Simultaneously, we also use Klips for all of our client reporting. This way both us and the client are able to look at the same data and keep track of their performance in real-time.” Robin Prinsen, Co-founder, Nakoa

How Nakoa uses Klips
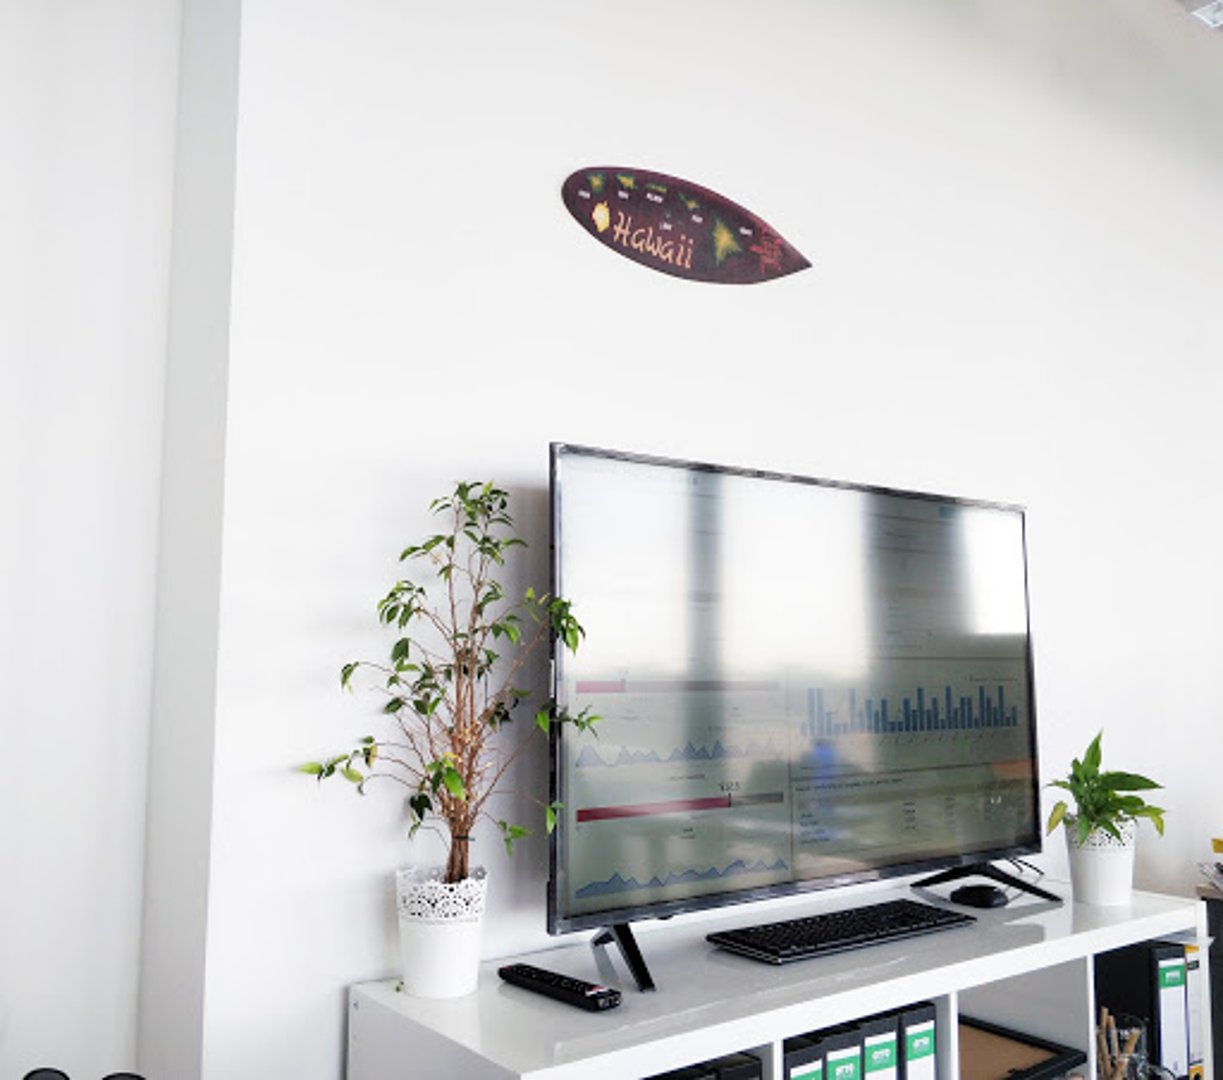
Dashboards serve two audiences. Inside the agency, rotating TVs and tablets display campaign and revenue views. Team members check dashboards on their mobile device when away from their desks, which keeps reaction time low when a channel slips. For clients, Nakoa builds tailored dashboards and shares them through secure links that can be displayed on office TVs, so leaders and marketers track the same story throughout the week. As Robin puts it, “In the office, we’re surrounded by data. When we’re on the go we’re never in the dark. We use the Klips on our phones to keep tabs on how our clients are doing.”

Metric coverage reflects each client’s business model, with their own agency operations in view as well. Internally, revenue per hour, previous day’s revenue, and same-day revenue versus last week and last year keep the team grounded. For marketing performance, dashboards highlight Marketing Qualified Leads (MQL), Sales Qualified Leads (SQL), funnel conversion rates, brand awareness, engagement, Spend per Customer, Return on Marketing Investment, Lifetime Value (LTV), Customer Acquisition Cost (CAC), and Retention.
Results
Klips’ live connections update dashboards automatically, which removed repetitive exports and reformatting. Nakoa now saves about two hours each week on every client report. The team spends that time reviewing outliers, testing ideas, and aligning with clients. Visibility also improved. Shared dashboards mean employees and clients look at the same, current numbers and act with confidence. Templates and sample dashboards speed up new builds, while flexible styling keeps each client’s presentation on brand.
“Since implementing Klips, we’re saving roughly two hours a week per client on reporting. Dashboards have helped us stay on top of our internal data and client performance, resulting in a much higher client retention rate.”
Why it works
The agency replaced manual stitching with always-on dashboards that consolidate data and surface patterns and trends. Wide data connector coverage, real-time refresh, and straightforward sharing let Nakoa deliver clear, timely reporting without heavy infrastructure. Employees respond faster, clients understand more, and both groups align on the same view of performance.

Klips helped Nakoa increase their margins.
You can too. Choose the best agency reporting solution today.

It's your move
If your team still compiles channel data by hand, the path forward is simple. Connect your services, define the metrics that matter, and publish a dashboard your team can trust. Klips helps you do this with hundreds of integrations, flexible calculations, mobile access, TV display, scheduled emails, and secure links. Agencies, consultancies, and in-house teams can all follow Nakoa’s approach and see similar gains in efficiency and profitability.
Strength in numbers. And in stars.
We love what we do. And so do our customers.


