Facelift Data Studio
Pull your Facelift Data Studio social metrics into Klipfolio Klips automatically. Connect via API, write a QQL query, and build dashboards that update on your schedule — no manual exports needed.
Track all your Facelift Data Studio KPIs in one place
Sign up for free and start making decisions for your business with confidence.
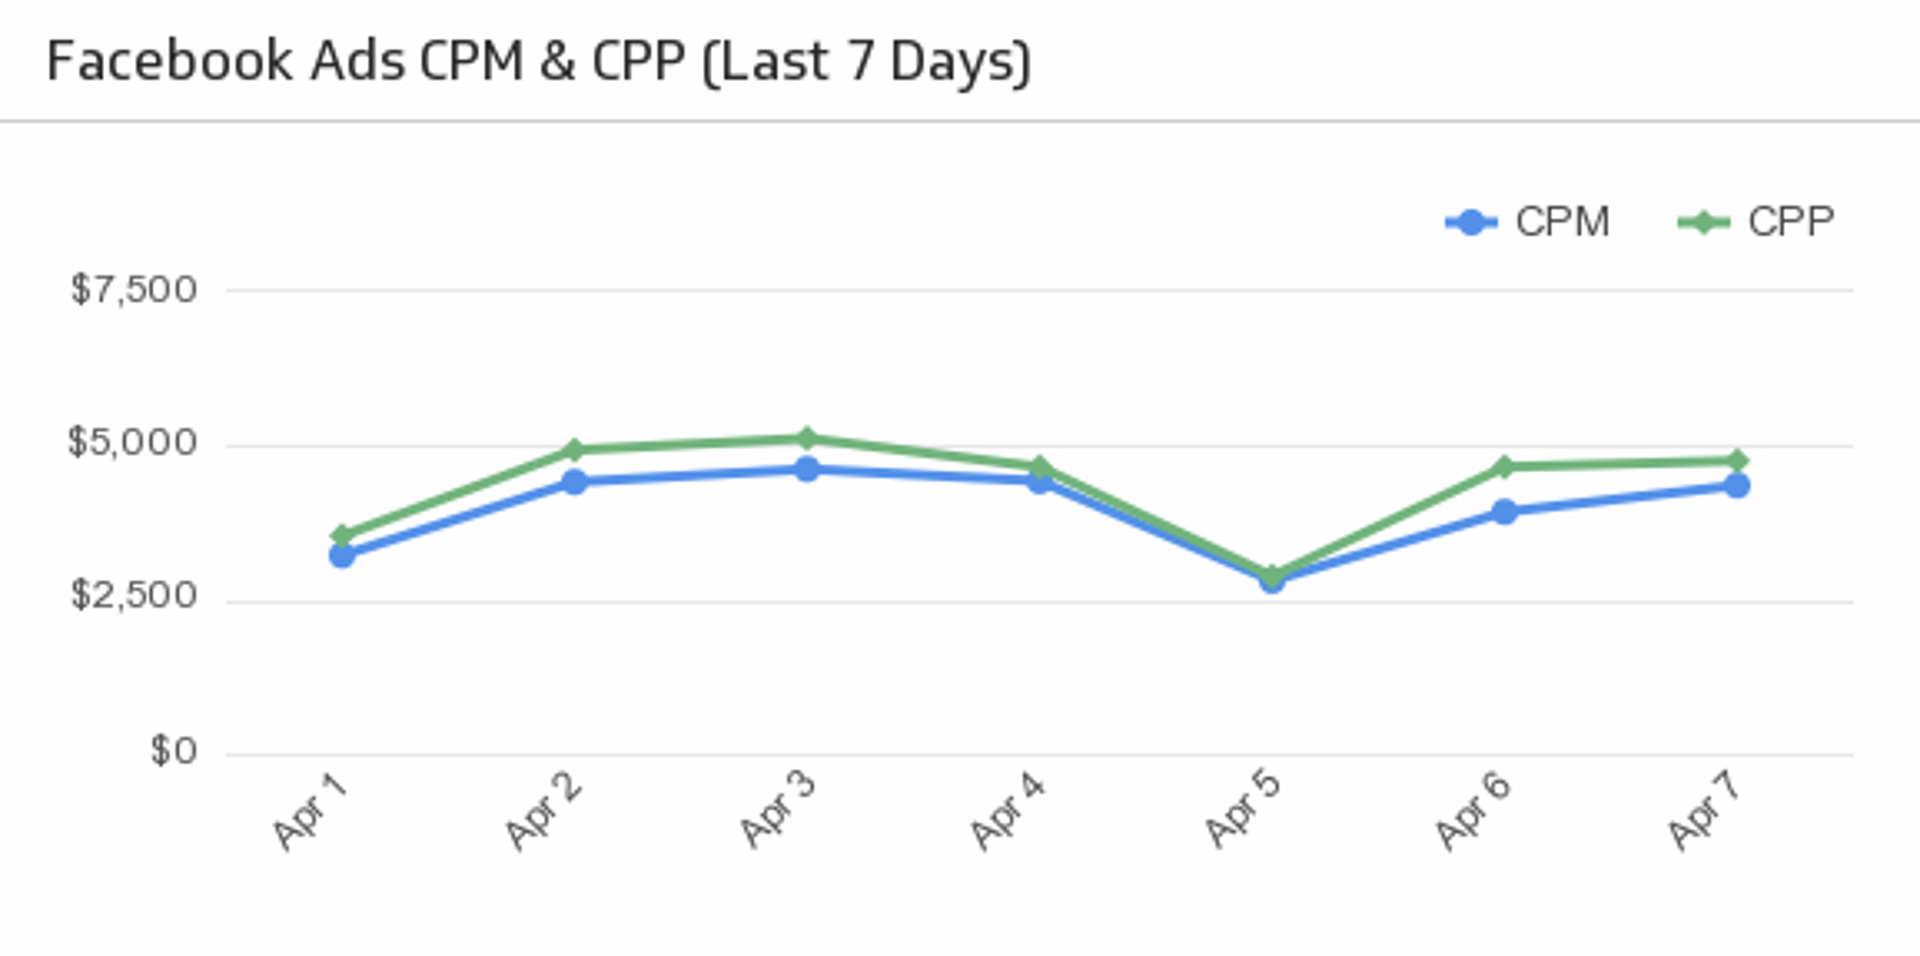
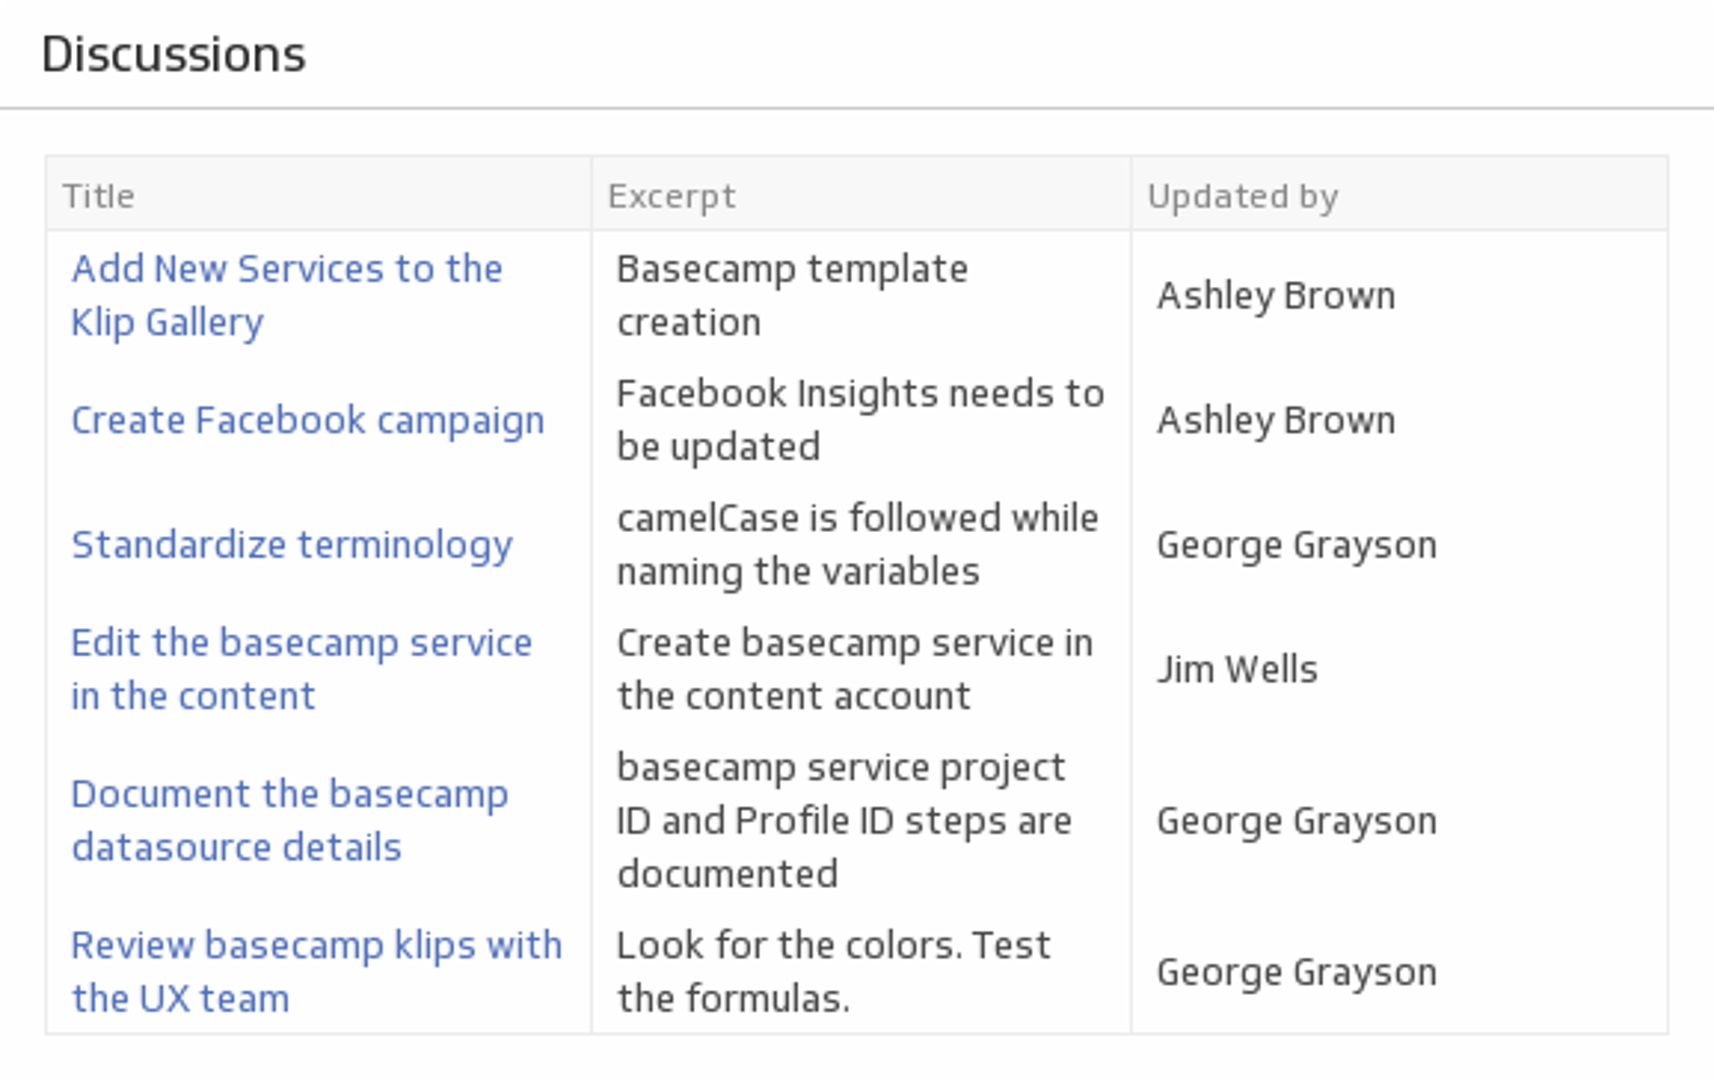
Pulling your social media data out of Facelift Data Studio manually takes time you don't have. Connect Facelift Data Studio to Klipfolio Klips and your dashboards update automatically — no exports, no copy-paste.
How to connect Facelift Data Studio to Klipfolio
This integration uses API credentials and a QQL query, making it a moderate setup. You'll need an active Facelift Data Studio account before you start.
- Go to the Service Connectors page in Klipfolio and select Facelift Data Studio.
- Email to request your Client ID and API Secret.
support@quintly.com
- Enter your Client ID and API Secret, then click Continue.
- Write your QQL query (see examples below) and paste it into the query field.
- Set Data Format to JSON and Method to GET, then click Get data.
- Confirm the returned data looks correct. Optionally, select Model your data to shape it before saving. Learn more about modelling data sources.
- Name your data source, choose a refresh schedule, and optionally share it with your team.
- Click Save.
View the step-by-step setup guide
Writing your Facelift Data Studio query
Klipfolio supports Quintly Query Language (QQL). You can find the QQL query for any metric directly in Facelift Data Studio: click the
?
For full API documentation, visit the Facelift Data Studio (Quintly) API reference.
Sample queries
List your profile IDs
https://api.quintly.com/v0.9/list-profiles
Fan count using a pre-defined metric
https://api.quintly.com/v0.9/qql?metric=fanCount&startTime=2013-08-01&endTime=2013-08-15&interval=daily&profileIds=13,14
Facebook fans by day (last 30 days)
https://api.quintly.com/v0.9/qql?qqlQuery=SELECT%20name%20AS%20pageName,%20profileID,%20time,%20fans%20FROM%20facebook%20INNER%20JOIN%20profiles%20ON%20facebook.profileId=profiles.id&startTime={date.add(-30).format()}&endTime={date.today}&interval=daily&profileIds=your-profile-id
Key Metrics Radar
https://api.quintly.com/v0.9/qql?qqlQuery=SELECT+profileId+AS+dim1%2C+fans%2C+name%2C+ownPosts%2C+%28ownPostsLikes%2BownPostsComments%2BownPostsShares%29+AS+interactions%2C+%28%28%28responseTime0To2h+%2B+responseTime2To8h+%2B+responseTime8To24h+%2B+responseTimeLongerThan24h%2A1.0%29%2F%28responseTime0To2h+%2B+responseTime2To8h+%2B+responseTime8To24h+%2B+responseTimeLongerThan24h+%2B+responseTimeNotResponded%2A1.0%29%29%2A100%29+AS+responseRate%2C+%28%28%28%28ownPostsLikes%2BownPostsComments%2BownPostsShares%2A1.0%29%2FownPosts%29%2F%28%28fansBefore%2Bfans%29%2F2%29%29%2A100%29%2A100%29+AS+interactionRate%2C+peopleTalkingAboutAverageRate%2C+%28%28%28%28fans-fansBefore%29%2A1.0%29%2FfansBefore%29%2A100%29+AS+fansChangeRate+FROM+facebook+INNER+JOIN+profiles+ON+facebook.profileId=profiles.id&startTime={date.add(-30).format()}&endTime={date.today}&interval=total&profileIds=your-profile-id
Top reasons to use Klipfolio for Facelift Data Studio dashboards
Automate your reporting cadence. Schedule data refreshes from 1 minute to 24 hours so your social metrics are always current without manual exports.
Combine social data with other sources. Pull in data from CRM, paid media, or web analytics alongside your Facelift Data Studio metrics for a complete performance view.
Build dashboards your stakeholders will actually use. Choose from 30+ visualization types and custom themes to present follower growth, engagement rates, and response times in a format that lands.
Share results your way. Distribute dashboards via TV mode, public links, scheduled PDF emails, or embedded views — no login required for viewers.
Model your data before it hits the dashboard. Use Klipfolio's built-in data modelling to clean, reshape, and filter your QQL results without touching the source.
What Klipfolio adds to your Facelift Data Studio workflow
| What you do in Facelift Data Studio | What Klipfolio adds |
|---|---|
| Manually export metric data as CSV | Automated dashboards that refresh on your schedule |
| View metrics one profile at a time | Combine multiple profiles and data sources in one view |
| Share screenshots or static reports | Live, shareable dashboards accessible via link or TV mode |
| Build queries in the metric editor | Visualize QQL results instantly across 30+ chart types |
Stop exporting data manually. Start building dashboards that keep your team aligned on social performance — automatically.
View the step-by-step setup guide
Use the Connector Gallery to create a custom Facelift Data Studio dashboard
With our Connector Gallery, you can create custom API queries to pull in data from your Facelift Data Studio account. Building custom queries allows you to specify the metrics and time periods that you want to track.
You can use custom queries to build out visualizations in Klipfolio. You can also combine your Facelift Data Studio data with other relevant data to create your custom dashboard.
Learn more about working with the Facelift Data Studio API and how you can start building your own Facelift Data Studio queries in Klipfolio.