
What are Dashboards and Scorecards? Key differences explained
Learn the difference between dashboards and scorecards, how each tracks business performance, and when to use both for smarter decisions.

Dashboards and scorecards serve the same fundamental purpose: turning business goals into visible, measurable progress. Understanding the difference helps you choose the right approach, or know when you need both.
What is a scorecard?
A scorecard is a structured performance tracking tool that connects individual metrics directly to strategic goals. It shows whether the right things are happening, not just what's happening.
Software scorecards trace back to the Balanced Scorecard framework developed at Harvard Business School. The approach works top-down: leadership identifies the key performance metrics that best signal progress toward strategic goals, then cascades those goals through the organization to the teams and individuals responsible for them. Every number on a scorecard ties to accountability. Someone owns it.
What is a dashboard?
A business dashboard is a real-time view of operational data, typically presented as charts, graphs, and gauges. The analogy to a car dashboard is intentional: you see what's happening right now, at a glance, without having to dig.
Dashboards evolved alongside enterprise software. ERP systems, web analytics platforms, and CRM tools all adopted dashboard interfaces because leaders needed a single view of fast-moving information. Dashboards are built for monitoring, not just reporting.
How scorecards and dashboards differ
| Scorecard | Dashboard | |
|---|---|---|
| Primary purpose | Track progress against strategic goals | Monitor real-time operational data |
| Time orientation | Periodic (weekly, monthly, quarterly) | Continuous or near real-time |
| Accountability | Tied to individuals or teams | Tied to systems or processes |
| Origin | Balanced Scorecard theory (Harvard) | Automotive and enterprise software UI |
| Best for | Executive strategy reviews | Day-to-day operational decisions |
Where scorecards and dashboards overlap
The line between the two has blurred, and for good reason. Modern business dashboards increasingly incorporate scorecard logic: strategic KPIs sit alongside operational metrics, and both update in real time.
What matters to a business leader isn't the label. It's whether the right people can look at the same number, understand what it means, and act on it immediately. A declining graph and a red scorecard metric both signal the same thing: something needs attention.
The real question isn't "scorecard or dashboard?" It's whether your system connects top-level goals to individual accountability and surfaces that information before it becomes a problem.
That's a harder standard than most spreadsheets or static reports can meet. Pasting numbers into a chat tool or waiting for someone to pull a weekly report means you're always reacting. The more useful version surfaces what matters without being asked.
Create custom dashboards for you and your team.
Get started with KlipsPutting scorecards and dashboards to work
Once you've decided what to measure, the next challenge is making sure the right people see it consistently, not just when they remember to check.
Klipfolio connects to 130+ data sources and puts your most important metrics in front of your team on any device, whether they're at their desk or on the move. Scheduled refreshes, TV mode, email delivery, and public links mean your numbers reach people, rather than waiting to be found.
If your data goes unnoticed, the work behind it doesn't matter. Try Klipfolio free and see how quickly you can get your team looking at the same numbers.
Updated 2026-09-08
Continue learning
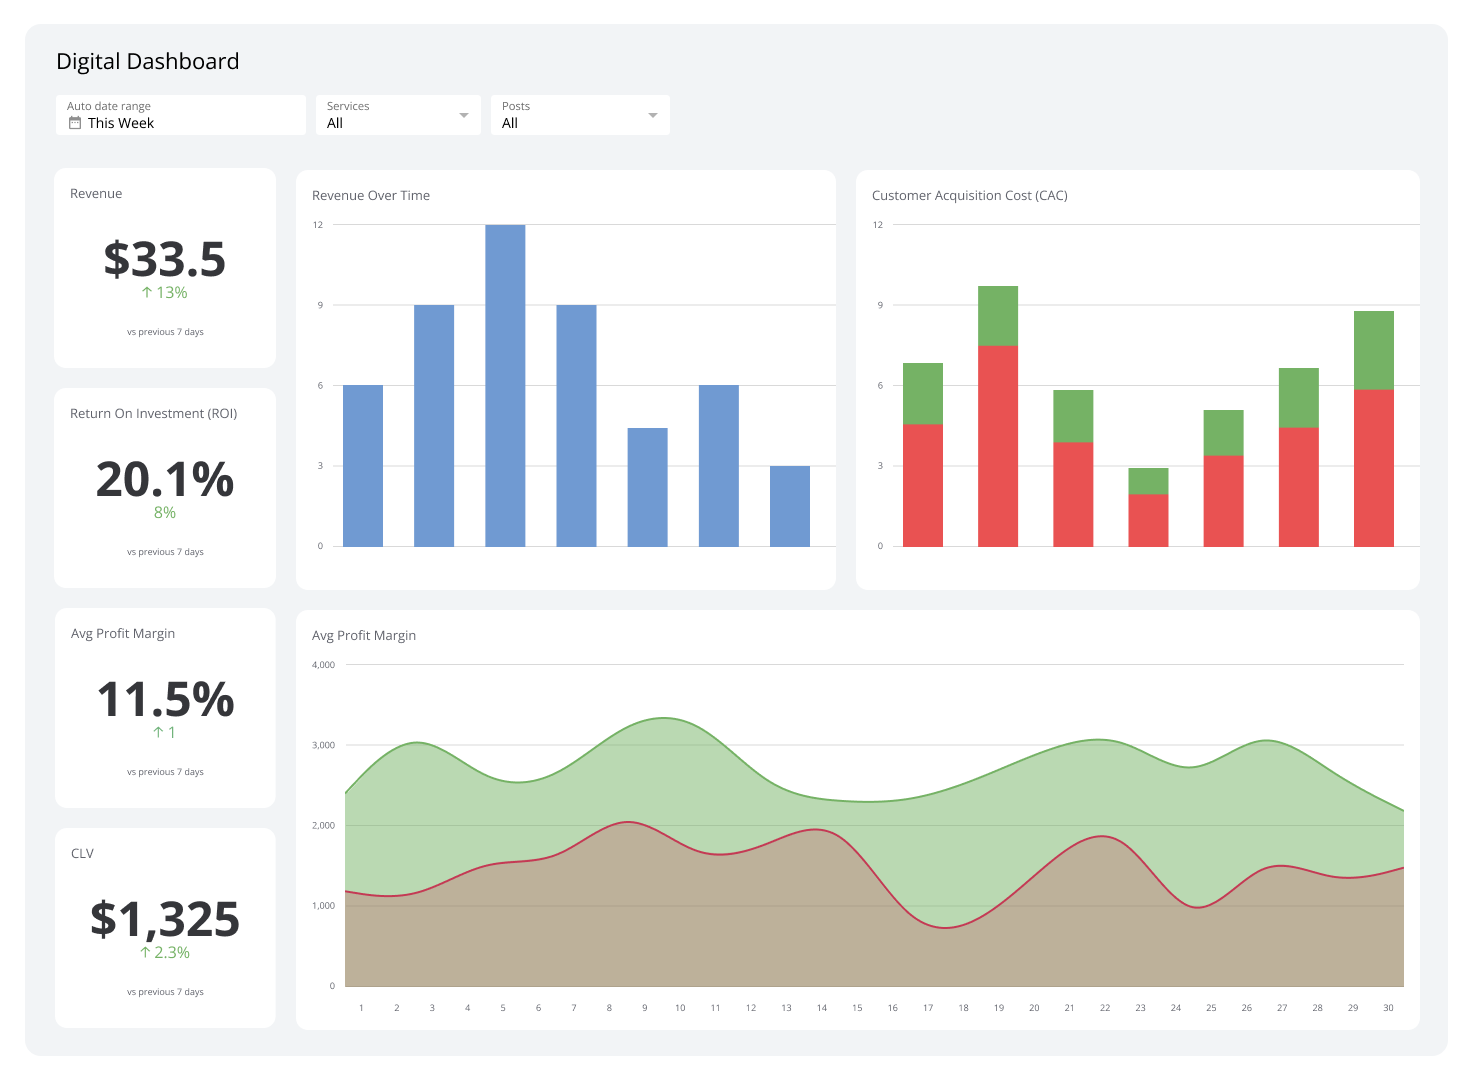
What Is a Dashboard? Types, benefits, and how to build one

What is a KPI? Types, limitations, and how to make KPIs work for your business
The consolidating stack: 3 years of SMB data connection trends

KPI dashboard: 10 guidelines for operational metrics

Cloud Business Intelligence: A Practical Guide to Smarter Reporting
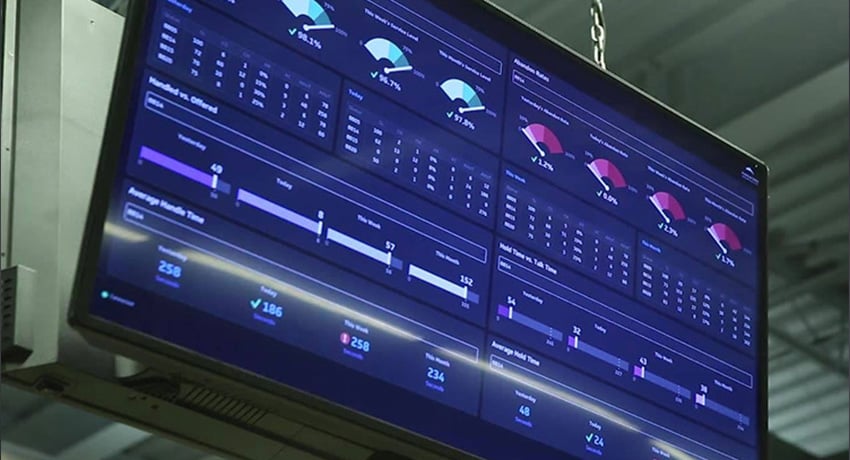
Best practices for TV and wallboard dashboards
Most recent
- SEP 2310 ways to automate Klips with the Klips API
- SEP 14Automate Klips: from repetitive tasks to managing reporting at scale
- AUG 20The consolidating stack: 3 years of SMB data connection trends
- MAY 28Dashboard Data Security and Privacy: A Five-Layer Framework
- MAR 30The CEO's guide to metrics that actually matter
- MAR 18What is a KPI? Types, limitations, and how to make KPIs work for your business