Current Ratio vs Quick Ratio
The Current Ratio and Quick Ratio both measure short-term liquidity, but the Quick Ratio excludes inventory for a more conservative view of a company's ability to pay its debts.
Current Ratio vs Quick Ratio
Current ratio and quick ratio both measure whether a company can pay its short-term debts, but they tell different stories about liquidity.
The current ratio includes all current assets, even inventory. The quick ratio strips out inventory and prepaid expenses to show only what can be converted to cash immediately. Knowing which ratio to use, and when, gives you more confidence in the financial picture you're looking at.
What are financial ratios?
A financial ratio is a calculated comparison between two numbers from a company's financial statements. Ratios help you evaluate performance, spot trends, and benchmark against competitors, without needing to read every line of a balance sheet.
Liquidity ratios, like the Current Ratio and Quick Ratio, focus specifically on whether a company can cover its short-term obligations. They're among the first metrics analysts, creditors, and investors check when assessing financial stability.
What is the Current Ratio?
The Current Ratio measures a company's ability to pay all short-term obligations due within one year using all of its current assets.
Current Ratio = Current Assets / Current Liabilities
Current assets include: cash, marketable securities, accounts receivable, inventory, and prepaid expenses.
Current liabilities include: accounts payable, short-term debt, and taxes payable.
How to read the Current Ratio
- Above 1: The company has more current assets than current liabilities. It can cover its debts comfortably.
- Below 1: The company has more liabilities than assets. It may struggle to meet short-term obligations.
- Equal to 1: Assets and liabilities are balanced, manageable, but with little buffer.
A ratio of 1.5 to 2.0 is often considered healthy, though the right benchmark varies by industry. Retailers and manufacturers typically carry more inventory, which naturally inflates the Current Ratio without necessarily reflecting strong cash availability.
The Current Ratio is also called the working capital ratio because it reflects how much working capital a company has available.
Current Ratio example
A company has $500,000 in current assets and $250,000 in current liabilities.
Current Ratio = $500,000 / $250,000 = 2.0
This means the company has $2 in current assets for every $1 of short-term debt, a comfortable liquidity position on paper. Whether it translates to real cash availability depends on what those assets actually are.
What is the Quick Ratio?
The Quick Ratio measures a company's ability to pay short-term obligations using only its most liquid assets: those that can be converted to cash quickly, without selling inventory.
Quick Ratio = (Cash + Marketable Securities + Accounts Receivable) / Current Liabilities
You may also see it written as:
Quick Ratio = (Current Assets - Inventory - Prepaid Expenses) / Current Liabilities
Both formulas produce the same result. The Quick Ratio is also called the acid-test ratio, a nod to the old method of testing gold with acid to confirm its purity. Only genuine liquidity survives the test.
How to read the Quick Ratio
- Above 1: The company can meet its current liabilities without touching inventory.
- Below 1: The company may need to sell inventory or find other financing to cover short-term debts.
A Quick Ratio of 1.0 or higher is generally considered sound. Like the Current Ratio, the ideal threshold depends on industry norms and business model.
Quick Ratio example
The same company has $500,000 in current assets, but $150,000 of that is inventory and $50,000 is prepaid expenses.
Quick Assets = $500,000 - $150,000 - $50,000 = $300,000
Quick Ratio = $300,000 / $250,000 = 1.2
The Quick Ratio drops from 2.0 to 1.2 once illiquid assets are removed. That gap is worth paying attention to: it tells you how much of the company's apparent liquidity depends on assets that can't be turned into cash quickly.
Create custom dashboards for you and your team.
Get started with KlipsCurrent Ratio vs Quick Ratio: key differences
Both ratios measure liquidity, but they answer slightly different questions. Here's how they compare:
| Factor | Current Ratio | Quick Ratio |
|---|---|---|
| Assets included | All current assets | Cash, marketable securities, accounts receivable only |
| Inventory included? | Yes | No |
| Prepaid expenses included? | Yes | No |
| Conservatism | Less conservative | More conservative |
| Best for | General liquidity overview | Immediate cash availability |
| Also known as | Working capital ratio | Acid-test ratio |
Why the difference matters
Inventory is a current asset, but it isn't always easy to convert to cash quickly. A retailer might hold months of stock. A manufacturer might have raw materials that need processing before they can be sold. In these cases, the Current Ratio can look healthy while the company actually struggles to meet immediate obligations.
The Quick Ratio removes that ambiguity. It answers a sharper question: if the company had to pay all its short-term debts right now, could it? That's the number a creditor, investor, or executive wants when they're assessing real financial risk, not just reported asset totals.
When to use the Current Ratio vs Quick Ratio
Neither ratio is universally better. The right choice depends on what you're trying to understand.
Use the Current Ratio when:
- Assessing overall working capital. The Current Ratio gives a broad view of whether a company has enough resources to fund its operations and cover short-term debts.
- Evaluating inventory-heavy businesses. For companies where inventory turns over quickly and predictably, such as grocery chains, inventory is a legitimate liquid asset and belongs in the calculation.
- Comparing companies within the same industry. When industry norms are consistent, the Current Ratio provides a reliable baseline for comparison.
Use the Quick Ratio when:
- Evaluating immediate liquidity. If you need to know whether a company can pay its bills today, the Quick Ratio is more informative.
- Analysing companies with slow-moving inventory. Construction firms, manufacturers, and specialty retailers often hold inventory that takes months to convert to cash. The Quick Ratio gives a more realistic picture.
- Assessing financial risk. Creditors and lenders often prefer the Quick Ratio because it reflects worst-case liquidity: what's available if inventory can't be sold.
Industry examples
Retail: A clothing retailer with high inventory turnover may show a healthy Current Ratio and a lower Quick Ratio. If inventory moves reliably, the Current Ratio is a fair representation of liquidity. If inventory is seasonal or slow-moving, the Quick Ratio is more relevant.
Software or professional services: These companies carry little to no inventory. Their Current Ratio and Quick Ratio are often nearly identical, making either metric suitable.
Construction or manufacturing: These businesses hold large amounts of inventory and work-in-progress assets. The Quick Ratio is the more conservative and informative measure.
Limitations of Current Ratio and Quick Ratio
Liquidity ratios are useful, but they have real constraints. Keep these in mind when drawing conclusions.
- Static snapshot. Both ratios reflect a single point in time. A company's liquidity can shift significantly from one quarter to the next, especially in seasonal businesses.
- No forward-looking view. Neither ratio accounts for future cash flows, upcoming contracts, or long-term obligations. A company might look liquid today but face serious cash shortfalls in three months.
- Accounting differences. Inventory valuation methods (FIFO vs. LIFO, for example) affect the numbers. Comparing ratios across companies using different accounting practices can be misleading.
- Industry variation. A Current Ratio of 1.2 might be strong in one industry and weak in another. Always compare ratios against industry benchmarks, not just absolute thresholds.
These constraints are also why a one-time calculation rarely tells the full story. A number that looks fine in isolation can hide a trend that only becomes visible when you track the ratio over time.
Supplementary ratios to consider
Pair the Current Ratio and Quick Ratio with these metrics for a more complete picture:
- Cash ratio: The most conservative liquidity measure, using only cash and cash equivalents.
- Inventory turnover ratio: Shows how quickly a company sells and replaces inventory, which affects how reliable inventory is as a current asset.
- Debt-to-equity ratio: Reveals how a company is financed and how much leverage it carries.
- Operating cash flow ratio: Compares operating cash flow to current liabilities for a dynamic view of liquidity.
No single financial metric tells the full story. Using multiple ratios together gives you a more reliable view of a company's financial health.
Tracking liquidity ratios on a dashboard
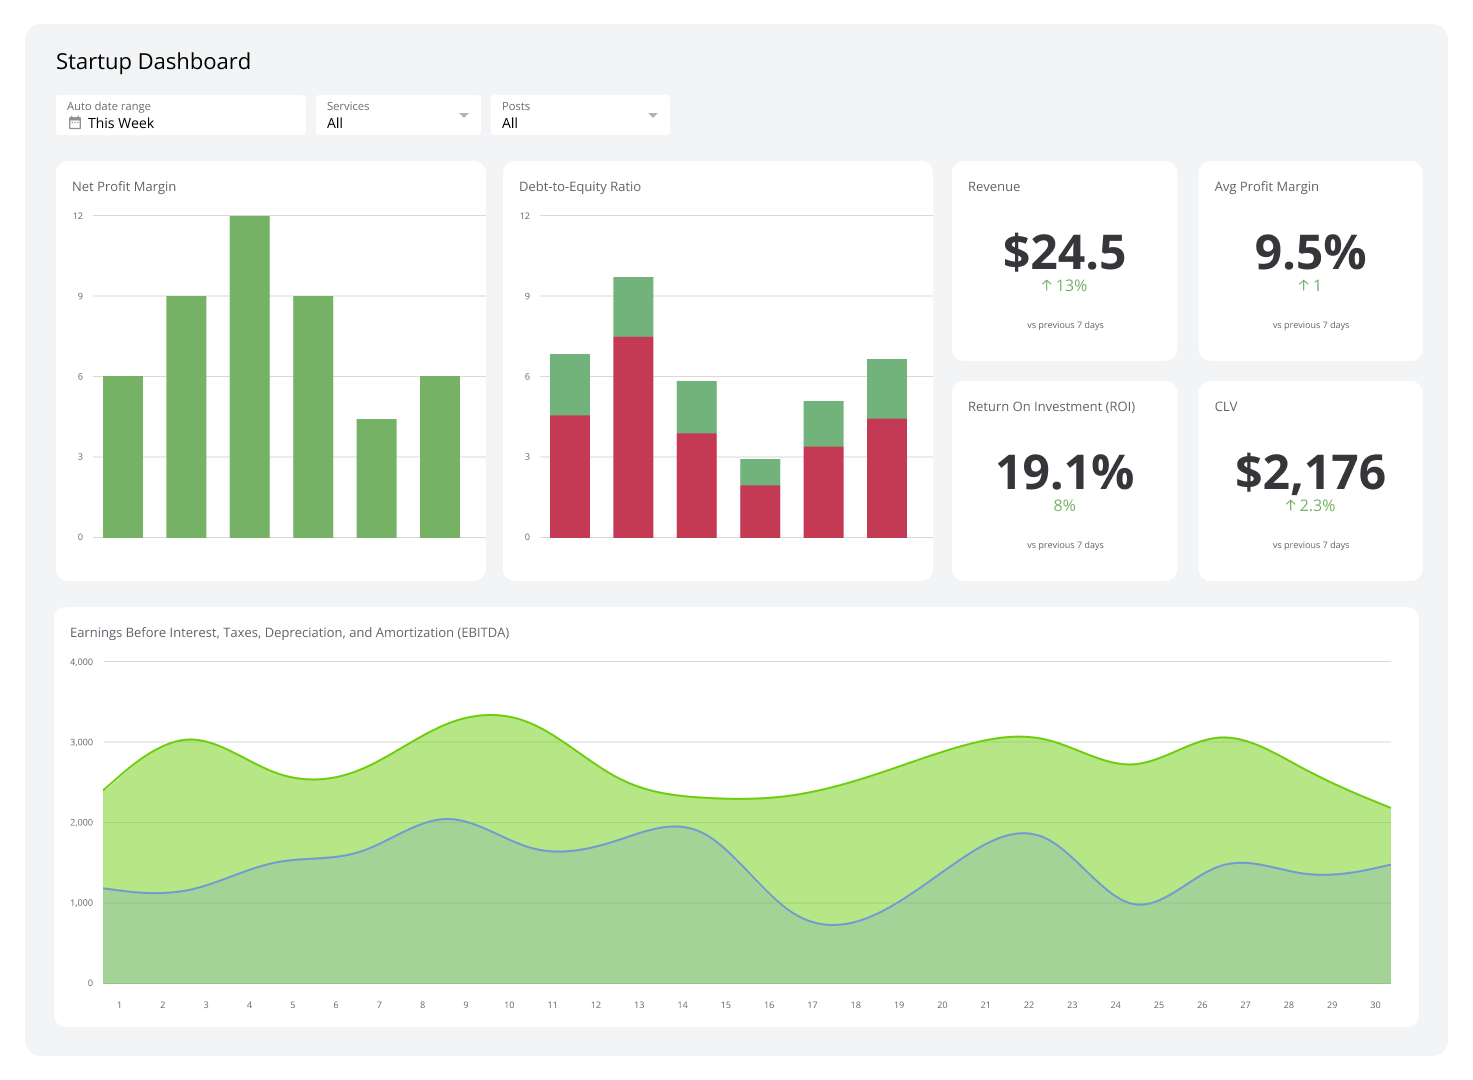
Monitoring the Current Ratio and Quick Ratio over time, not just at a single point, reveals trends that a one-time calculation misses. A declining Quick Ratio over several quarters may signal growing inventory problems or deteriorating receivables, even if the Current Ratio appears stable.
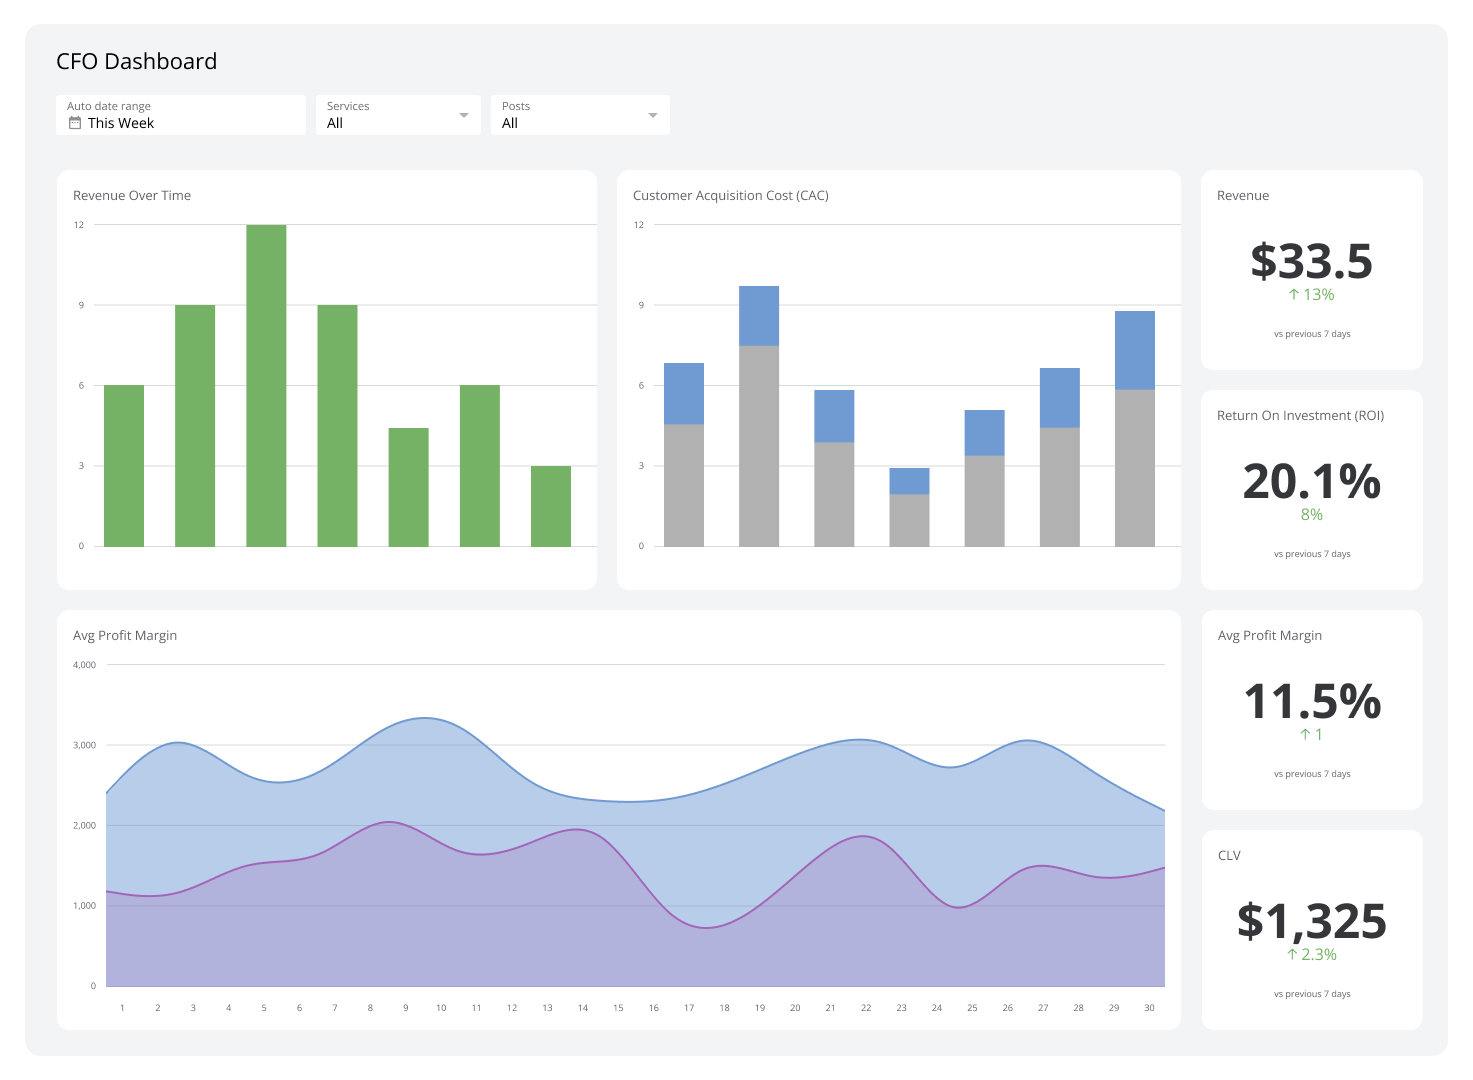
A financial dashboard that pulls balance sheet data automatically lets you track both ratios in real time, compare them against targets, and share the view with your team. Instead of waiting for someone to pull a number or pasting figures into a spreadsheet every quarter, you get a consistent, always-current picture of where the business stands. Klips connects to your data sources and keeps your liquidity metrics updated without manual work.
Choosing the right ratio for your analysis
The Current Ratio gives a broad view of liquidity. The Quick Ratio gives a sharper, more conservative one. Use both together to understand not just whether a company can pay its debts, but how easily it can do so, and with what.
For companies with predictable, fast-moving inventory, the Current Ratio is a fair measure. For companies where inventory is slow, seasonal, or uncertain, the Quick Ratio is more reliable. When in doubt, calculate both. The gap between them often tells you as much as either ratio alone.