Serviceable Addressable Market (SAM)
SAM defines the portion of your total market you can realistically reach — and knowing it helps you focus resources, set revenue targets, and make confident investment decisions.
Serviceable Addressable Market
Serviceable Addressable Market (SAM) is the portion of the Total Addressable Market your business can realistically reach given your model, geography, and resources.
You can't chase every customer in every market. SAM draws a boundary around the ones you can actually serve, so you know where to focus and how much revenue is within reach. That clarity matters whether you're pitching to investors, planning a product launch, or deciding where to expand next. And it's the difference between confident decisions and guesswork dressed up as strategy.
What is Serviceable Addressable Market (SAM)?
SAM is the segment of the Total Addressable Market (TAM) a business can target with its current products, pricing, and distribution. It excludes markets that are geographically, technically, or competitively out of reach.
How SAM fits with TAM and SOM
SAM doesn't exist in isolation. It sits between two related market sizing metrics: Total Addressable Market (TAM) and Serviceable Obtainable Market (SOM).
Think of them as three nested circles:
- TAM is the entire market demand for a product or service, assuming no competition and no constraints. It sets the ceiling on total revenue potential.
- SAM is the slice of TAM your business model can actually reach, given your location, product fit, and target customer profile.
- SOM is the realistic share of SAM you can win in the near term, accounting for competition and limited resources.
A fast food chain illustrates this well. TAM is the global fast food market. SAM is the market in the cities where the chain operates. SOM is the share of those local markets the chain can realistically capture against existing competitors.
How to calculate SAM
There are two standard approaches: top-down and bottom-up. Both are valid; the right choice depends on the data available.
Top-down approach
Start with the total market size, then narrow it down using filters that reflect your actual reach. Relevant filters include:
- Geographic coverage: which regions or cities you serve
- Customer demographics: age, income, industry, company size
- Product fit: which customer segments your product actually solves for
- Regulatory or distribution constraints: licensing, shipping limits, language support
If TAM for cloud accounting software is $50 billion globally, and your product targets small businesses in North America, you'd apply the share of that market matching those criteria to estimate SAM.
Bottom-up approach
Build the estimate from first principles using data you already have:
SAM = (Number of addressable customers) × (Average annual revenue per customer)
For example: if there are 200,000 businesses in your target segment and your average contract value is $2,400 per year, your SAM is $480 million.
Bottom-up estimates tend to be more defensible with investors because they're grounded in real unit economics rather than macro assumptions. They also give you a number you can actually act on, because every input maps to something you control.
Why SAM matters
Knowing your SAM tells you how large a prize you're actually competing for. That has direct consequences for planning and decision-making.
For investors, SAM answers the question: "Is this market big enough to justify the investment?" A business targeting a $10 million SAM has a hard ceiling on returns. A $2 billion SAM signals meaningful upside.
For leadership teams, SAM focuses resource allocation. Instead of spreading budget across every possible customer, you concentrate on the segment most likely to convert and generate revenue. That's the difference between a team that feels stretched and one that knows exactly where to push.
For go-to-market planning, SAM defines the boundaries of your sales and marketing effort. It tells you how many customers exist, where they are, and what they're worth.
Without a clear SAM, it's easy to either overestimate opportunity (and overspend chasing customers you can't serve) or underestimate it (and leave revenue on the table).
Create custom dashboards for you and your team.
Get started with KlipsFactors that shape your SAM
Several variables determine how large or small your SAM is. Reviewing these regularly keeps your estimate accurate as your business evolves.
Geography
Where your business operates is often the most immediate constraint. A regional service provider, a business with limited shipping infrastructure, or a company without multilingual support all face geographic limits on who they can serve.
Demographics and customer profile
SAM narrows further when you define who your product is actually built for. Age, income, industry, company size, and buying behaviour all filter the broader population down to a realistic target segment. A B2B SaaS product priced for mid-market companies isn't competing for enterprise procurement budgets or freelancer spending.
Product fit and positioning
Your product's capabilities determine which customer problems it solves. If your product addresses a specific workflow or industry pain point, your SAM is bounded by how many customers share that problem and are willing to pay to solve it.
Competition
Existing competitors hold market share you'd need to displace. A market dominated by well-resourced incumbents effectively reduces your accessible SAM, at least in the short term. Understanding competitive concentration helps you identify underserved pockets where you have a realistic path to winning.
Economic conditions
Purchasing power, industry growth rates, and broader economic trends affect how much of a market is actively spending. A SAM calculated during a growth cycle may need revisiting during a contraction.
SAM examples
Childcare services: A new childcare provider entering a city calculates SAM by identifying the number of families with young children in the area who are actively seeking care and can afford the service. The broader TAM might be national demand for childcare, but SAM is local and specific.
B2B software: A project management tool built for construction firms has a TAM that includes all project management software buyers. Its SAM is the subset of construction companies in its target geographies with the team size and budget to use the product.
Specialty retail: A premium cycling retailer's TAM is the total sporting goods market. Its SAM is the segment of cycling enthusiasts within its distribution reach who buy at its price point.
Create custom dashboards for you and your team.
Get started with KlipsHow to use SAM strategically
SAM is most valuable when it informs decisions, not just slides.
Prioritize your highest-value segments. If your SAM analysis reveals that one customer profile generates three times the revenue of another, that's where sales and marketing effort should concentrate. You'll convert more customers and spend less doing it.
Set realistic revenue targets. SAM gives you a ceiling. If your SAM is $500 million and you're targeting 5% market share in year three, that's a $25 million revenue goal grounded in market reality rather than guesswork. That's a number you can build a plan around.
Identify expansion opportunities. As your product capabilities grow or you enter new regions, your SAM expands. Tracking SAM over time shows whether you're growing into new addressable markets or just taking share within the same one.
Sharpen investor conversations. Investors want to know the market is large enough to matter and focused enough to be winnable. A well-defined SAM, supported by a credible bottom-up calculation, answers both questions directly. See how leading SaaS startups frame this in their investor pitch decks.
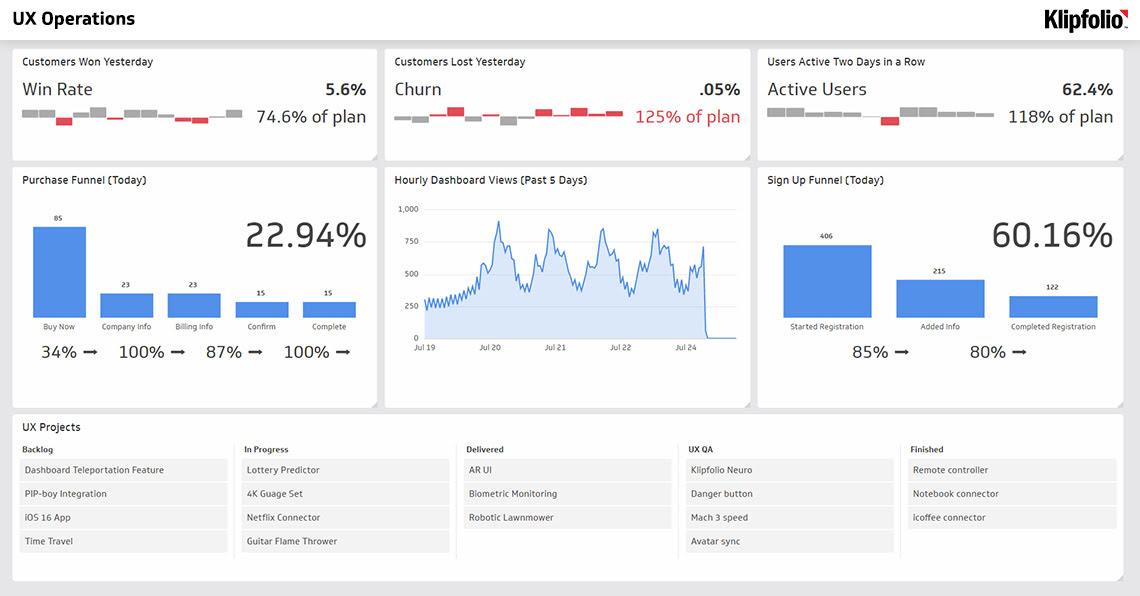
When SAM, TAM, and SOM are visible in a shared dashboard alongside your actual revenue numbers, the conversation shifts from "how big is the market?" to "how much of it are we capturing, and where do we move next?" That's the question worth spending time on.