

Summary - Modern CMOs use many marketing tools. Learn a simple 5-step approach to get your own CMO control centre up and running.
As a modern Chief Marketing Officer (CMO), you use all kinds of marketing technology and online tools. The average marketer uses around 90 cloud tools (source: chiefmartech.com) in a typical stack.
The marketing landscape changes fast and the focus on data is enormous. That calls for a clear strategy and tactical plans, which turn into long lists of daily to-dos. Teams are familiar with lists in Asana, Notion, ClickUp, or Trello.
CMOs manage a lot. A CMO dashboard helps present priorities in a way that is easy to digest. By making project data available to stakeholders in real time, you can save precious time otherwise spent building weekly and monthly reports.
Read on for a simple 5-step approach to get your own CMO control centre running.
Step 1: Define your core KPIs
From Google Analytics and Ads to SEO and email marketing, each tool provides multiple indicators. With so much data available, it is easy to lose sight of what really matters.
To select the figures that matter most, first analyze your marketing and organizational goals. These are different for every business and usually defined at the C-level.
Next, set up a meeting with the teams responsible for the projects and define 4 to 6 key performance indicators to measure success. KPI stands for Key Performance Indicator (KPI), a measurable value that demonstrates how effectively a company is achieving key business objectives. Organizations use KPIs to evaluate their success at reaching targets.
Examples of KPIs to consider include:
- Number of Marketing and Sales Qualified Leads (MQL and SQL)
- Number of downloads or trials
- Conversion rate
- Top-performing content on your website
- Number of website visitors
- Number of keywords ranking on the first page of Google
- Online revenue
- Top-of-funnel leads or number of email subscribers
When you have defined your top KPIs, set monthly, quarterly, and yearly targets. That lets you track goals, month-to-date results, and gap.
Step 2: Choose your data sources and tools
Once you have defined your KPIs, identify the data sources that will supply the relevant figures. For marketers, common sources include:
- CRM, like Salesforce, Microsoft Dynamics, Pipedrive, or NetSuite
- Marketing automation platforms, like Marketo, HubSpot, or Eloqua
- Email platforms, like Mailchimp, Klaviyo, or Campaign Monitor
- Google Ads (mainly conversions)
- Google Analytics
- Google Search Console
- SEO monitoring tools, like SEMrush or Ahrefs
These tools provide APIs or export options to pull data automatically. Focus on the KPI plan first, then connect the sources that support it.
Step 3: Run a weekly tactical meeting with the right team
A good online marketing approach needs a clear strategy and people who can define tactical measures based on relevant data. Because data is available in real time, review tactics weekly to avoid falling behind. In the past, actions were based on monthly or quarterly reports. Now you can act faster.
It is key to assemble a team with the tools and expertise to mine the data and suggest or take appropriate measures. These teams usually include the CMO, marketing automation managers, online marketing consultants, and lead generation and conversion specialists from agencies.
Once tactics are defined, they will result in to-dos for the marketing department, external agencies, and consultants who help in specific areas. These teams can work together in collaboration tools like Trello, Notion, or Asana. These tools enable you to define tasks, owners, and due dates.
Step 4: Visualize your data in a dashboard
The data from steps 1 to 3 can be visualized in a real-time dashboard, like Klipfolio Klips. This positions you as a CMO to keep essential data in one place and gain insight into:
- Top 5 to 7 KPIs
- Weekly key tactics and strategies
- Daily to-dos
To display your data, Klipfolio Klips offers hundreds of integrations through APIs and pre-built Klips. You can build the dashboard yourself or work with a Klipfolio Partner who can build it for you, like Marketing Guys.
Step 5: Make your dashboard visible and communicate results
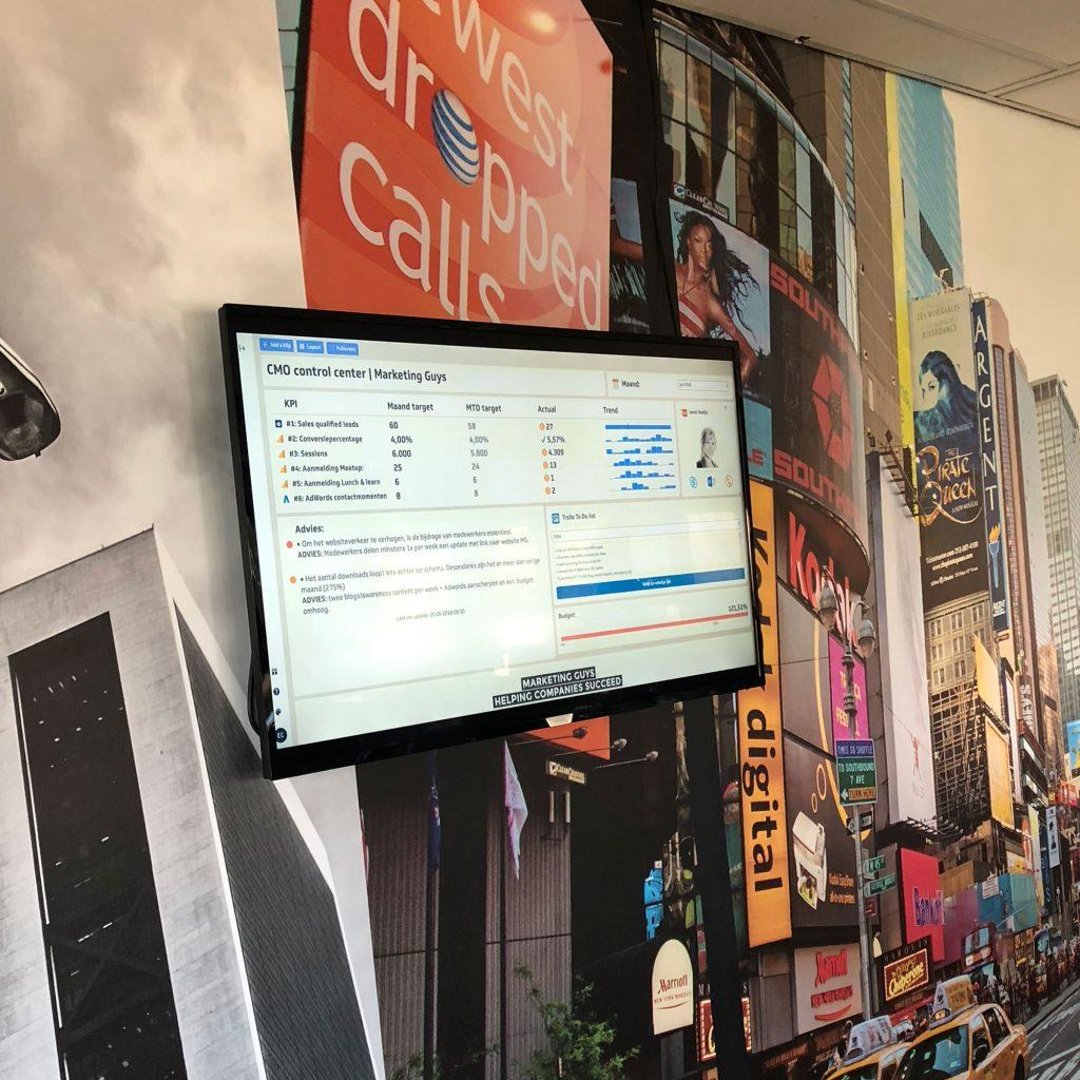
The last step is making your dashboard visible to the marketing department. It is easy to connect a Chromebox to an Wallboard TV and stream the dashboard in real time. Data transparency fosters a data-driven mindset across the team. Results-driven marketing is the aim.
Marketing Guys keeps its CMO Control Center always on:
Tip:
Your CMO dashboard shows the data that matters to you as the CMO. Sometimes you need to dig into the details behind each KPI. In that case, build additional dashboards by focus area, such as a lead generation dashboard, an SEO or paid search dashboard, or an automation dashboard. Make these dashboards accessible from your primary CMO dashboard.
This blog was written by Elias Crum, founder and CEO of Marketing Guys, a data-driven online marketing agency based in the Netherlands. Elias is a marketing technology specialist, host of the Marketing Technology Podcast, and organizer of Marketing Technology Day.
Related Articles
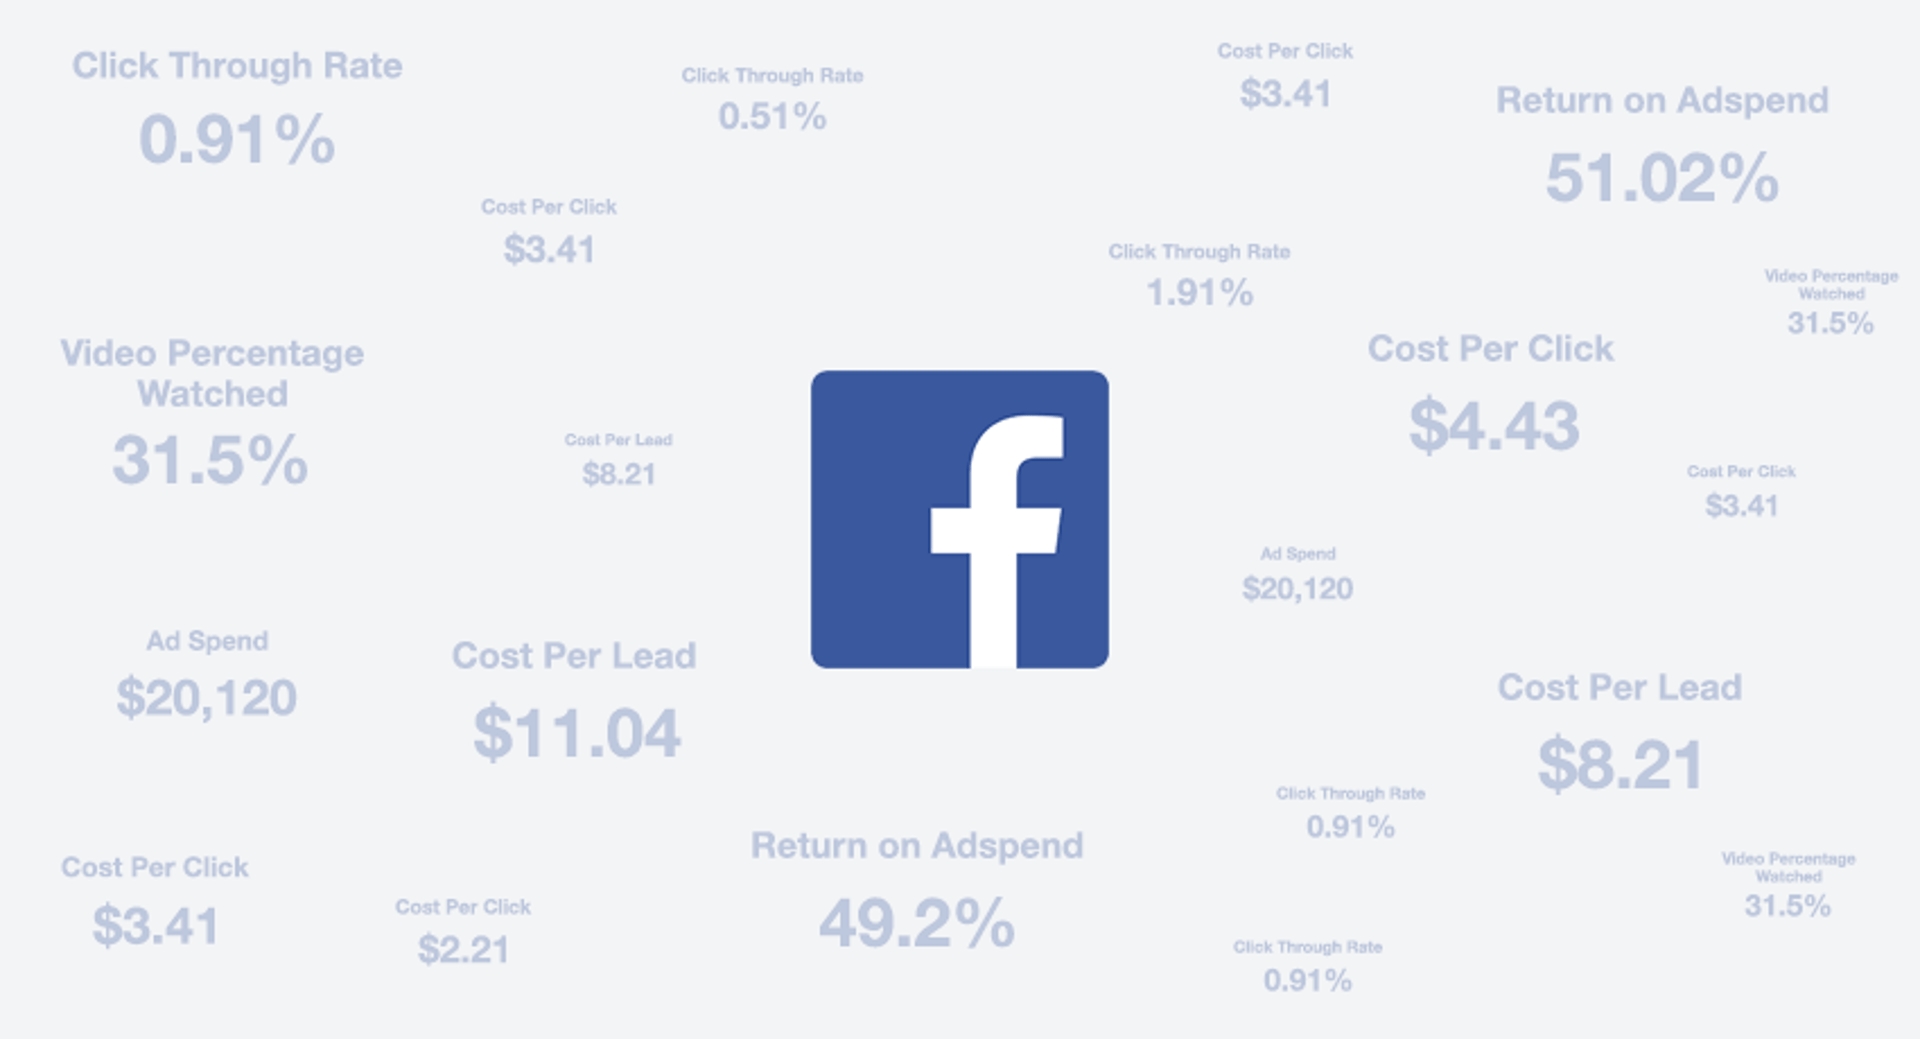
6 Facebook ads reports every agency needs to attract and retain high-ticket clients
By Tanya Brody — April 10th, 2026
6 dashboards I use daily to run my SaaS company
By Allan Wille, Co-Founder — April 10th, 2026
Business Metrics vs. KPIs: What’s the Difference?
By Jonathan Taylor — March 13th, 2026
