
Summary - How do dashboards help agile software development teams? By tracking your metrics and processes for agile software development.
A few weeks ago I came across this great blog post on building an agile sprint planning system by Karl Hughes. Karl is the head of engineering at Packback and has spent the last several years in edtech startups. It turns out that Karl and team have integrated Klipfolio into their process helping them solve a number of problems.
It’s always great to see people work successfully with the product we are building at Klipfolio. But this case in particular is even more interesting to me personally because they are using Klipfolio to track agile software development metrics and processes - topics I am passionate about and that I deal with day-in-day-out and even write about. So I decided to reach out to Karl and do a quick interview with him. Before we get to that though, let me explain the core problem that most agile software development teams face.
Agile software teams generate too much data
Agile software development teams use many different tools for tracking their projects, running builds, managing releases, source control, code reviews, code coverage, and other quality metrics. While some of these tools are integrated and work well together, it’s often hard to see the big picture on a dashboard.
I know from personal experience at Klipfolio that we have way too much data to manage and understand. Without a way to aggregate it, finding useful nuggets would be like finding a needle in a haystack. We track close to 100 tasks at any given time in various states in our development pipeline. Each of these, whether they are being coded, reviewed, tested, prepped for the next release, or released, already interact with many different systems producing data along the way. That’s way too many data points to track without having a proper monitoring system in place. This data, if monitored and used properly, helps detect problem areas, bottlenecks and improve processes. It’s not, at a minimum, it represents a lost opportunity to increase the efficiency of processes and at worst,it can result in project failures.
Fortunately, a tool like Klipfolio allows you mash up different sources and services on a single dashboard. Let’s hear how someone who doesn’t work for Klipfolio, but who has already written a post about this very topic.
The interview:
1) What does your agile process look like in summary? Do you use scrum or Kanban?
Karl: As we built the in-house engineering team, we started out with a Kanban process to help us get things in order and determine our throughput.
As our team gelled and the product planning and release process has gotten more predictable, we have moved to a scrum process. We aren't super-strict on all the rules - we're just a team of five - but we do use most of the standard artifacts: sprint planning, standups, demos, and retrospectives. We've used both one and two-week sprint cycles, depending on the size of the projects planned for the sprint.
Ali: That’s interesting, we use Scrumban at Klipfolio which pretty much combines Scrum and Kanban. I have concluded overtime that in the continuous delivery world having a prioritized list and a single backlog is really important. This reduces the need for sprint plannings but that’s a topic for another day :)
2) Why do you think tracking data in agile projects is important?
Karl: With any project management framework, you hope to answer two questions: "what can we do?", and "when can we do it?." I like agile because it encourages smaller pieces of work and constant re-evaluation of the process. If you don't track data though, it's very hard to know if changes you made actually improved things. We try not to rely wholly on how fast it "feels" like we're moving; we want to point to concrete metrics to back up the feelings.
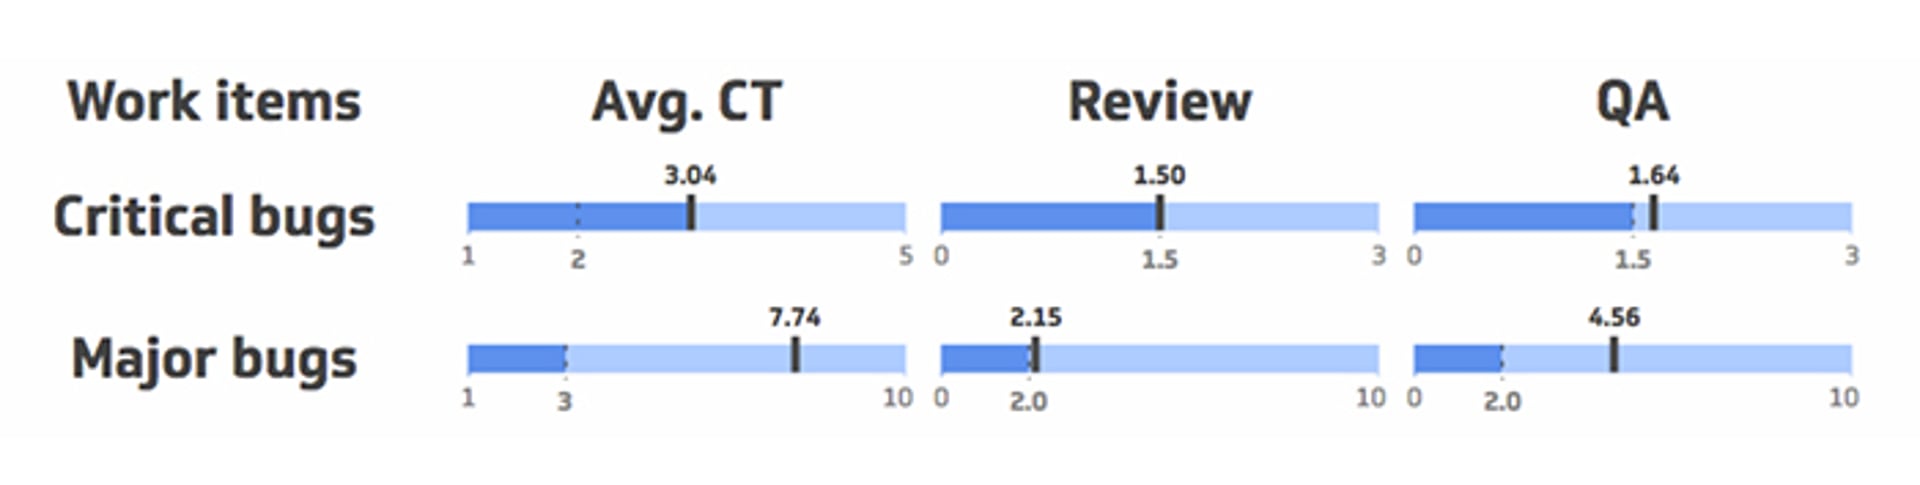
Ali: I totally agree, having the data is really important. For instance by tracking our Cycle Time (CT) and time spent in each state of our pipeline including wait time, we have discovered very quickly that we have a bottleneck in our QA step. While, we had the anecdotal feeling the data helped us to step back and think more seriously about how we can solve this problem in our process.
The following sample Klip shows average Cycle Time for Critical and Major defects as well as the time spent in Code reviews and QA.
3) What are the main metrics that you track daily, weekly, and per sprint?
Karl: We keep up with a number of metrics throughout the planning and sprint process. As the leader of our engineering team, I check all of these metrics at least a few times per week:
- Number of items ready for the next sprint planning meeting
- Number of items in the current sprint's backlog
- Breakdown of points in the current sprint (backend vs. frontend, bugs, late additions, number of items stuck in QA, etc.)
- Time left in sprint vs. the number of points left (essentially a burndown)
- Number of items and points completed per team member
- Amount of time taken vs. estimated points
When you're trying to track that many metrics, you can't spend a ton of time analyzing them, but keeping up with big picture trends in your team definitely helps us make estimates on future projects.
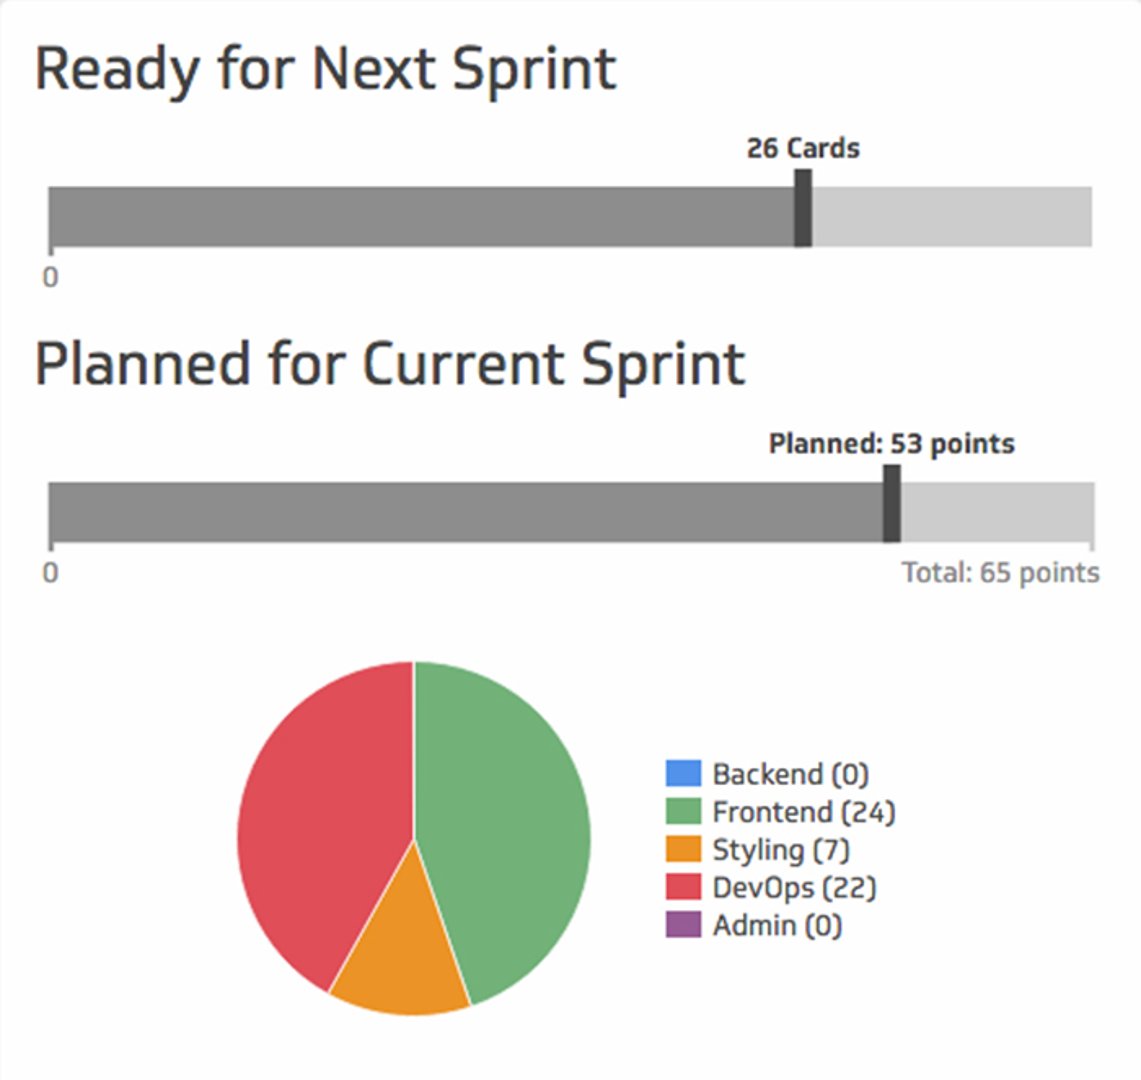
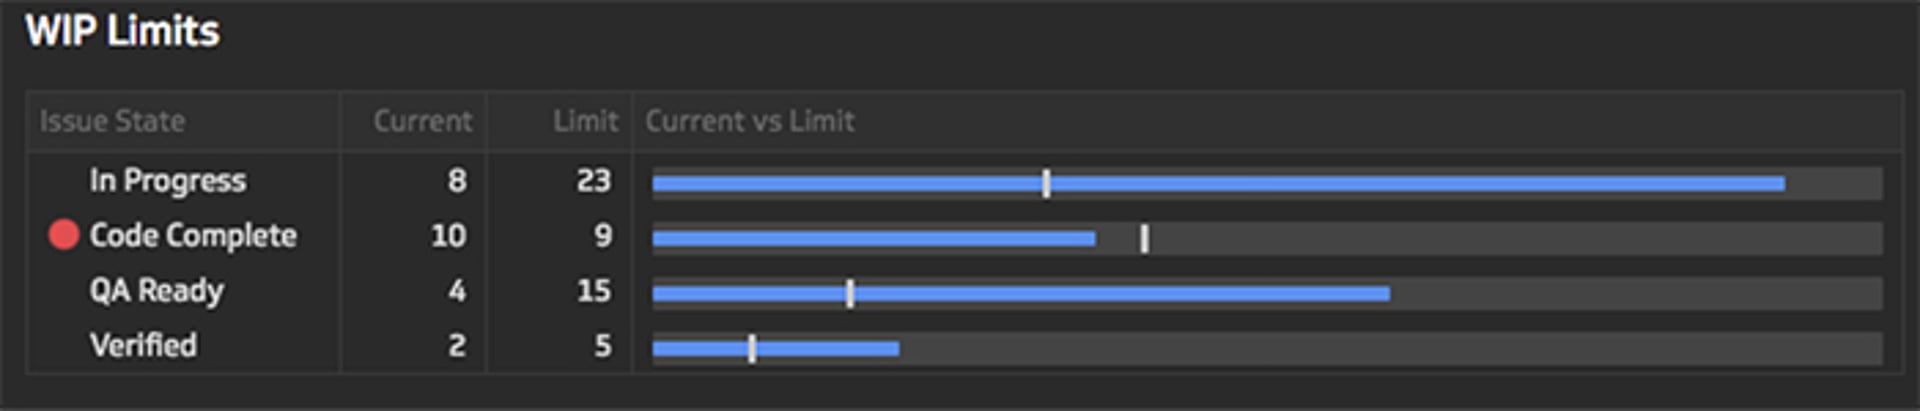
Ali: Those are for sure good metrics to track. One of the useful metrics that we track and that kind of reflects the Kanban aspect of our process is WIP (Work in Progress) limits. Here is a live dashboard that shows an example of a WIP limit visualization.
4) What are the metrics that you track for longer term projects to make sure project is on track?
Karl: When we have a really large project, we'll usually break it up into smaller pieces, then map each of the pieces onto a sprint-by-sprint roadmap. It's dangerous to make a timeline and then force everyone into it (this encourages people to skip testing and best practices in the name of adhering to the timeline), but it does help provide a reality check by making us ask "is it even possible to get this project done by date X?"
Then, we update our timeline based on reality rather than forcing reality into an artificial timeline. We keep up with the points we complete each sprint and will adjust or remove features further down the timeline if it becomes necessary.
Ali: I really like the approach you guys are taking. Again having the data helps to set expectation and give visibility to where the project is and avoid those artificial timelines that you mentioned.
5) How often do you look at your dashboards and what actions do you take based on your observations?
Karl: We have a number of dashboards at Packback including our agile sprint tracking dashboard, and all of them are on a rotation on TVs in our office, so everyone can see how things are going at any moment.
I try to take a look at our sprint progress dashboard every day or two and if I notice something is off, I'll look more closely at our sprint board (we use Trello for this). I would love to be able to set up alerts and get emails when certain metric triggers are matched, but I haven't found a great way to do this in Klipfolio yet.
Ali: That’s a nice process you have for yourself, look at the high level aggregated data and the dig more into the root cause, if required. With respect to tiggers, that’s true Karl, while you can create indicators on visualizations (we call them Klips) to monitor and highlight certain conditions, we don’t yet at the time of writing this post support metric triggers and notifications as you call them but it’s for sure one of the items on our roadmap that we are exploring. Thanks for the feedback!
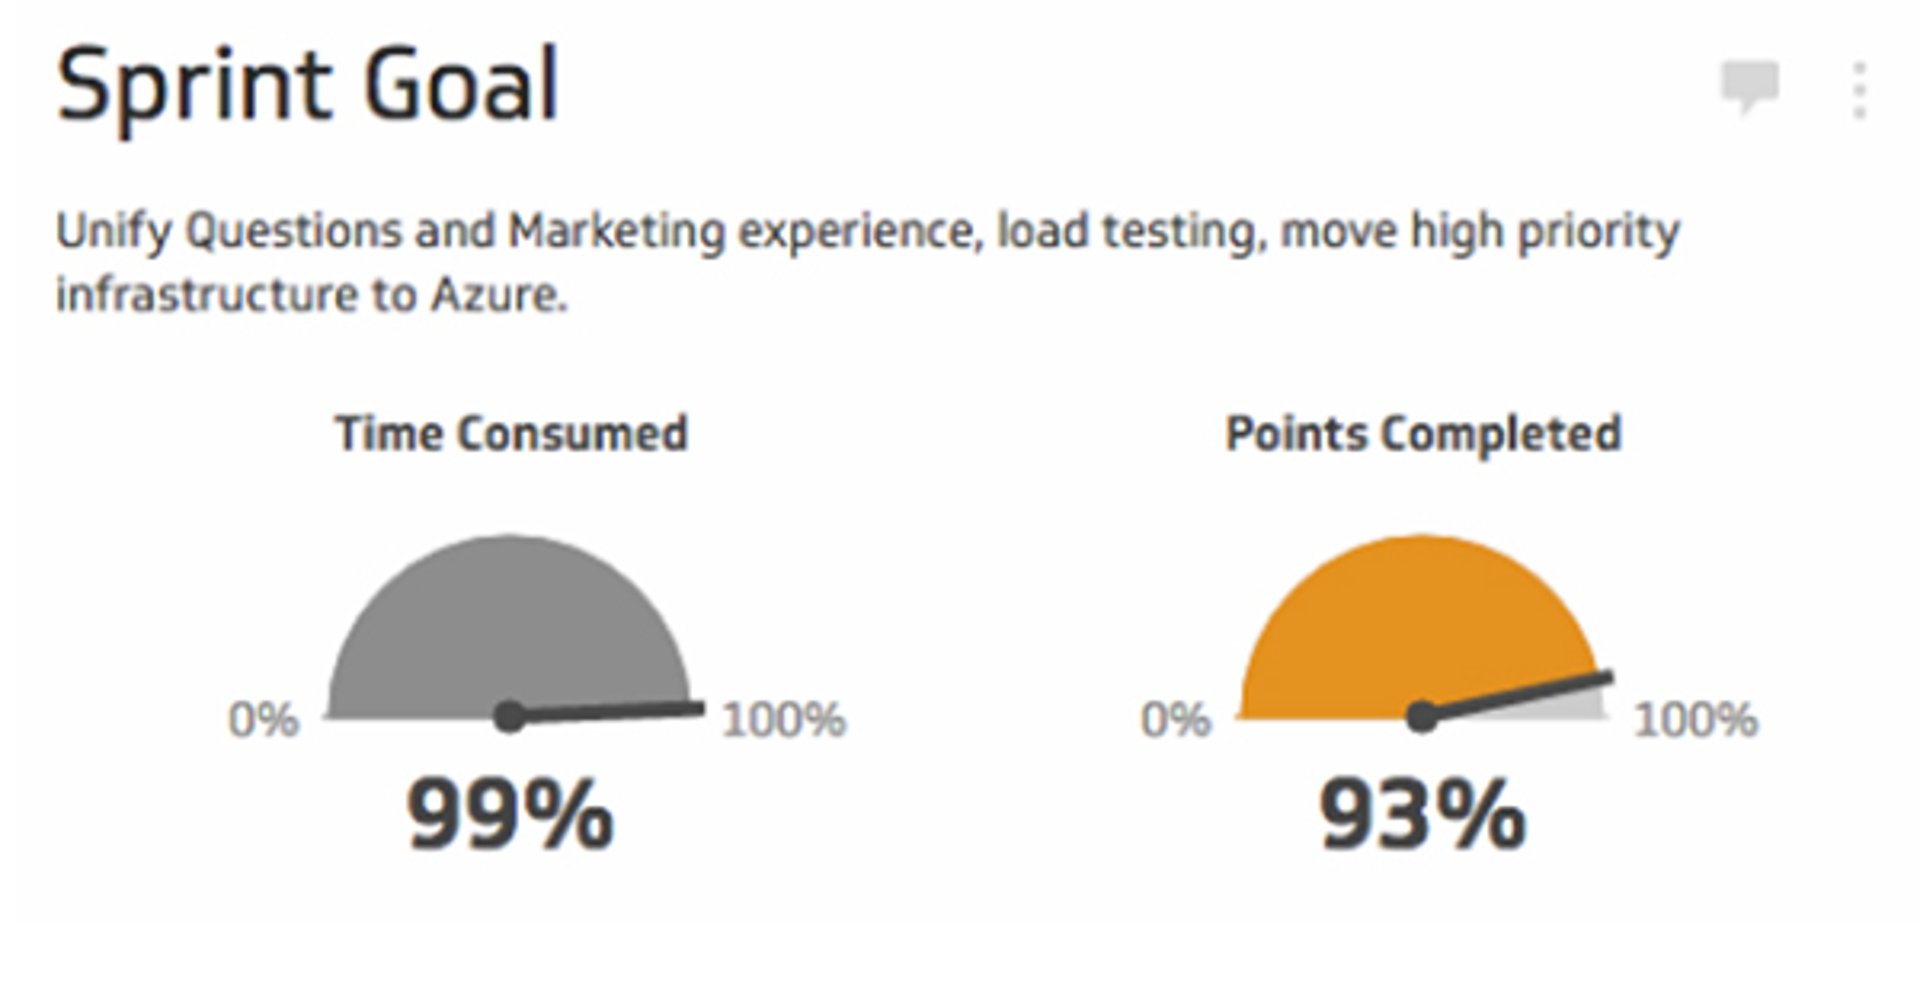
6) How has using Klipfolio dashboards helped you improve your agile process?
Karl: One of our biggest weaknesses has been on the planning process. We often enter into sprints with too much work for our frontend engineers and not enough for our backend team. Our sprint tracking dashboard on Klipfolio has helped alleviate this imbalance by showing us how much work is planned for each team in each sprint. The dashboard also helps me track our velocity as a function of number of team members, amount of work planned, etc.
Ali: That’s great! It’s good to hear that our tool has helped you guys solve a problem you were facing. In our case, I have solved a number of problems with our dashboard but one that I will leave you with is keeping on top of the number of Critical and Major defects that customers have reported. The other two related metrics that we’ve been looking at recently are number of releases and number of regression issues introduced by the releases, they are helping us to move faster while keeping an eye on quality.
7) What are the tools that you use in your development process and how do you get data out of them and into Klipfolio?
Karl: We use Trello for our sprint tracking. One of the nice things about Klipfolio is that it works with any API. Initially we used Trello's API to directly pipe sprint data into Klipfolio, but as we've built more complex dashboards, we actually created our own internal API that does some of the data manipulation before we make it available to Klipfolio. Some of this manipulation could be done in Klipfolio, but since there's no version control in the Klipfolio formulas, we decided it would be safer to do it internally.
We also have a dashboard that tracks our application health where we hooked Klipfolio up to NewRelic, Google Analytics, and our internal test coverage reports. Our sales team has also integrated with Salesforce and Google Sheets to track their progress throughout the campaign.
Ali: Wow that’s great, sounds like you guy pay a lot of attention to monitoring the pulse of your process throughout your business. Yeah, while we support many different integrations, I really like that I can push data to Klipfolio via our API it makes it easy to do some pre-processing if I need to and then push the data to Klipfolio data sources.
Wrap up:
Agile teams often customize the common methodologies and frameworks like Scrum and Kanban to their needs. However, no matter what kind of software development methodology they use and how large their teams are, they can always take advantage of monitoring the data points that are produced by their process. As Karl has nicely put it in the conversation above, you need to use metrics and monitor them if you want to move from how it “feels” to concrete “facts”.
Some of the metrics that agile teams often monitor are velocity, number of ready stories, story points per team member, WIP limits and Cycle time. While these are good examples, you should obviously not be constrained by these. Depending on your process and what you’d like to improve, you can come up with other creative metrics that help you and your team better understand what’s going on, change your focus, update behaviour, and improve things.
Next steps:
Want to know more about Klipfolio and using dashboards for your software development or DevOps teams? I suggest you read the following next:
Related Articles

5 tips to understand (and organize) your restaurant data
By Saleem Khatri — June 9th, 2026
6 dashboards I use daily to run my SaaS company
By Allan Wille, Co-Founder — April 10th, 2026
Business Metrics vs. KPIs: What’s the Difference?
By Jonathan Taylor — March 13th, 2026