
Summary - Building a Google Analytics dashboard in Klipfolio is easy! Reading this blog is longer than it takes to build, learn how today!
When you need to report to your boss, the CFO or your clients, you’ll need to make sure you can present your GA metrics in a way that shows tangible business results. This is where a custom reporting tool can help, and where the challenge is finding a solution that balances the flexibility and customizability you need with the time and money you have.
I’m going to walk you through a couple of scenarios to show you the power of Klipfolio when it comes to reporting on your GA data (and any kind of data for that matter).
- How to use a pre-defined PowerMetric to visualize GA data in less than a minute
- How to modify the data query to pull in a customized view of GA goal completion metrics
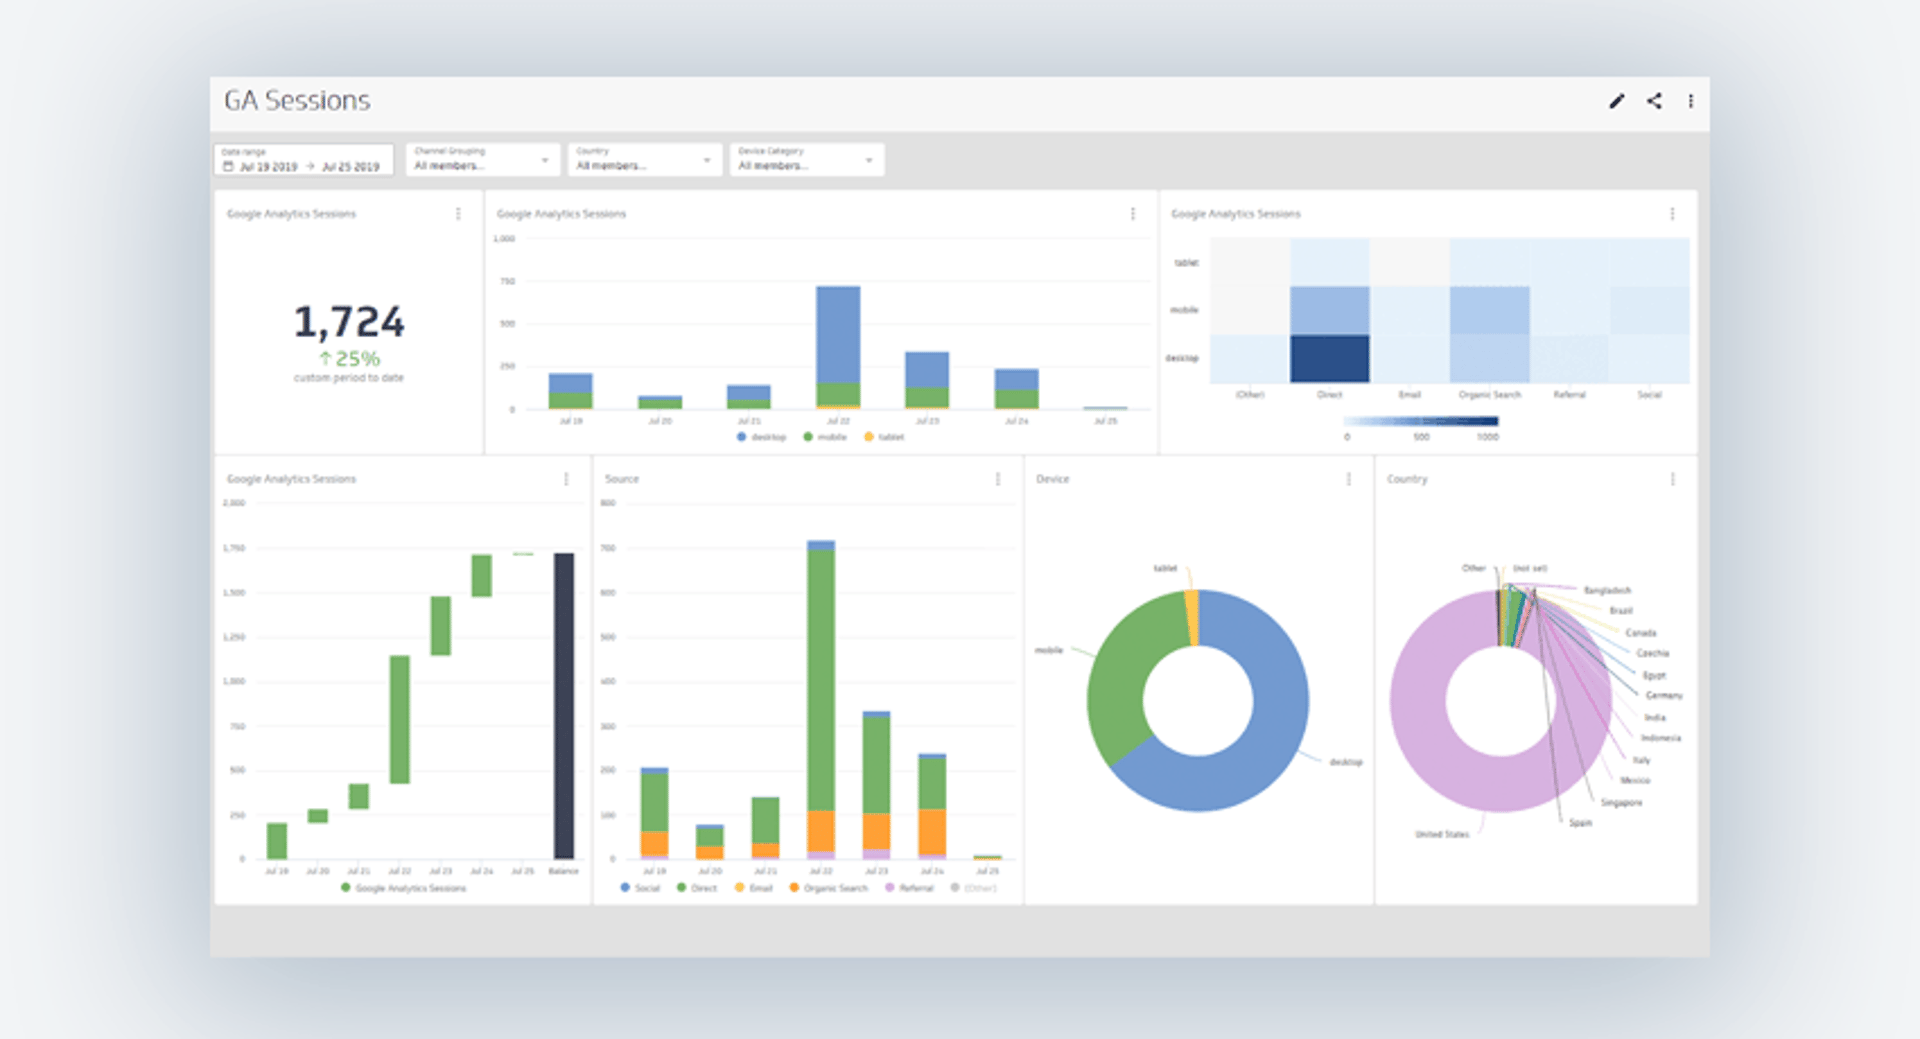
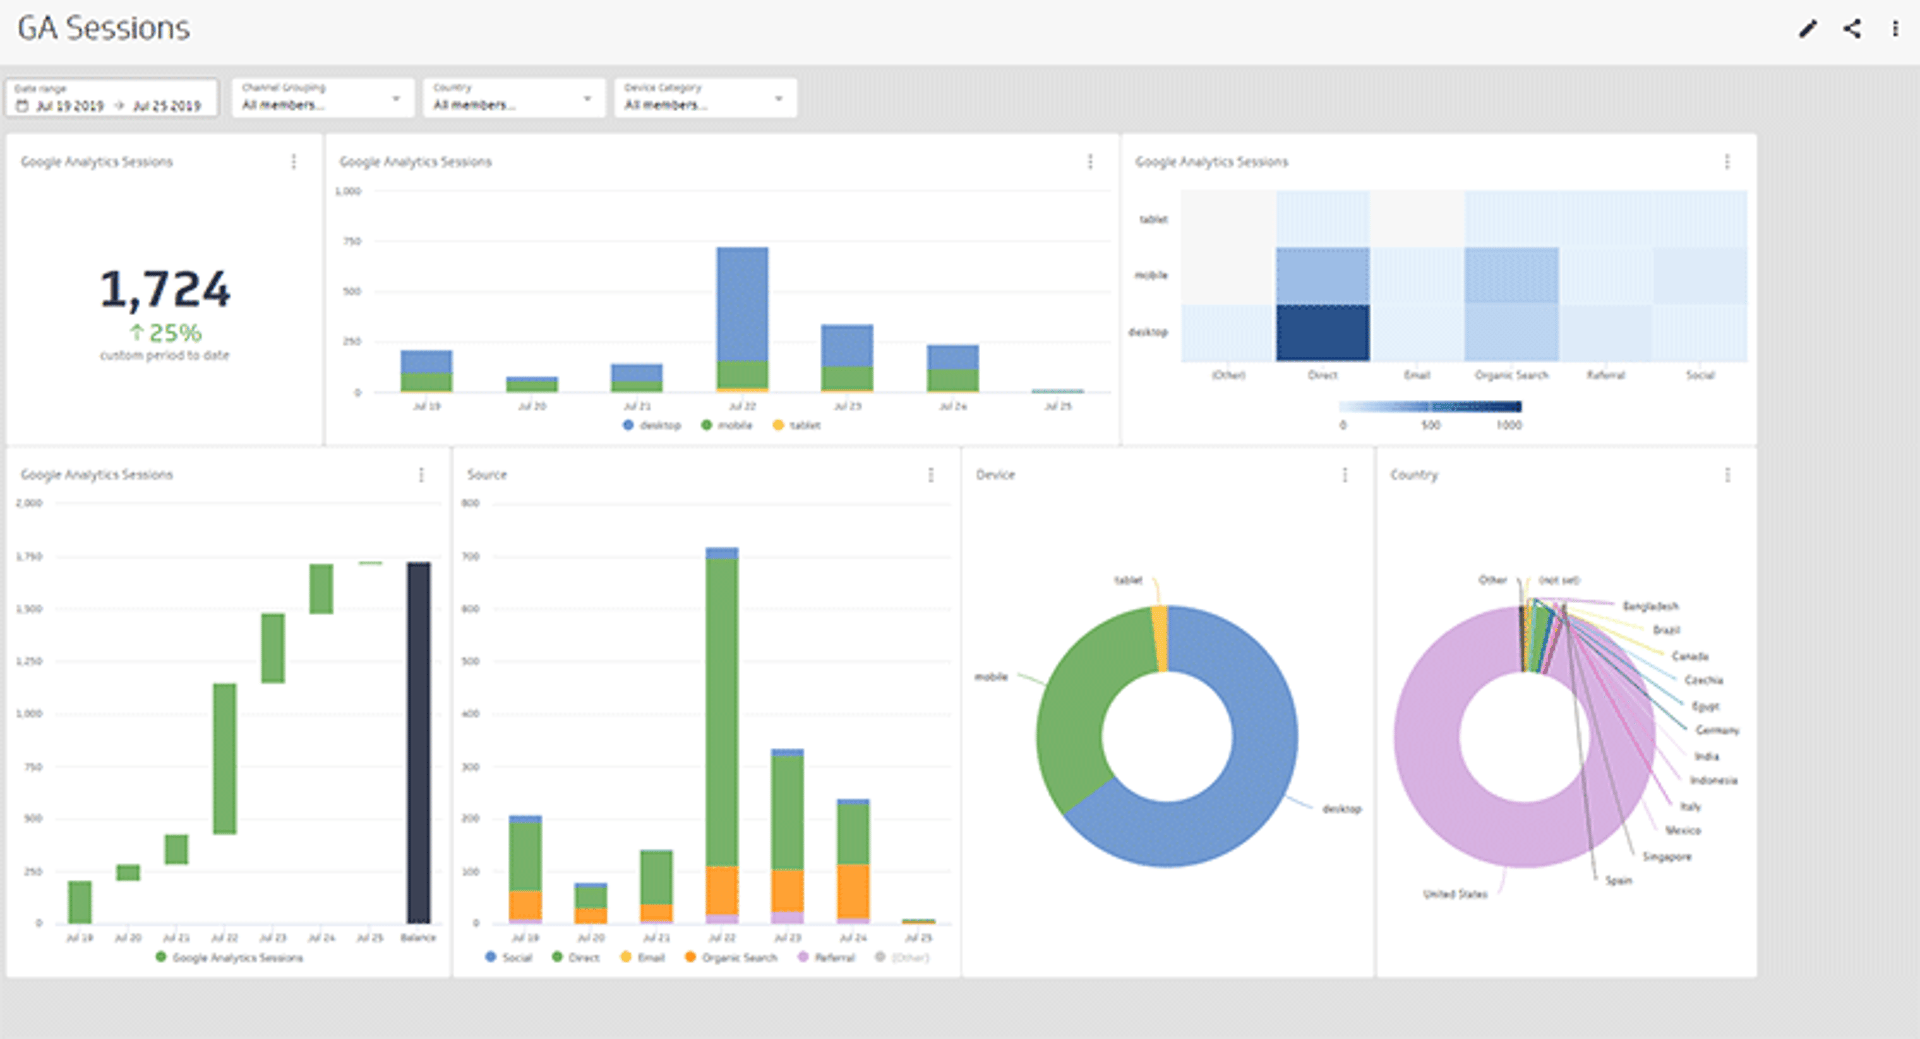
The first scenario leverages a new easy option we’ve added that lets you bring your GA data into specialized data objects in Klipfolio called PowerMetrics. I used the pre-defined Sessions GA PowerMetric to quickly connect to our GA data and spin up a dashboard like this in a couple of minutes.
Why start with PowerMetrics
The really powerful thing about starting with PowerMetrics in Klipfolio is that you can instantly visualize your data and change the visualization, including the date range, filters or segment the data differently, all with a single click. These new features make building dashboards efficient and easy.
You can also start with PowerMetrics to validate the data you’re bringing in before you roll up your sleeves and do something completely customized in the Klip Editor.
This is how I used a single multi-dimensional PowerMetric to build this dashboard.
Here’s a few tips before you try it yourself:
- By default the visualizations will use the dashboard date range. To override this for a view you can use the configuration options.
- Add global filters to make it easy to change the visualizations across the dashboard.
- Create a quick performance indicator by adding a “Compare to previous period” that will show at a glance whether your results are trending up or down.
- Change the aggregation type in the visualization configuration options to show the average or some other number.
You can also pull multiple metrics into a single dashboard for a complete view of business performance and create calculated metrics from 2 or more saved PowerMetrics to generate ratios or other metrics you may need to report on.
Whether you need to show people how visitors are finding your site, how your web performance metrics are trending over time or report on specific goal completions like trial sign-ups, you can get all that data into a single Klipfolio dashboard and even present it alongside or blended with other business data as well.
How to modify the data query
At Klipfolio, we keep a close eye on our Trial sign ups which come from GA Goal Completion 12. This metric is critical to report to management and our board, and our Sales and Marketing teams are laser focused on it every day.
You may have data in GA like this that you need to report on regularly or even display in the office on a TV wallboard. To pull this kind of data into Klipfolio you can create a custom PowerMetric based off of a custom GA data source.
You can do this from scratch but it’s easier to start with the data source that was created for your Sessions PowerMetric and duplicate it so you have that query to start with.
Tip!
Connect to a pre-defined PowerMetric and then duplicate the underlying data query:
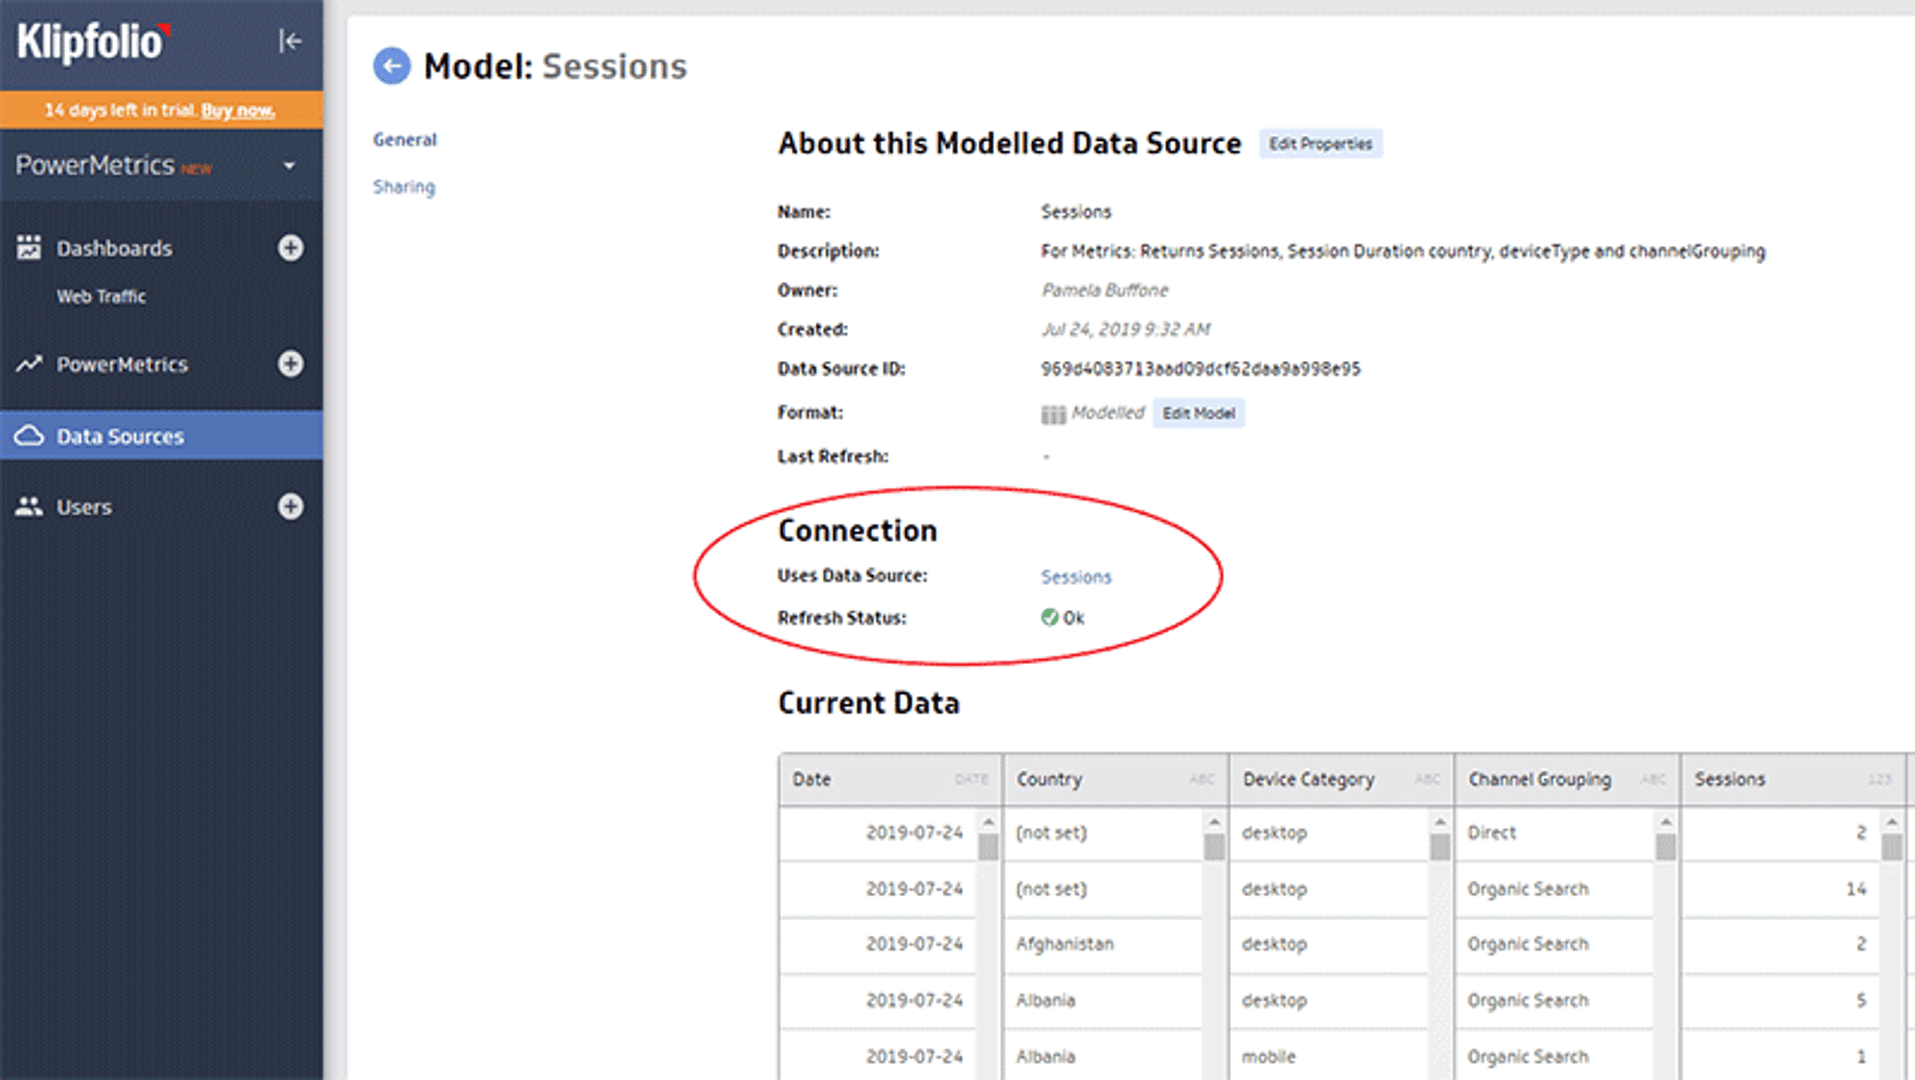
When you connect to a pre-defined Sessions PowerMetric, Klipfolio generates a data connection and a modelled data source with the same name. Find the Sessions data connection in the Data Sources part of the Klipfolio app. If you open up the Model, you can get to the Connection from there. The Connection data source has the query for you to copy.
Once you’re in the right spot you’ll see the Duplicate button in the upper right hand corner of the screen.
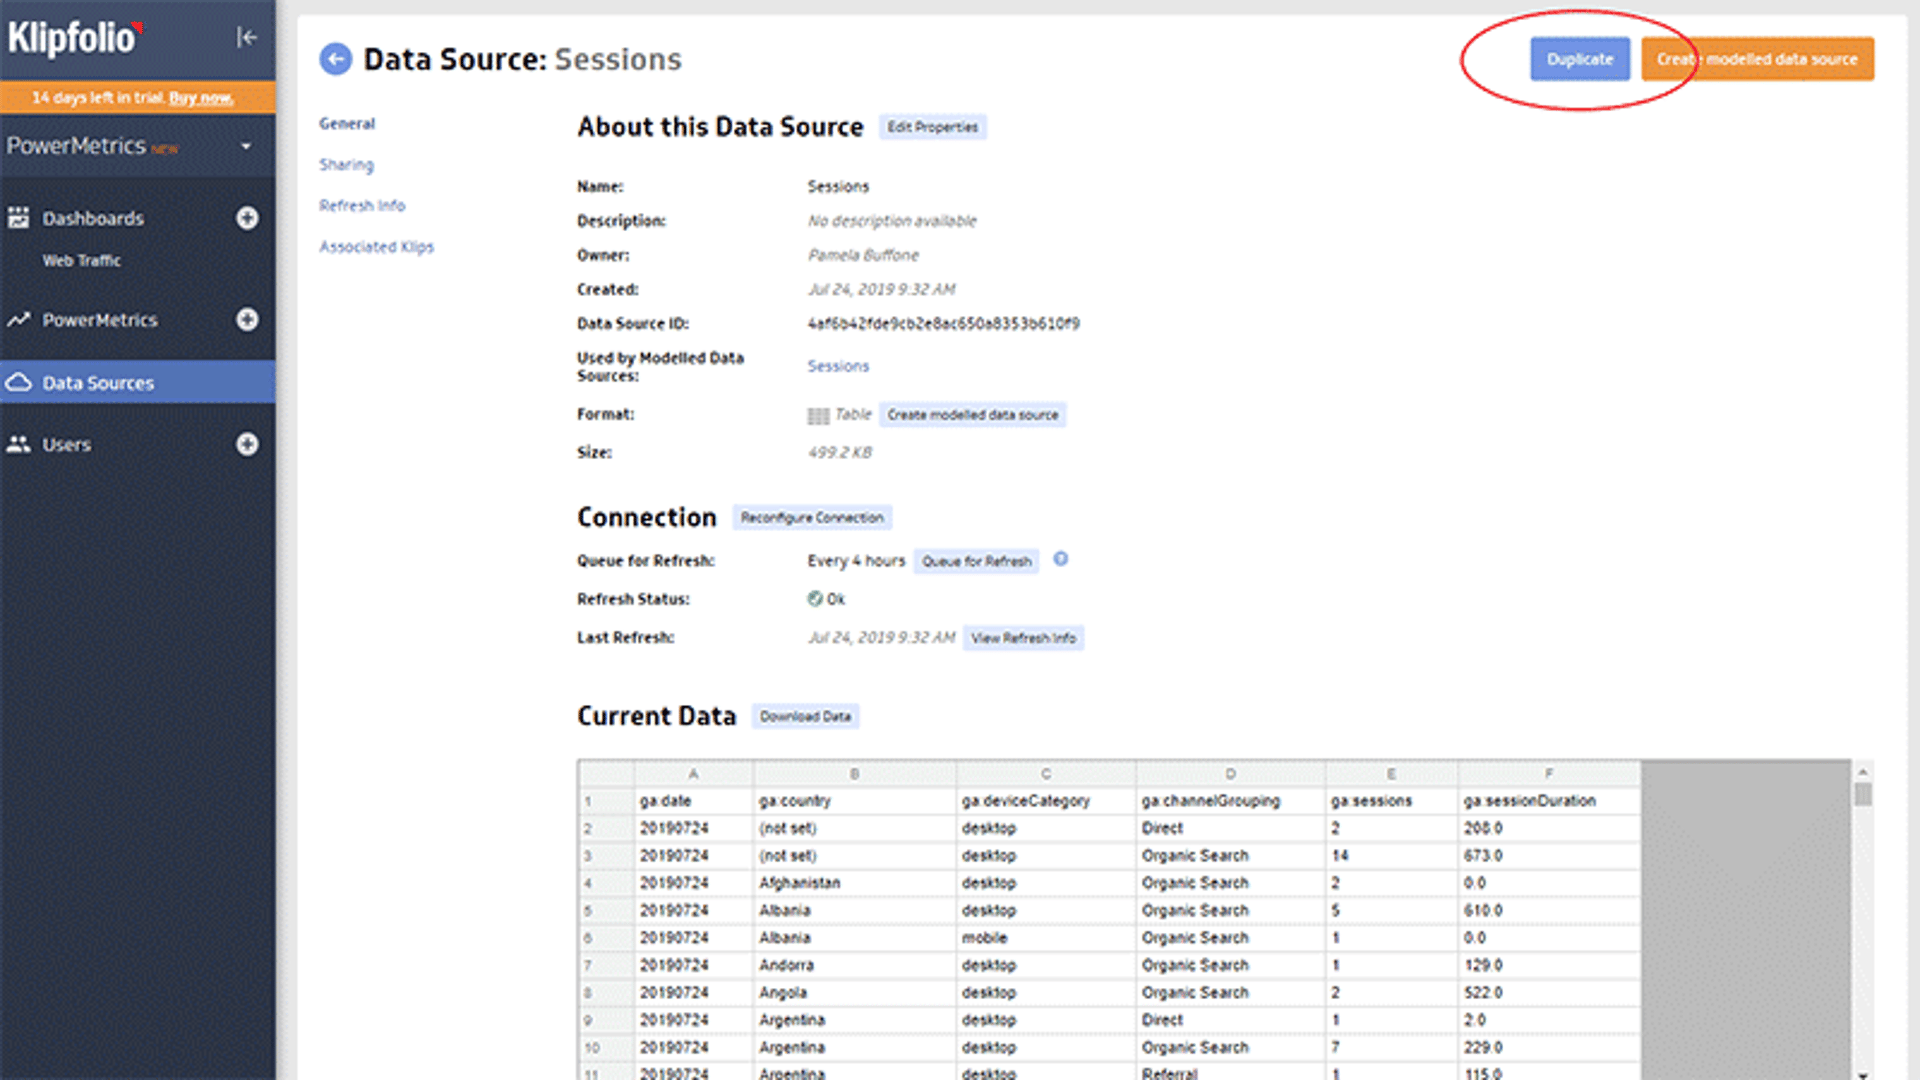
Hit Duplicate, give it a new name and then select the “Reconfigure Connection” option.
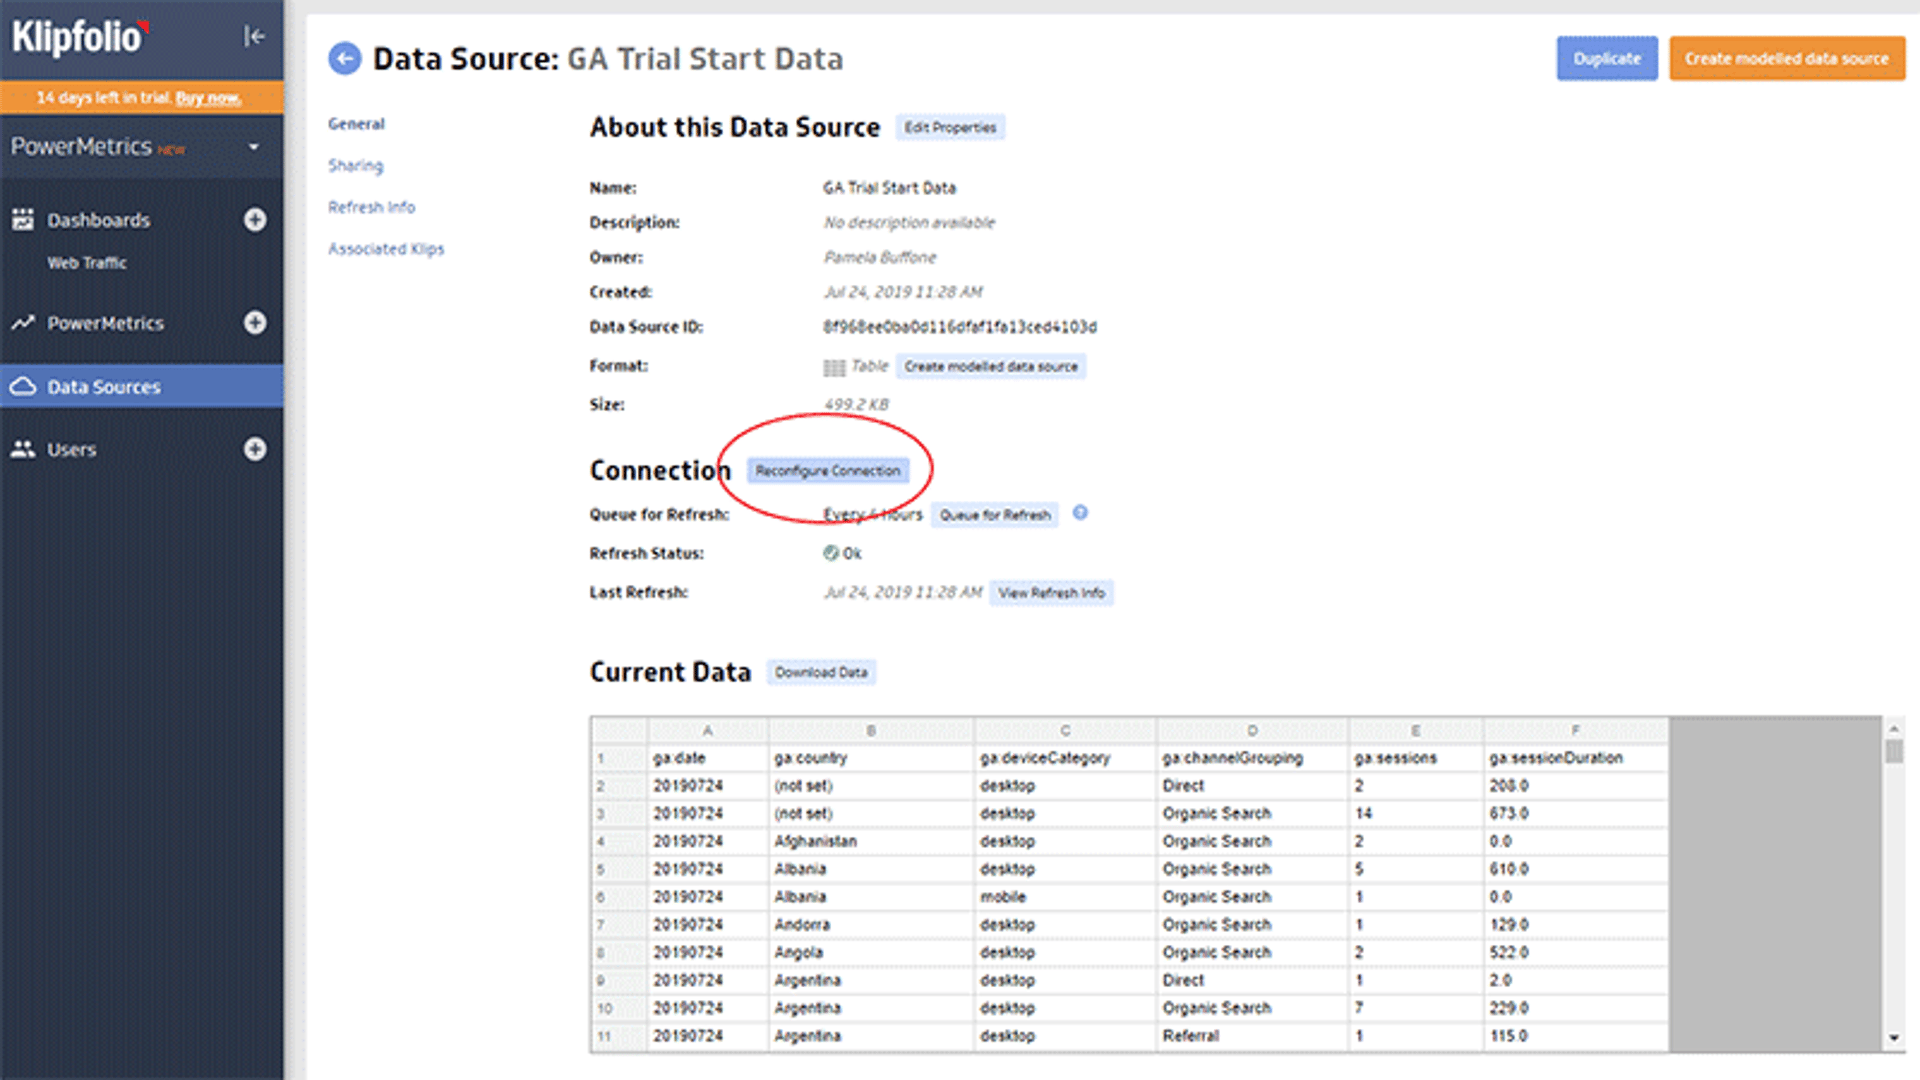
Hit next to use the same credentials and web property info and use the “Switch to Custom settings” option
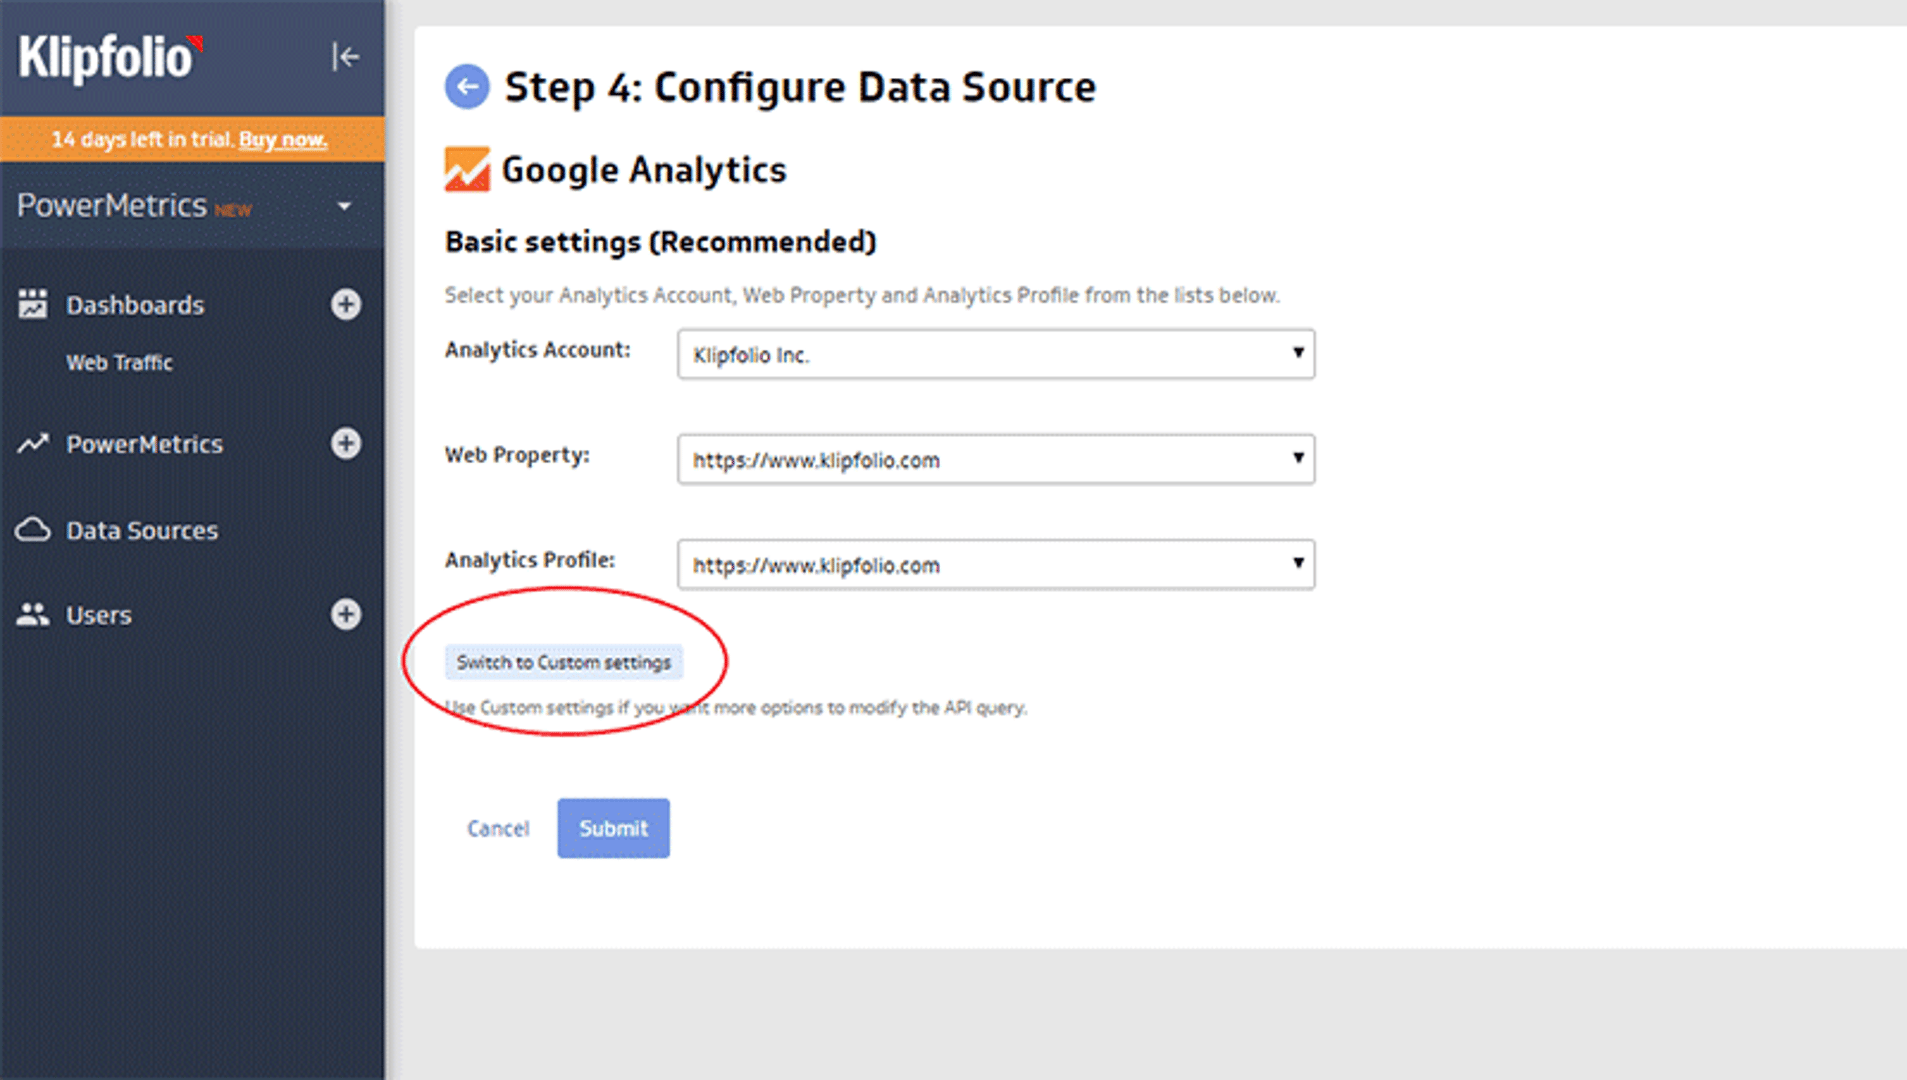
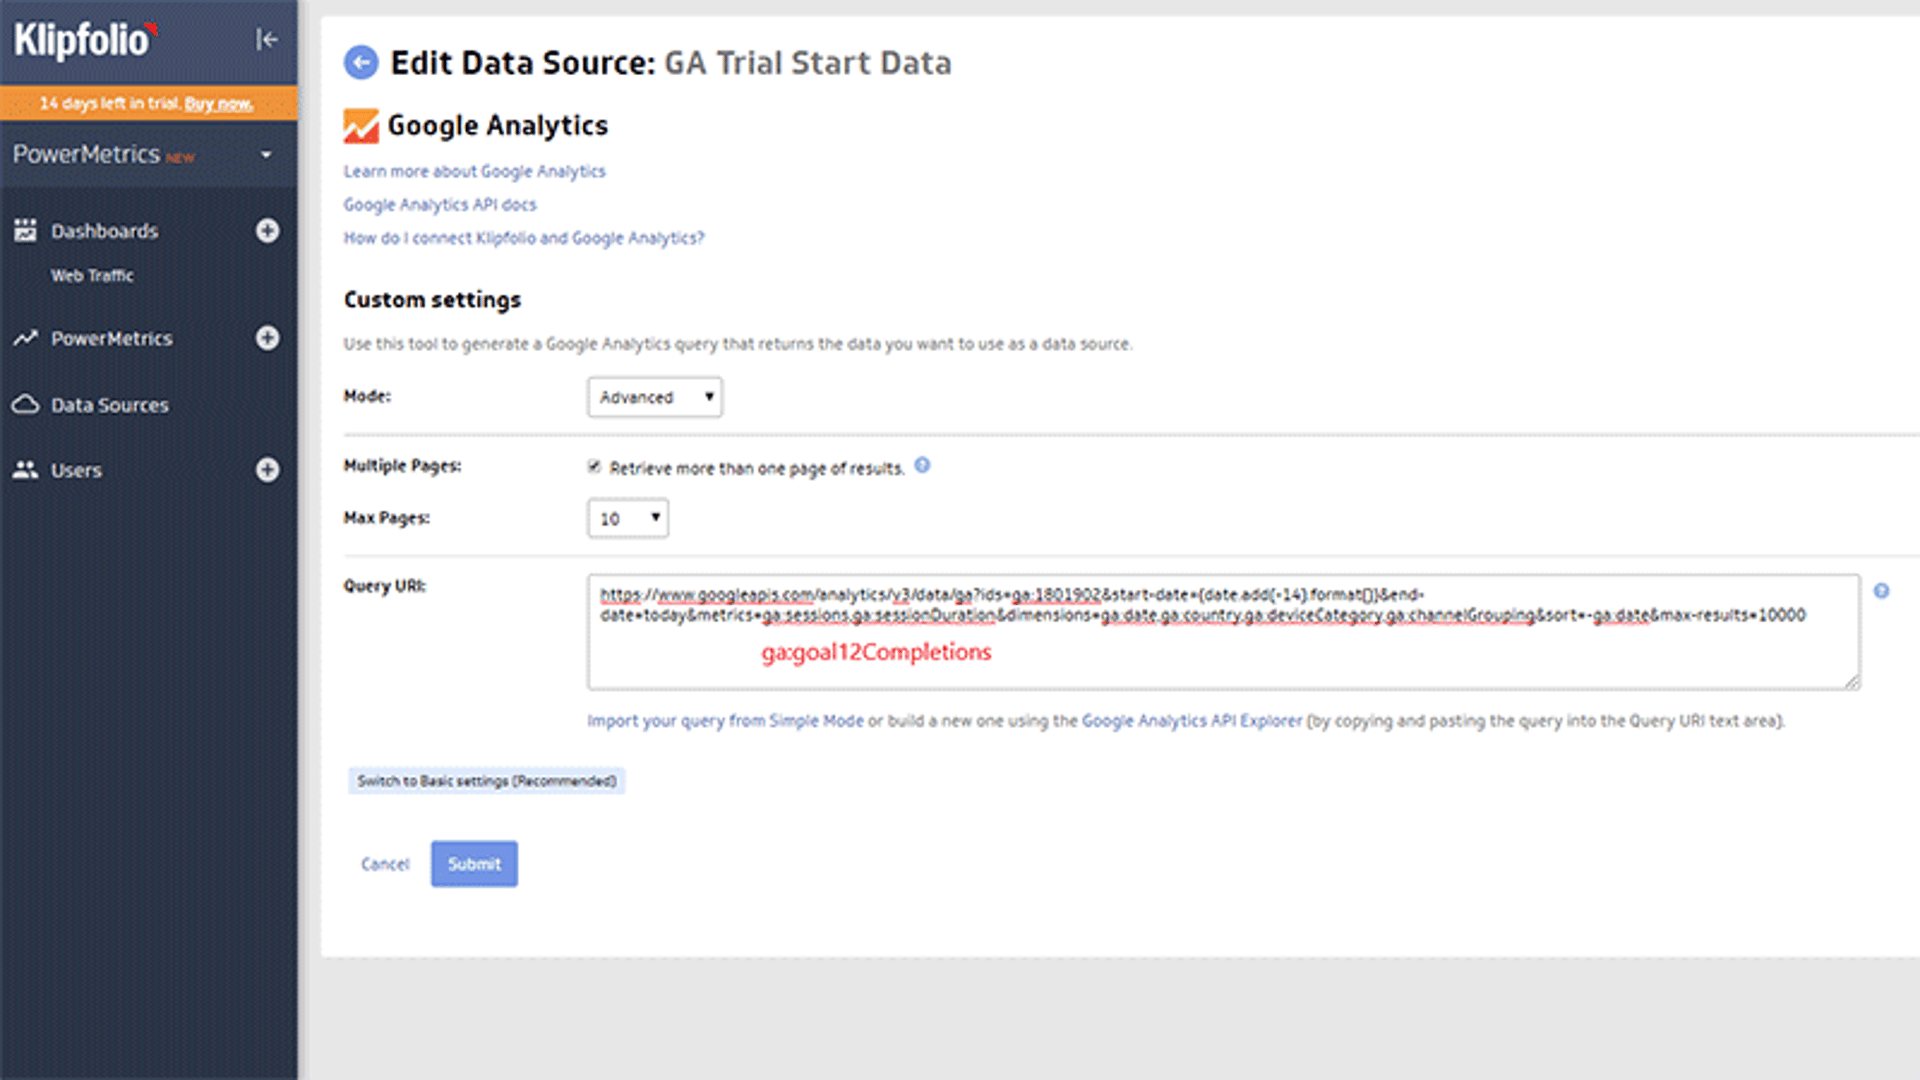
Advanced mode will automatically come up and you can edit the Query URL. In this case we’ll use the same dimensions that are retrieved from the Sessions query and only change the metric name.
Replace the sessions metric name with the ga:goal12Completions metric name and submit the query.
Tip!
If you’ve started with a custom GA query from scratch, use the Simple mode to select your metrics and dimensions from the drop down list. Then use the “Import your query from Simple Mode” option which will pre-populate the query to make it easier for you to edit.
Additional documentation can be found here.
If you need to better understand your GA dimensions and metrics check out this support doc where you’ll also find some references to Google support.
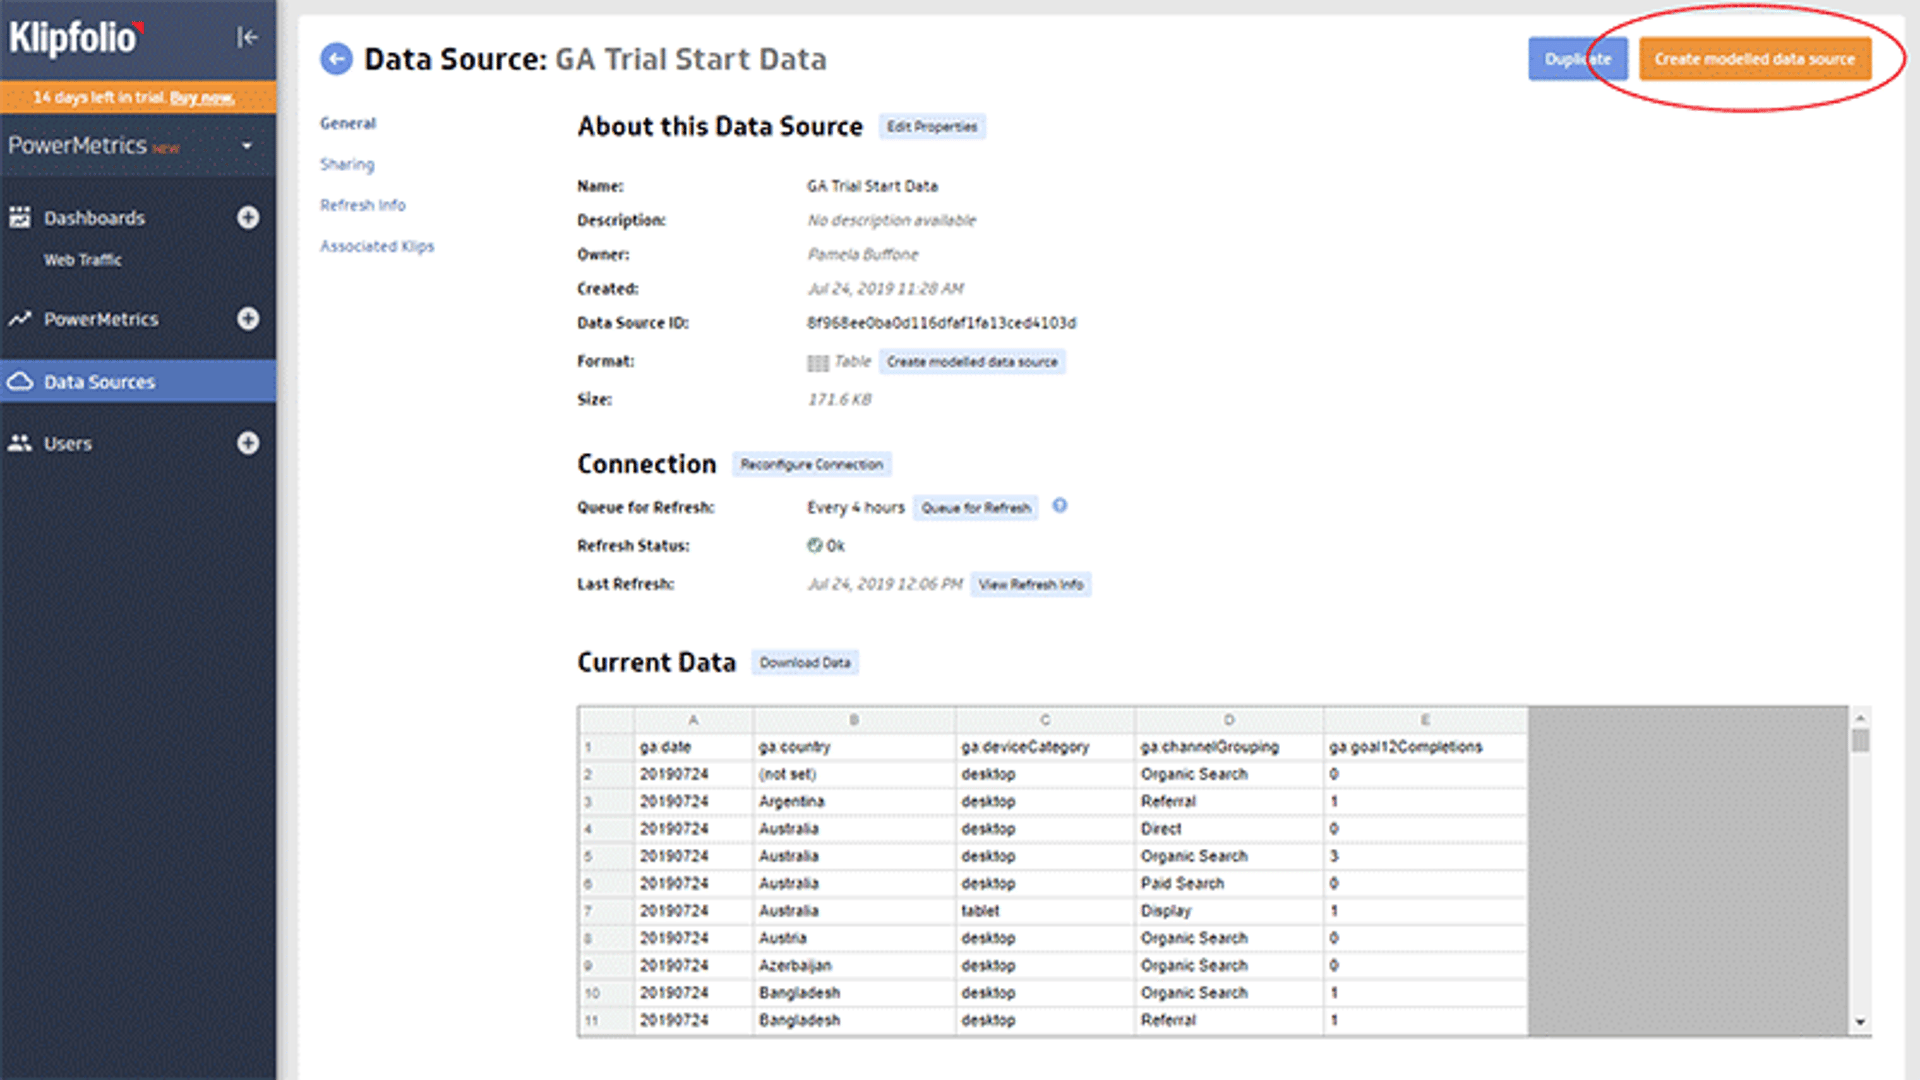
After you submit the query, you can validate that the data retrieved is the data you want.
Next, you’ll create a modelled data source that can be a re-usable asset within Klipfolio for multiple PowerMetrics or custom Klips you want to create.
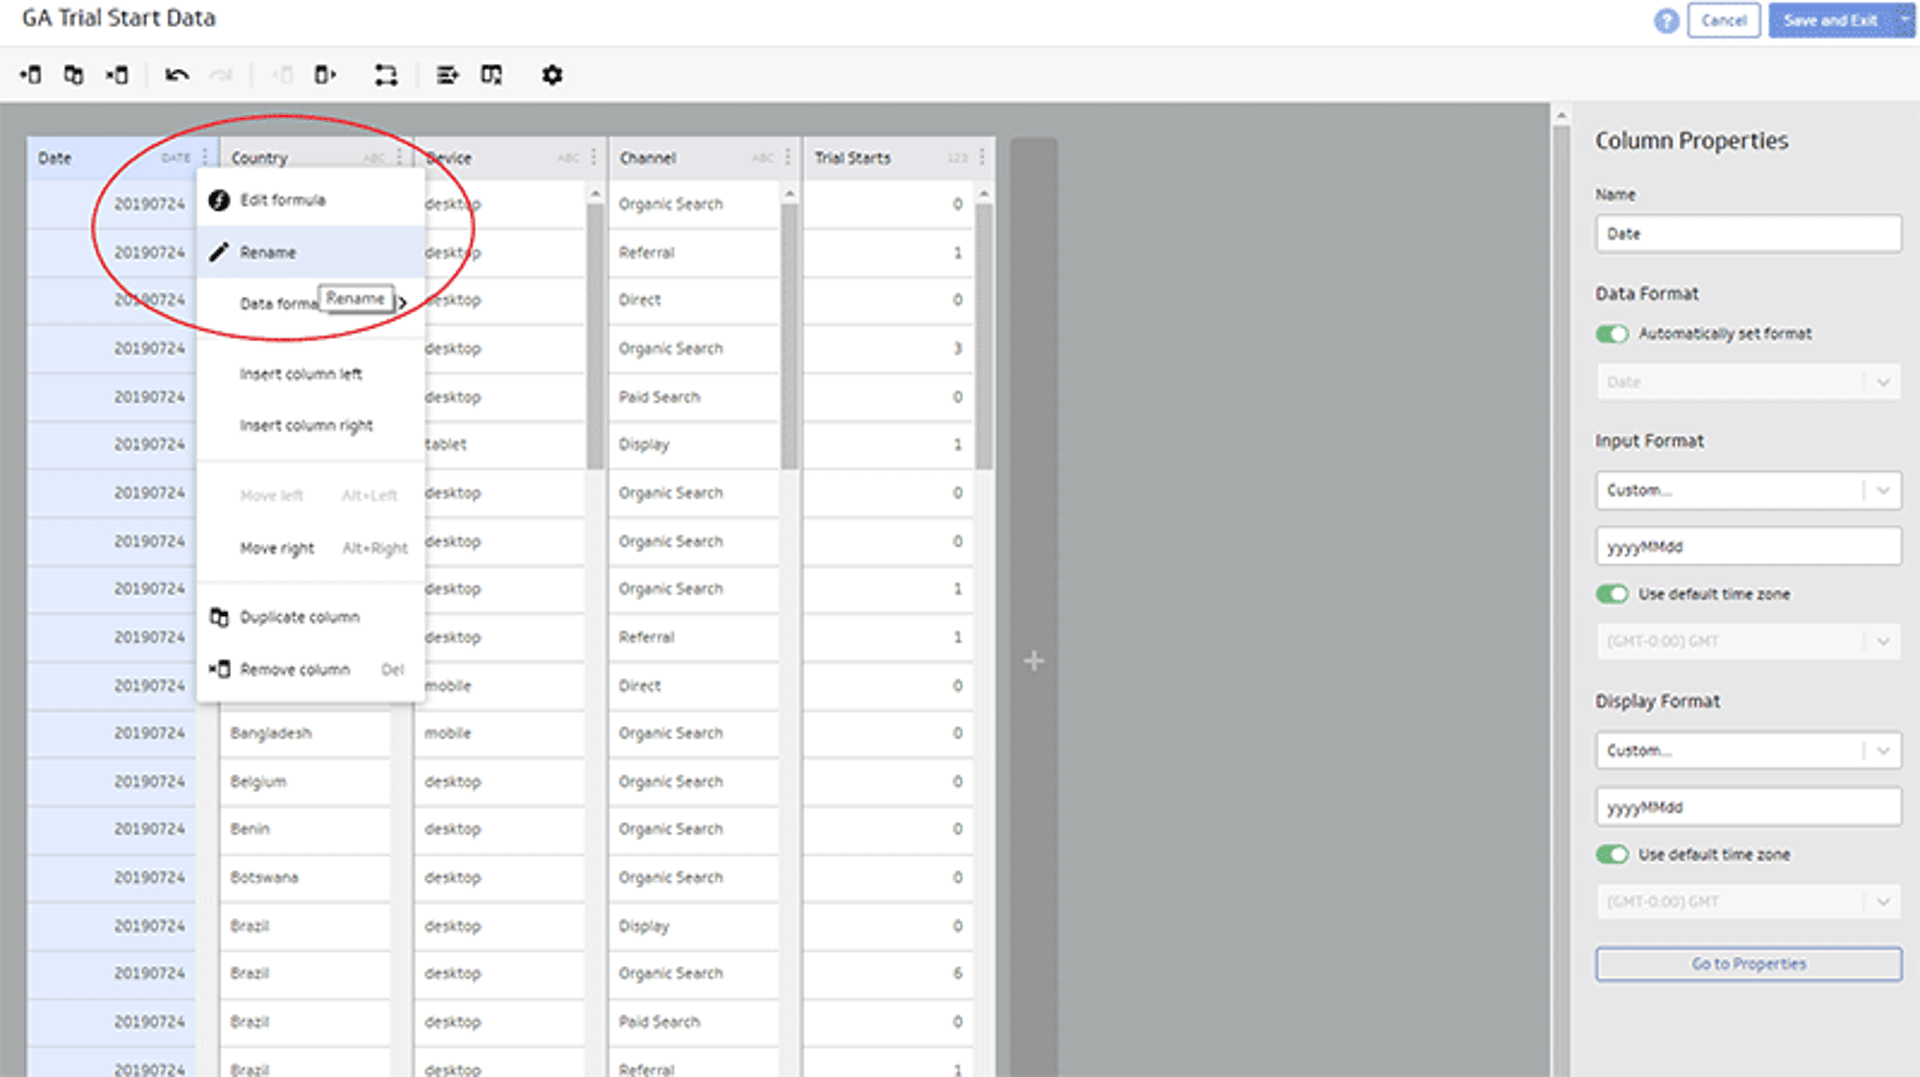
Use the 3 dot ellipsis beside the data column names to access features that allow you to rename the columns, change the data format and access other options to prep your data. You can even merge data sources to bring in other columns and this is where you can use the Klipfolio formula language to create bucketing for your data or manipulate it in other ways.
Klipfolio automatically detects the data format, though you can make changes to both the input format and the display format if needed.
Once saved, you can create a custom PowerMetric or work with this data in the Klip Editor. Putting your data into a PowerMetric unlocks all kinds of powerful analytics features, like automatic date range filtering, segmentation, category filters, trend lines and the ability to swap visualizations with a single click.
To create a PowerMetric, follow the steps to select the metric value, add dimensions by which you may want to be able to segment or filter your data, choose a date column and select how your data is updated.
Tip!
Many social media feeds don’t provide historical data but you can update periodic values in a PowerMetric for trend analysis.
That’s it. Your data can be instantly visualized on a PowerMetric dashboard or you can start building completely customized data visualizations and reports with the Klip Editor.
Happy dashboarding!
Related Articles
6 Facebook ads reports every agency needs to attract and retain high-ticket clients
By Tanya Brody — April 10th, 2026
The 5 most important SEO KPIs for digital marketing success
By Sanket Patel — February 24th, 2026
What are the best inbound marketing KPIs?
By Jonathan Taylor — December 17th, 2025