

Five Net Promoter Score (NPS) challenges that AskNicely can help you overcome
NPS surveys are worth running only when the results drive action. This article covers five common challenges that get in the way of effective NPS programs, including low response rates, response bias, and siloed data, and how AskNicely helps teams overcome each one.
NPS surveys are worth running only when the results drive action. Here are five common challenges that get in the way, and how AskNicely helps you clear them.
Most NPS programs stumble on the same problems: surveys that annoy customers, response rates too low to trust, results that arrive too late to act on, and data that sits in a silo instead of informing decisions. The score becomes a number you report, not a signal you act on. For more on that trap, see Beyond Vanity Metrics: NPS and Customer Referral Rate.
What is AskNicely?
AskNicely is a survey tool that automates customer feedback using the Net Promoter Score framework. It is built for teams that want to know how customers feel without having to chase down the data themselves.
Key capabilities include:
- Embed the NPS question in email to boost response rates with a single click.
- Sync responses to your CRM so reps see feedback in context.
- Trigger surveys on events such as a support interaction or onboarding milestone.
- Segment by channel, product, or agent to see where you're strong and where attention is needed.
- Publish testimonials from promoters.
- Set alerts on low or high scores so teams can follow up quickly.
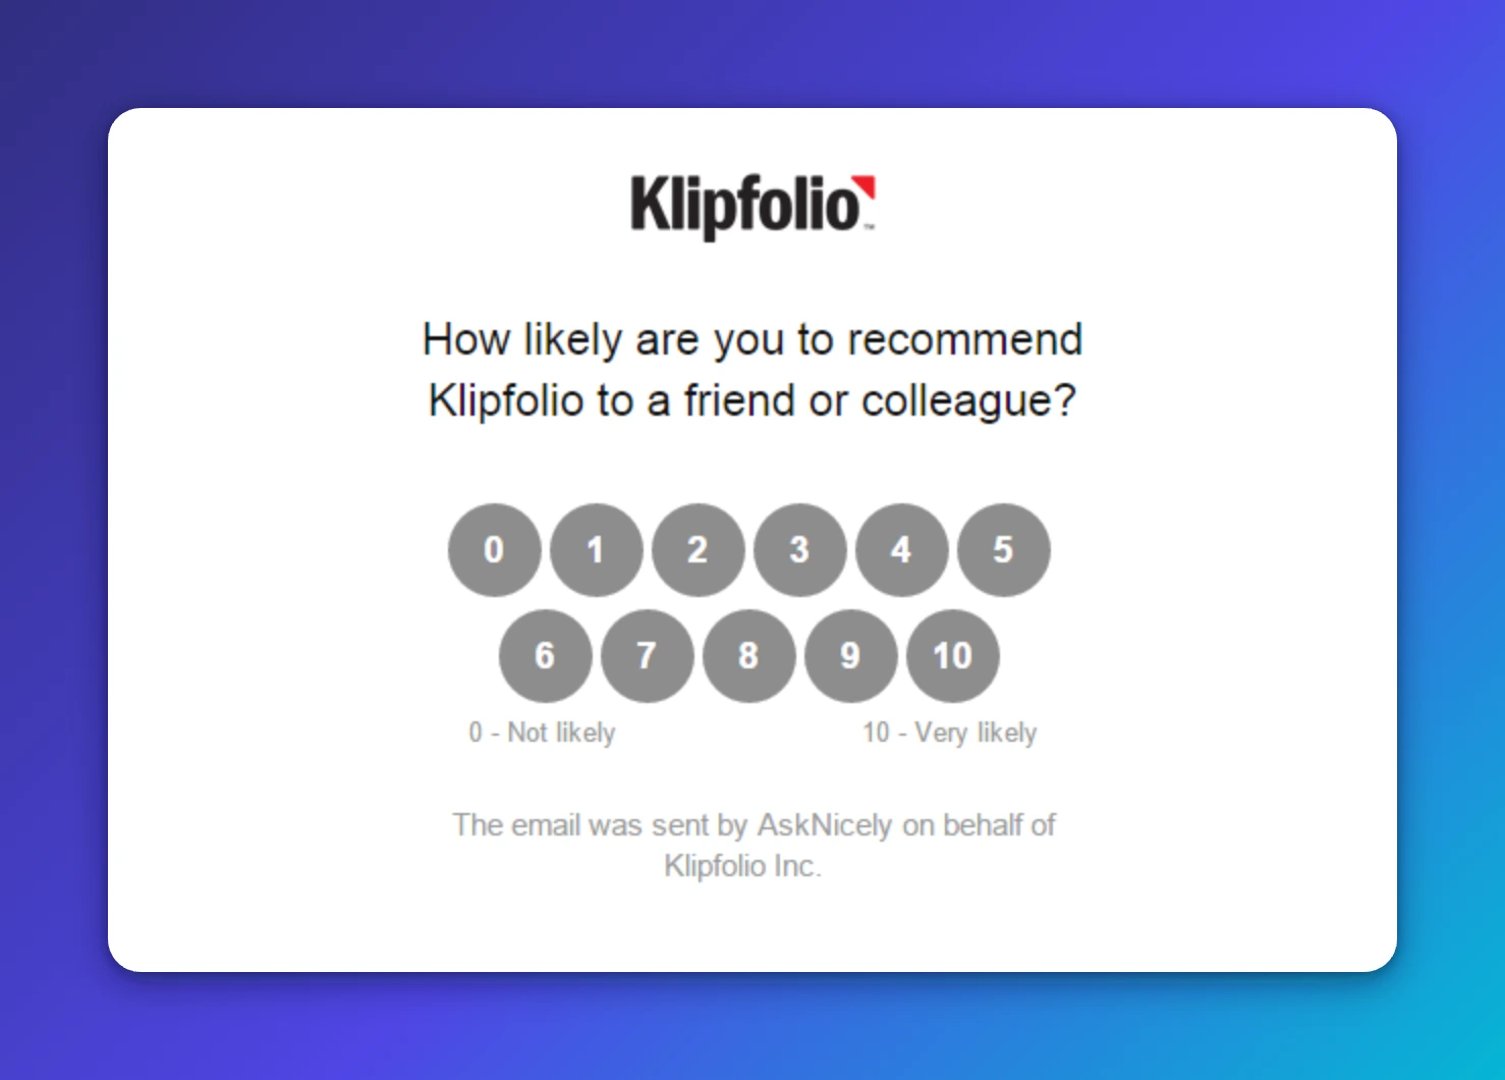
The email survey is easy for customers to use. Here is an example:
Challenge 1: Surveys that irritate customers
Every email you send competes for attention. Add a survey and customers notice. Send too often or make the experience clunky, and you erode the goodwill you're trying to measure.
AskNicely embeds the NPS question directly in the email. One click and the customer is done. No separate page to load, no second step to complete. The lower the friction, the less disruptive the ask feels, and the more likely even busy customers are to respond.
Challenge 2: Response rates too low to matter
A low response rate does not just limit your data volume. It skews your results. Customers who feel strongly, usually promoters, are more likely to complete a multi-step survey. Detractors drop off. Your score ends up more flattering than accurate, and you make decisions based on a picture that is not real.
Embedding the survey in email closes that gap. When responding is as easy as deleting the message, detractors are more likely to follow through. The result is a more representative sample and a score you can actually trust.
Create custom dashboards for you and your team.
Get started with KlipsChallenge 3: Response bias toward promoters
If your happiest customers are the ones completing surveys, your NPS will overstate loyalty. You need to hear from detractors to understand what is broken, because that is where the real risk to retention lives.
Reducing friction is the most direct fix. When the barrier to responding is low, the full range of customers participates, and your data reflects reality rather than enthusiasm.
Challenge 4: Periodic surveys instead of continuous measurement
Most NPS programs run on a schedule: quarterly, semi-annually, or after a campaign. The result is a static data point with no context around what caused it to move. By the time you see a dip, the moment to intervene has already passed.
AskNicely lets you build an automated NPS program triggered by customer actions or events logged in your CRM, e-commerce platform, or email tool. You can send surveys after a support call, after an onboarding milestone, or after any event that signals a meaningful customer moment. Your marketing, sales, and customer retention teams get a continuous stream of satisfaction data, not a snapshot taken four times a year.
Challenge 5: No real-time visibility
Even when surveys go out consistently, teams often wait days or weeks to see the results. By then, the moment to act has passed and the context has faded.
AskNicely provides a dashboard that updates as responses come in. That real-time view lets you ask better questions: Are response rates higher at certain times of day? Did a product issue move the score this week? Is a new support initiative already showing results? You get answers while there is still time to do something about them, instead of explaining a number after the fact.
Klips + AskNicely: connecting NPS to your full customer picture
AskNicely captures how customers feel. Klips turns that input into an always-on view your whole team can use, without anyone having to pull a report or paste numbers into a spreadsheet to figure out what is going on.
Pull NPS into a Klips dashboard alongside related signals like referral activity and social sentiment. Share on TVs, send scheduled PDF reports, or give leaders a live link. Everyone stays aligned on customer health without having to ask for an update.
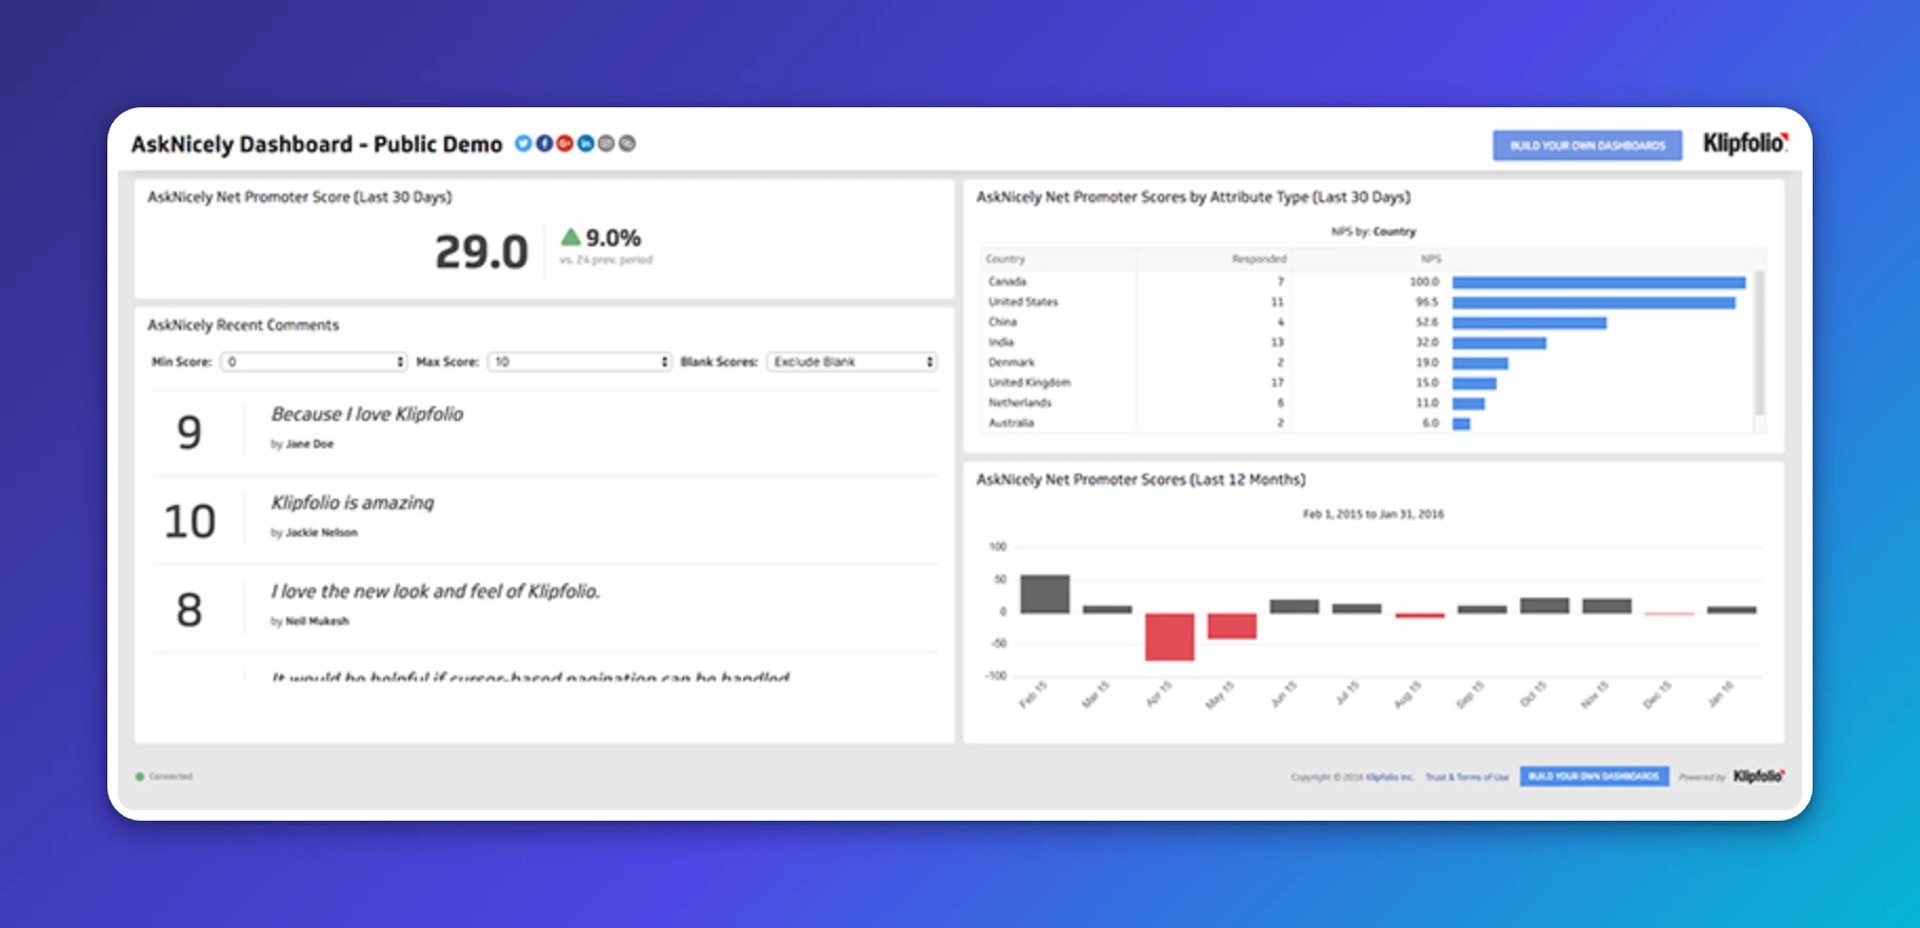
You can continuously measure, monitor, and improve NPS by combining AskNicely data with metrics from tools like Salesforce and Marketo. Here is an example of what a customer satisfaction dashboard looks like in Klips:
Two dashboard combinations worth building:
NPS and Customer Referral Rate: Link what customers say with what they do. If promoters are high but referrals are flat, equip fans with clearer asks and better assets. When both metrics move up together, double down on what is working.
Social sentiment and NPS: Chart daily social sentiment alongside NPS over a 30-day window. If sentiment dips and NPS follows, address the drivers behind the chatter, then watch both lines recover.
To bring AskNicely data into Klips:
- Connect AskNicely as a data source.
- Map fields for score, comment, date, and segment.
- Build visuals for NPS trend, distribution, and verbatims.
- Add related metrics like referral rate and ticket CSAT.
- Share the dashboard with the right roles and schedule updates.
Use variables and filters to slice results by product, region, or owner. The goal is not a prettier chart. It is knowing where customer sentiment stands right now, and what to do about it.
Updated 2026-08-27
More in Marketing Analytics

Customer Marketing KPIs and Metrics for Businesses to Track

Misleading statistics and data: how to protect yourself against bad statistics

How to use psychographic data in your marketing strategy
Beyond vanity metrics: Net Promoter Score (NPS) and Customer Referral Rate (CRR)

A starter guide to a CX metrics program

13 marketing metrics you need to track
Most recent
- SEP 25What SOC 2 taught a small team about trust
- SEP 15The AI race: progress, humanity, and trust
- SEP 9The good advisor
- AUG 11Beyond simple sign-ups: how True Trials and Activation predict growth
- JUL 7Why business leaders miss important trends in their dashboards
- JUN 19The best chart for the job: Visualizing data for non-technical users