

Summary - The top 6 KPIs to track your e-commerce offerings, measure the health of your business, and use your data to make insightful decisions.
Quick take
- Cart abandonment still predicts lost revenue. Track your checkout funnel and test fixes like shipping clarity and payment options.
- CAC/CPA by channel is critical. Pair with LTV to watch your LTV:CAC ratio.
- Traffic source mix guides budget. Use GA4 Default Channel Grouping and UTM standards.
- E-commerce conversion rate shows efficiency. Track by device, channel, and product category.
- Product affinity powers bundles and cross-sell. Measure AOV uplift from affinity placements.
- Customer lifetime value proves unit economics. Monitor by cohort and campaign.
One of the most important and valuable business assets today is data. And companies have a lot of it. As organizations leverage that information using reporting and business intelligence tools, aligning company goals with the data is crucial to improving your business. Key performance indicators (KPIs) are a great yardstick to use to compare actual performance against goals.
One of the most data-rich areas of an enterprise is its e-commerce. With the significant influx of data from online purchases, however, it can be challenging to identify what data to look at and what KPIs should be applied to that information. Here are six of the most important KPIs to track your e-commerce offerings to measure the health of your business and use your data to make insightful decisions on how to improve.
Here are the top 6 KPIs for enterprise e-commerce:
1. Shopping Cart Abandonment
Shopping cart abandonment should be a term familiar to anyone with an e-commerce presence. It’s the percentage of orders where a customer has placed items into their cart and then, for whatever reason, failed to finish their purchase.
It’s not surprising that different industries experience different levels of cart abandonment. For instance, anyone who has spent time daydreaming about a vacation and checked out the cost of flights will understand why the cart abandonment rate for airlines in 2018 was 87.7%.
What might surprise you, however, is that retail’s abandonment rate is nearly as high at 74.6%.

Understanding the benchmark for your industry can help you set a goal for your cart abandonment KPI. Are you currently above what’s expected in your industry? Are you below it, but you want to improve that number even further? Viewing your cart abandonment data against your performance indicators will point you toward evaluating the tactics needed to reach those goals.
2. Cost per Acquisition
Cost per acquisition (CPA)—also called Customer Acquisition Cost (CAC)—is an important metric for both traditional brick and mortar stores and for e-commerce. Knowing how much it costs you to get a customer in through the digital door is important for a number of reasons.
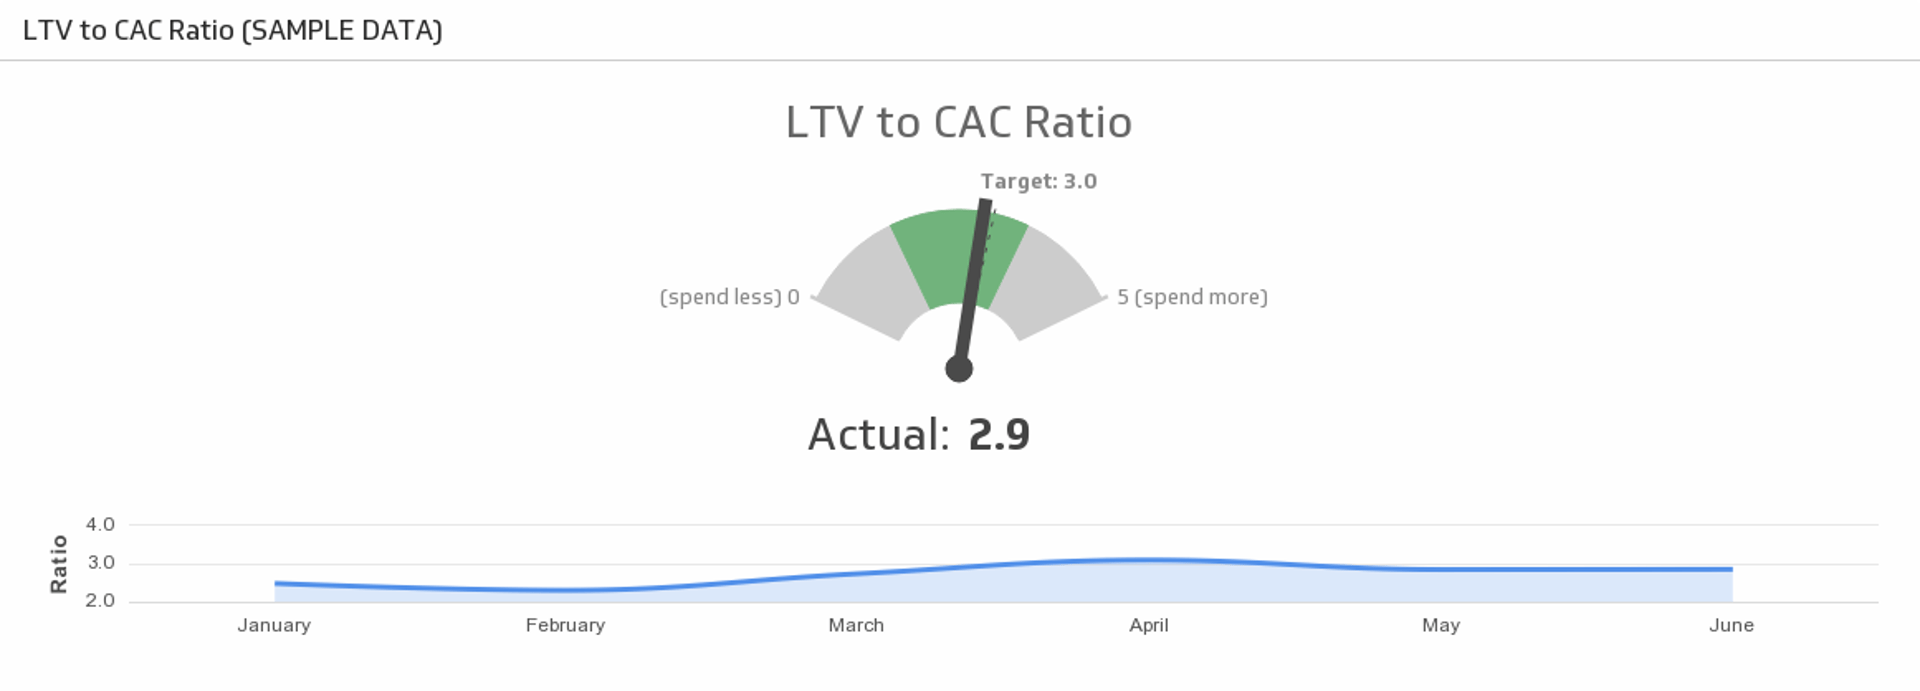
First, and most obvious, is simply understanding what a customer costs you. This metric can branch off into a number of strategies that can be important, like pricing and overall brand awareness.
But digging deeper, viewing your cost per acquisition as a KPI can point to a number of interesting and tangential topics. For instance, if your current CPA is high, investigating where you’re getting those customers from can help refine your marketing strategy and ad buy. Are you getting few customers from a high-cost source?
Or is the value of the customers that you get from your most costly acquisition strategies offset by their spend? Combining your CPA with additional metrics will help you understand if your most expensive channels are also your most valuable or not.
3. Traffic Source
Knowing where your traffic comes from is an important metric for e-commerce. Your traffic source metric indicates how your customers are getting to you, including organic and paid search, from campaigns, and so on. They can even point to the devices used to access your site, like mobile vs desktop computer or laptop.
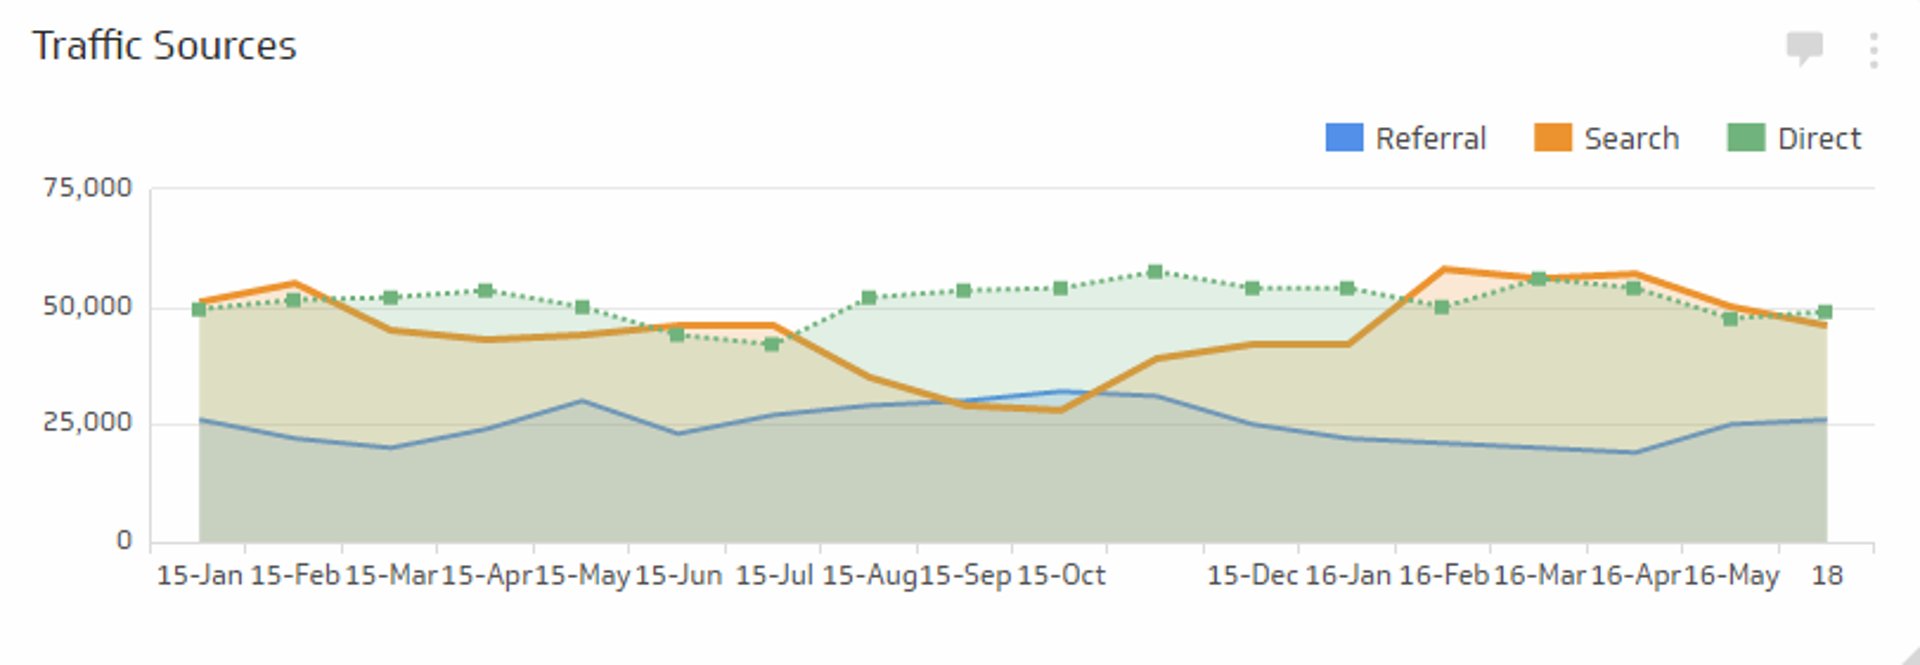
Understanding this metric seems simple. You want to know what your most valuable source of customers is, and traffic source will point to that information. Yet without context, it can be a misleading indicator.
For instance, you may get 40% or more of your traffic from organic search, which is a common traffic rate. And who doesn’t love free traffic? The question is, how valuable are those visitors? You’ll need to combine it with another metric, like conversion rate, to answer that.
Setting a KPI against traffic source alone, however, is still a meaningful exercise. It can tell you how different channels perform for you, like email vs social media vs organic search, and give you a measure to understand positive or negative performance based on changes you make to channel strategy.
4. Conversion Rate
At a basic level, e-commerce conversion rate is the number of purchases divided by the number of sessions or visitors. For e-commerce, that might seem straightforward. Yet you can also set performance indicators for micro-conversions that precede a sale, like add-to-cart or checkout started.
Digging into your data, say you discover a trend in visitors making a large purchase after their third visit to your site. Setting a KPI for conversion rates for the number of customers on their third visit would tell you if this is a valid measure or not.
And, if it is, you can begin a strategy to test both why and how that happens. Is there something special about the third visit? Do all the visitors initiate their first visit from the same campaign? Looking deeper at what conversion rate is trying to tell you can help to dial in sales even further.
5. Product Affinity
Product affinity can be an enormous asset for e-commerce businesses. Affinity tells you what products are frequently purchased with others, and a KPI against product affinity will indicate the number of sales you’re seeing based on affinity-like purchases.
To picture affinity sales on your site, think about the example of Amazon. A lot of the content on their product pages is actually affinity related. Not only do they recommend other products that customers have also looked at, they offer bundles of products to go together, making it easy to add three similar items to a cart instead of just one.
Measuring affinity performance can give you a window into your upsell opportunities. How much more do affinity product purchases increase basket amounts? What’s the overall value in affinity product recommendations, and can you move the needle to increase that with suggestions, remarketing, or email follow-ups?
6. Customer Lifetime Value
Customer Lifetime Value (CLV) is a combination of a few other metrics and a number that you’ll clearly want to see increase. It’s the amount of revenue a company realizes from a customer over time after subtracting the cost of acquiring that customer.
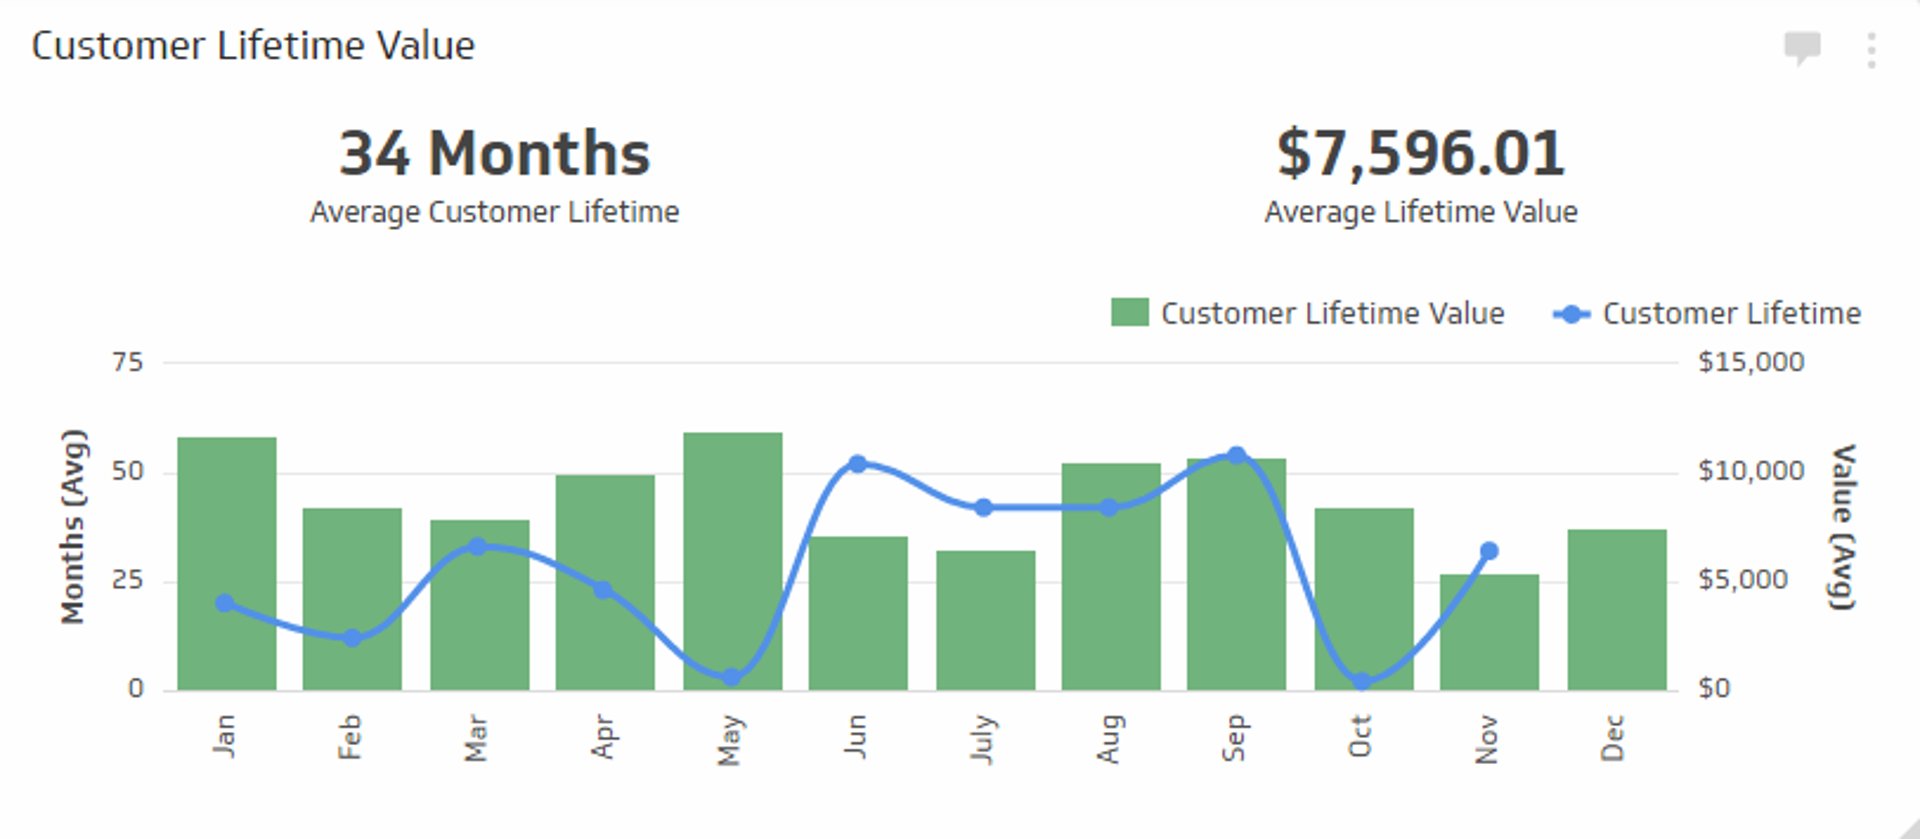
While the L in CLV stands for lifetime, it can actually be a value defined specifically for your organization. Do you only care about the value over the first 12 months after acquisition? Lifetime should equal that time period then.
What’s important here is what CLV can tell you as a KPI. If your CLV is particularly low, start by looking at what your cost to acquire a customer is, how frequently your customers become repeat purchasers, or what your typical order size looks like.
If your CLV is high, gaining insight into why that is can help keep it high, or push it to increase. Is it high because of an initial large purchase? Over time, your CLV will start to drop if you continually chase new customers. With a KPI on your CLV you can monitor its movement over time so that corrections can be made before it’s too late.
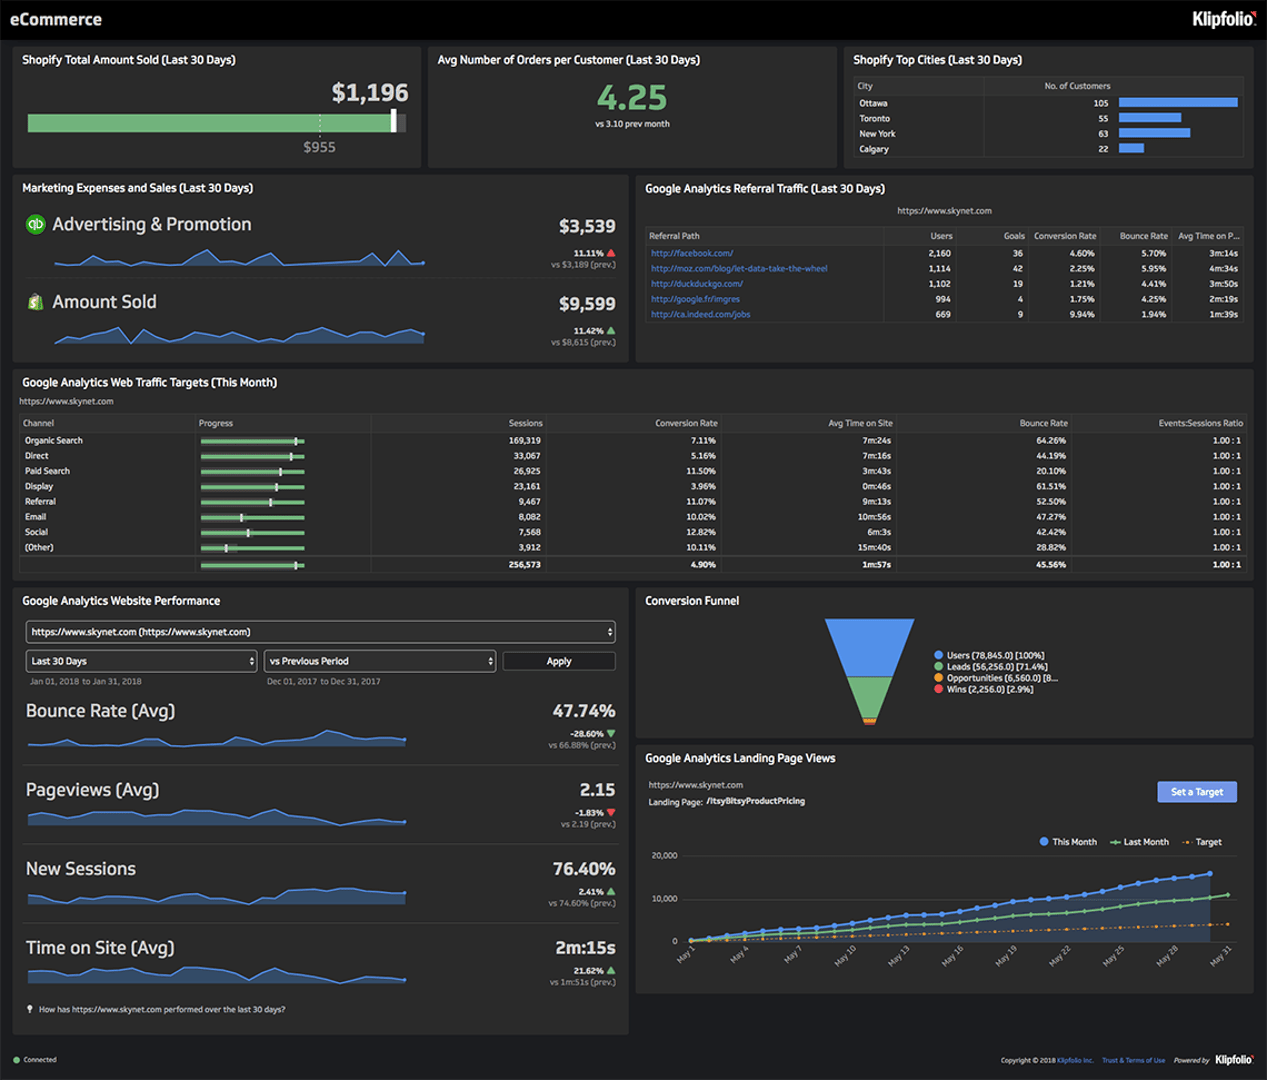
Using these six indicators, enterprises can look to improve both the customer experience and the performance of their e-commerce. Tools like Klipfolio Klips make it easy to visualize your e-commerce data and understand opportunities for improvement so that you can make data-driven decisions to increase your e-commerce performance and value.
Next step
Build an e-commerce dashboard in Klips and share it with your team in minutes.
Related Articles

5 tips to understand (and organize) your restaurant data
By Saleem Khatri — June 9th, 2026
6 dashboards I use daily to run my SaaS company
By Allan Wille, Co-Founder — April 10th, 2026
Business Metrics vs. KPIs: What’s the Difference?
By Jonathan Taylor — March 13th, 2026
