
Summary - Updated for 2026: the essential SaaS engineering metrics to track, from flow and quality signals to DORA delivery, SLIs/SLOs, and cost-to-serve.
Every SaaS engineering team monitors metrics. But it is critically important to know which metrics to monitor. Base your decisions on the wrong ones and you can veer off course very quickly.
In this blog post, we share our thoughts (based on our experience) about the most important metrics SaaS engineering teams should monitor.
We believe those metrics should all share one very important characteristic: They should be the ones team members use actively - metrics that help people do their job, fulfill their mandate and solve problems.
Monitor the right metrics, and you will improve customer experience, speed up time to market, and make team and process management easier - all of which are important in the fast-paced SaaS (software as a service) world, with multiple releases to production each day.
For maximum efficiency, it is equally important to know what not to monitor. Management-imposed vanity metrics that don’t help the teams or provide valuable information should not be monitored.
Here, based on our experience, are the most effective things for SaaS teams to monitor:
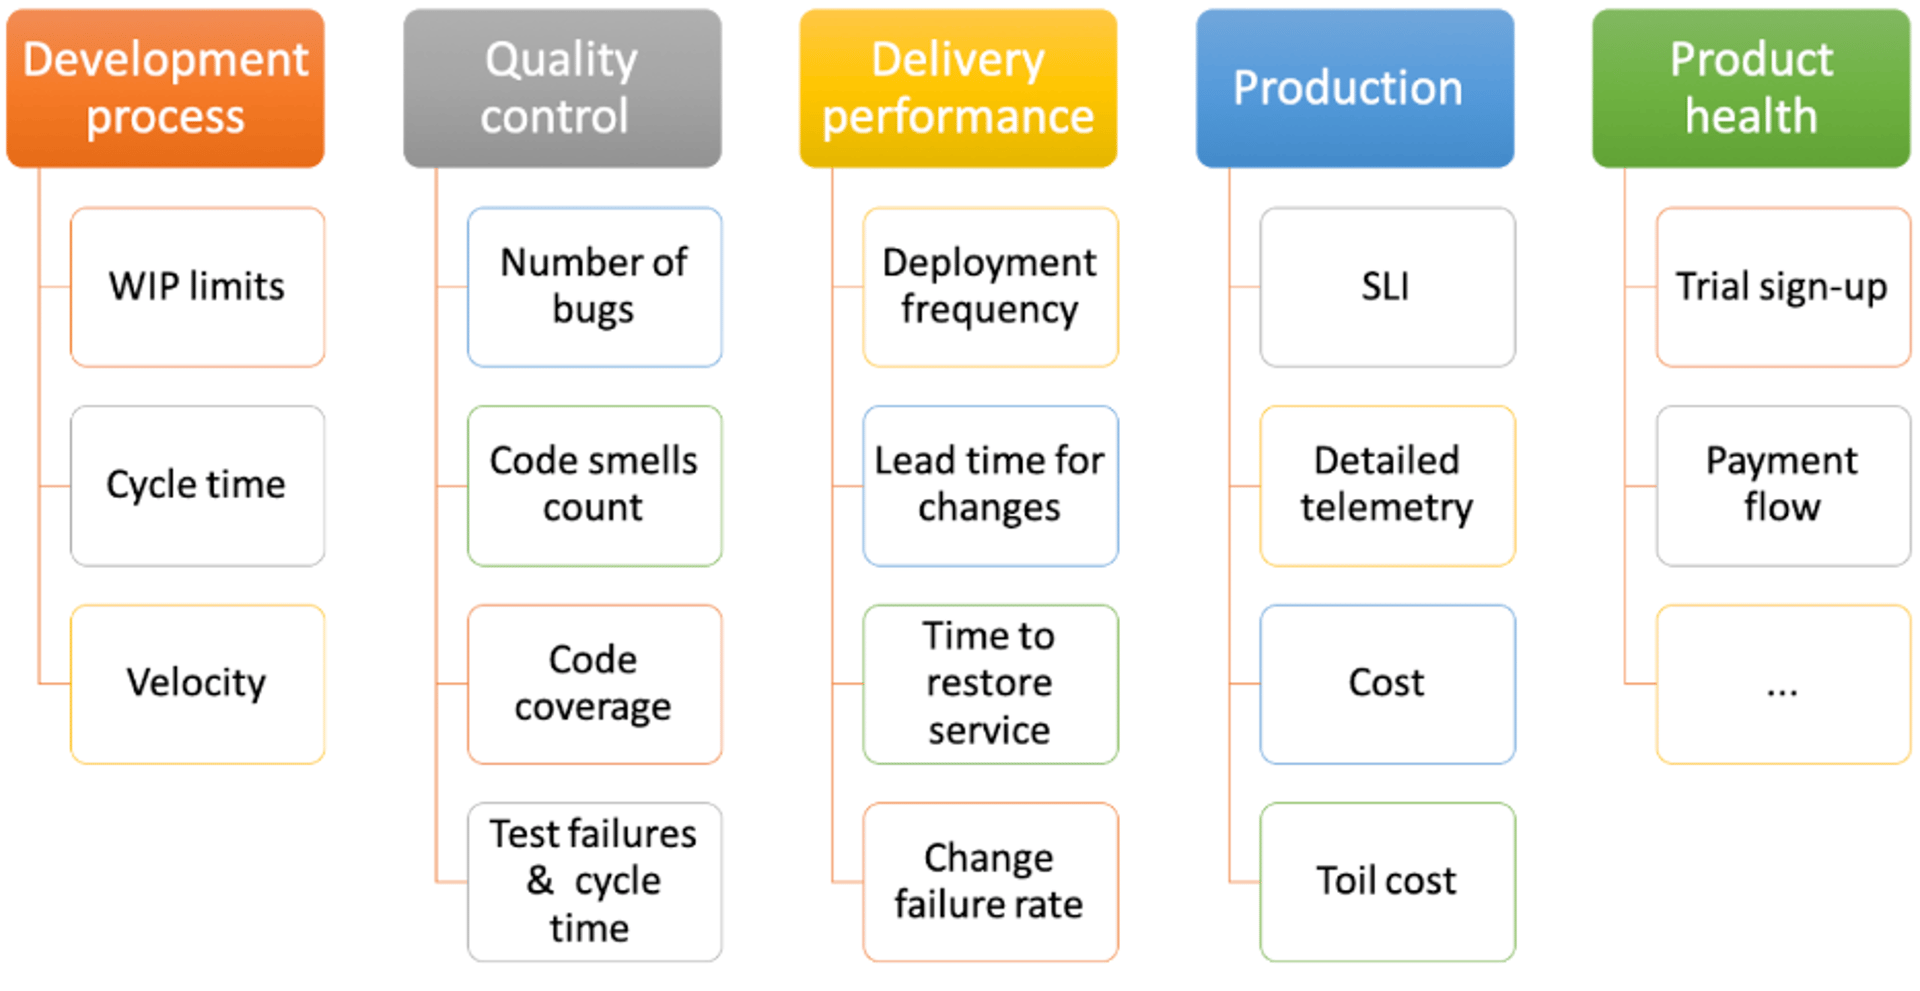
In the software development process:
- WIP (work in progress) limits: The concept of limits to work in progress has its roots in lean methodologies and Kanban. It involves the limits you set for the number of items that can be in any state of your production cycle (for example, in code review state). Monitoring this metric for your team can allow you to identify any bottlenecks in your process and address them. As an example, your team might be producing a lot of new code but the code changes are blocked from going to production waiting for code reviews or quality assurance. If that’s the case, your team needs to stop writing more code and rally around getting the code that’s been already written released.
- Cycle time: This is the time it takes to get a task done, from the moment it is undertaken to the moment it’s completed. You can monitor cycle time for each process step or each team. For example, by monitoring the cycle time of each user story, you can answer the question of how long, on average, it takes for your team to do code reviews or feature verification. You can see some specific examples of this later in the post. Read more about why Cycle time is important.
- Velocity: This is one of the most common metrics scrum teams use to identify how many units of work (i.e. story points) they can get done in each sprint. Velocity helps with planning and predictability. Caution! Using velocity as a metric to manage developers’ performance is a bad idea and can lead to bad behaviours.
To control quality:
- The number of bugs: An Agile team should always keep an eye on their bug pool. It is easy, and sometimes demanded by stakeholders, to only focus on feature development and go after the next shiny object. However, you have to always know where you are with respect to quality. You should segment this metric by components and/or services, severity (critical, major, normal), type (performance, usability, security) and any other dimension that helps teams prioritize them and find where the big clusters of bugs are and where they need to focus. We also recommend that teams have a threshold for the number of defects found at any one time, and stop feature development when they pass that threshold. Ideally, each sprint starts with fixing any recently introduced bugs before feature development starts. Some teams go as far as having a zero known bug policy.
- Code smells count: Code smells “are certain structures in the code that indicate violation of fundamental design principles and negatively impact design quality.” Teams often use static analysis tools such as Spotbug and Lint to find anti-patterns or syntactical defects. This is often the cheapest way to avoid bugs, since developers can catch them very early in the development cycle, even as soon as they type the code in their IDE (integrated development environment). The static analysis tools allow you to choose and define the rules and patterns that allow the tools to flag the issues. In an ideal scenario, your team is aligned on these rules and the tools find no issues in your code base. However, in some cases, especially if you are just introducing these tools to a team or if you are dealing with legacy code, finding no issues at all will not be an option. In such cases, you have to have a target and strive to reduce the code smells. Note that these tools can often be noisy if they are used with the default rules, so we highly recommend you align on a set of rules that make sense for your context, and tune the tool accordingly.
- Code coverage: Also known as test coverage, code coverage is the number of lines or branches in the code that are covered by your automated tests when the tests are run. Note that code coverage is only a valuable metric if your team knows how to write good tests. It’s easy to have high code coverage without getting any value from those tests. (Here’s a great post to read on this topic.) So if your code coverage is 0% you have a problem, but even if it’s 100% you can’t claim you’ll be shipping code without bugs.
- Test failures: The count of test failures segmented by tests or suites is an important metric to monitor when you get into relying on test automation. For those of you who have been through that journey, you know about test stability; intermittent failures can always be a challenge. How to solve them? Monitor which 20% of the tests are responsible for 80% of the failures and tackle the root cause of the failures, whether it’s flaky tests or product code, or environmental issues.
- Tests and test suites execution cycle time: Tests are great, but don’t forget that the main reason you have them is to give developers quick automated feedback, help everyone save time and ship high-quality code faster and more quickly. So if your target is to ship to production multiple times a day, which it should be if you want to be a high-performing team, you obviously can’t have a test suite that takes hours to run. Track the cycle time for your tests and test suites and improve them to meet your targets.
To optimize software delivery performance
The following four metrics are all from the Accelerate State of DevOps by Google. We keep it short here, but we highly recommend you read that report and perform a self-assessment against the benchmark performance groups (elite, high performers, medium performers and low performers). We’ve been following this report for years now and have been measuring our progress. This benchmark has definitely helped us better understand the impact of software delivery on business outcomes and developer happiness. Set the bar high and aim to be an elite team!
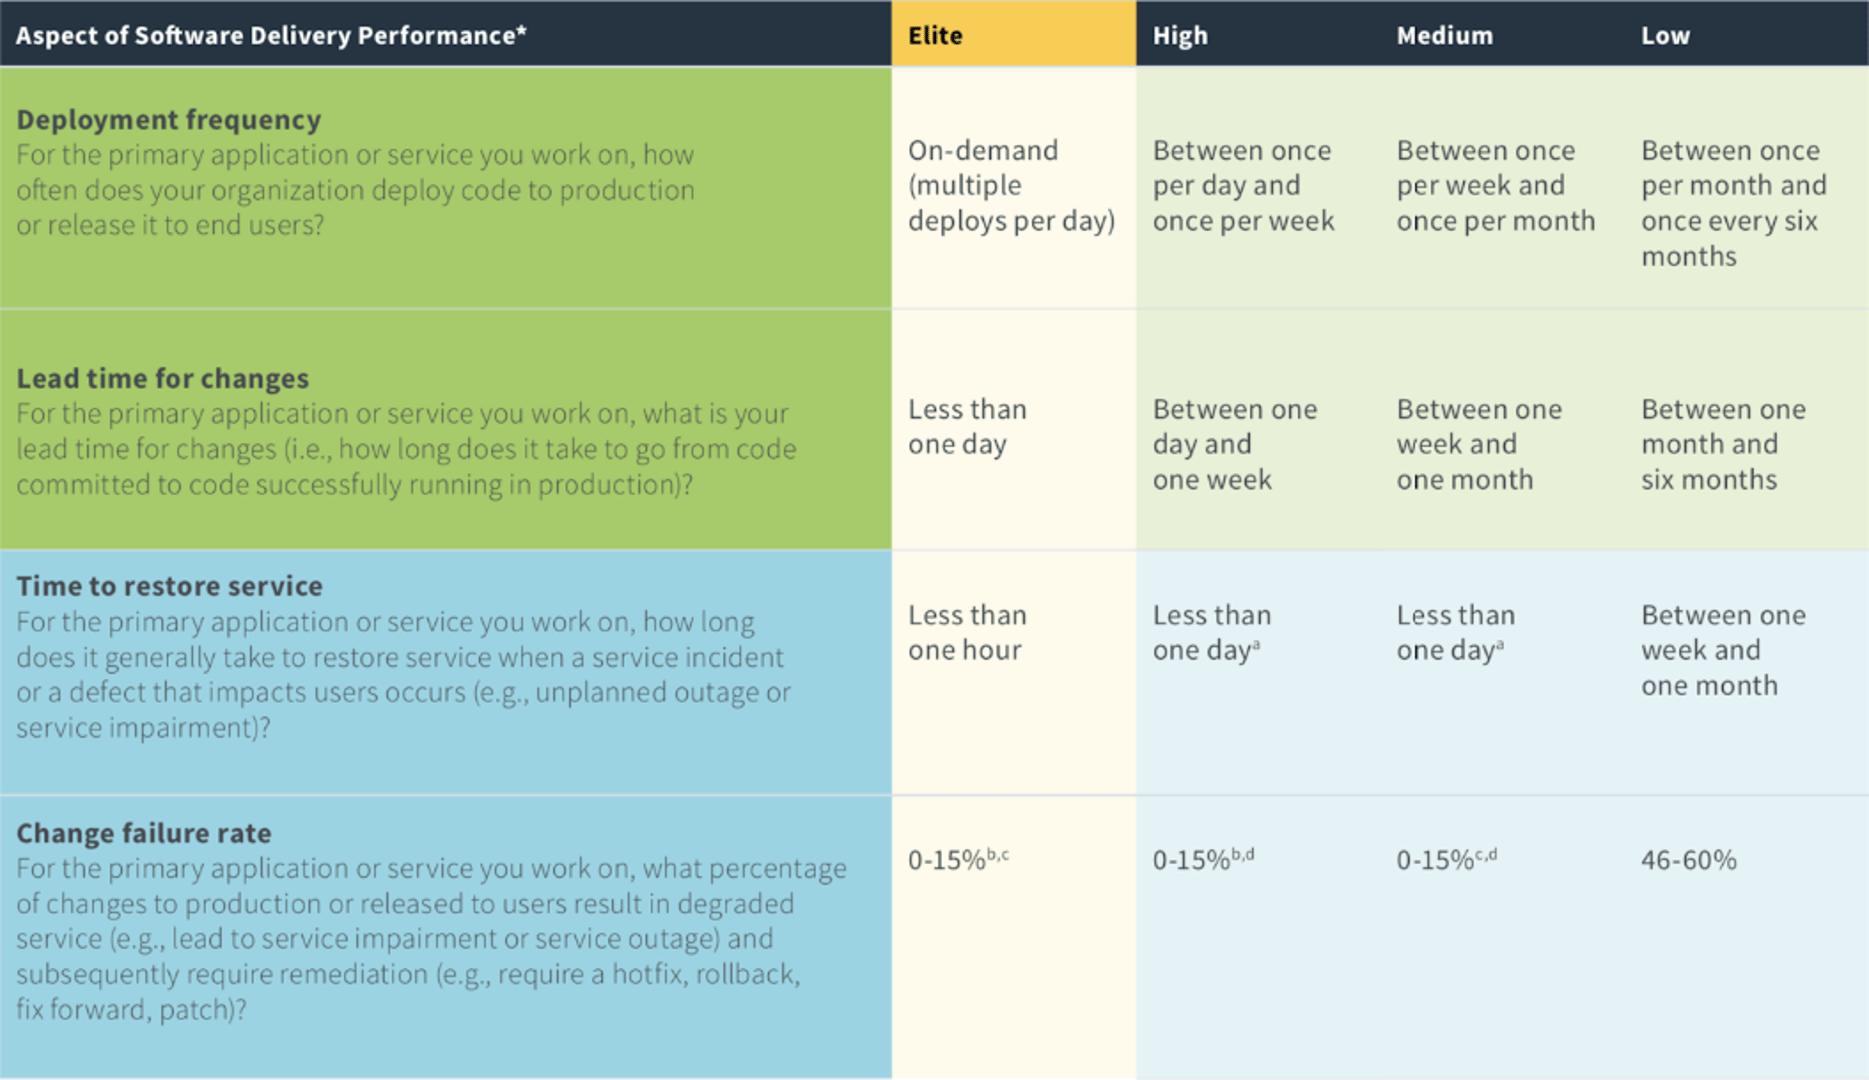
The above figure was copied from Accelerate State of DevOps report 2019
To measure production metrics
SLI, or service level indicator, is a numerical measurement of service health that shows whether the service level objective is being met. This is a key metric that you need to measure, especially if you are moving towards a site reliability engineering model as advocated by Google. Read more about SLI, SLO, and SLA.
SLI is basically the more sophisticated version of uptime in the age of microservices and the complexities that come with it. Tracking whether a service is up or down is no longer the right measure for cloud services, because if architected correctly, the service ideally never completely goes down, but rather degrades. Depending on the service and what’s important for service users, SLI may track response time, error rate, job execution lag or a combination of those.
The teams that use SLIs often take action when their SLIs drop below a certain threshold. If the drop is significant and has major customer-facing implications, the event is treated as a production outage and dealt with immediately. For a less significant but observable drop, and when the root cause is something like response time or job execution lag that requires long-term attention, the teams often choose to reduce feature development investments to resolve the issues that are causing the SLI to drop.
Note that, for each service, you need to have the next level of telemetry and metrics such as CPU and memory usage, connection pool, etc., that help you understand the root cause of the issues and observe all the characteristics of the service. SLI is your highest-level metric for the service, but it is not the only one.
- Cost aka Cloud Sprawl: Monitoring production cost and having an understanding of how much you are spending per service and per customer is very important. It is very easy in various cloud services to keep seeing your bill go up and not understanding exactly where the money is going. Having the right tooling and the ability to focus on this metric to analyze the money you are spending by services, geographical regions, and other dimensions will help you make sure you are not wasting your money. This is key to keeping your spending under control and making sure it’s proportional to business growth.
- Toil cost: This is the time and effort spent on doing toil, which is defined as manual, repetitive, automatable and reactive tasks. As the team and the complexity of infrastructure grows, the time spent on toil also grows, unless the team consciously monitors those tasks and takes them down one by one. Toil to a production engineering team is like technical debt to a feature team. If you don’t tackle it, then before you know it, that’s all you are dealing with and you can’t move your strategic goals forward. So monitor toil cost closely. Define your capacity for toil and systematically eliminate it.
To monitor product health
All software products have a set of major flows. These flows are the steps that users go through to achieve an important goal. They often have a significant impact on the user experience and, therefore, the business. When you run a SaaS software team, you should pay attention to the health of these flows and have metrics for monitoring their health. You want to stay close to how production releases impact major flows. Here are a couple of easy examples that are typically critical:
- The number of trial sign-ups: A SaaS offering usually has a consistent number of trial sign-ups coming into its app (a.k.a top of the funnel). Understanding the usual patterns in this number and flagging unusual trends and anomalies is important.
- The number of errors in payment: Some of the errors, like credit card declines, can happen during payment flow. However, you will want to log all the payment flow errors by type and monitor them over time, and again flag any unusual patterns. If payment is not going through, you are impacting the business.
Depending on the nature of your application, ask yourself what are the other major flows that you need to be monitoring. What is the first set of goals that you can’t afford your trial users to fail to accomplish? What are the 20% most critical functionalities of your app that can’t be degraded? Monitor those closely.
We have been monitoring these metrics for some time now, and they have helped us scale the team, build a better product, and keep our customers happier. What are the metrics you and your team use?
Ali Pourshahid, Ph.D., is the VP of Software Development at Klipfolio. He can be reached at @ali_pourshahid.
Related Articles

5 tips to understand (and organize) your restaurant data
By Saleem Khatri — June 9th, 2026
6 dashboards I use daily to run my SaaS company
By Allan Wille, Co-Founder — April 10th, 2026
Business Metrics vs. KPIs: What’s the Difference?
By Jonathan Taylor — March 13th, 2026