Enterprise-Value-to-Revenue Multiple (EV/R)
EV/R compares a company's enterprise value to its revenue, giving investors and analysts a reliable valuation baseline even when profitability metrics fall short.
Enterprise-Value-to-Revenue Multiple
Enterprise-Value-to-Revenue Multiple (EV/R) tells you how much investors are paying for every dollar of revenue a company generates. It's one of the clearest signals of how the market values a business relative to what it actually earns.
When other profitability metrics fall short, such as when a company is pre-profit or has negative EBITDA, EV/R gives investors and analysts a reliable baseline for comparison. It's widely used in early-stage company valuations, acquisition analysis, and cross-company benchmarking.
What is Enterprise-Value-to-Revenue Multiple (EV/R)?
Enterprise-Value-to-Revenue Multiple (EV/R) is a valuation metric that divides a company's enterprise value by its annual revenue to show how much the market values each dollar of sales.
EV/R is also called the EV/Sales multiple or enterprise value-to-sales (EVS) multiple. It's used by investors and analysts to assess whether a company is fairly priced, and by acquirers to estimate what a target business is worth. Unlike metrics that rely on profitability, EV/R works even when earnings are negative, making it especially useful for high-growth and early-stage companies.
Why EV/R matters
EV/R gives you a quick, comparable read on valuation across companies, regardless of their cost structure or profitability stage.
Most valuation metrics require positive earnings. EV/R doesn't. That makes it one of the few tools that works across the full spectrum of companies, from a pre-profit SaaS startup to a mature industrial firm. For anyone making a financing decision, assessing an acquisition target, or comparing investment options, EV/R surfaces something the income statement can't always show: how much confidence the market has in a company's revenue trajectory.
A higher multiple signals that investors expect strong future growth. A lower multiple may indicate the company is undervalued, or that the market sees limited upside. Neither interpretation is absolute. Context, industry norms, and growth rate all shape what a "good" EV/R looks like.
Tracking EV/R alongside such financial metrics as Return on Invested Capital (ROIC), gross profit, and net income gives a more complete picture of where a company stands.
When to use EV/R
EV/R is most useful when standard profitability metrics don't apply or distort the picture.
Financial analysts reach for EV/R in a few specific situations:
- Negative EBITDA: When EBITDA is negative, EV/EBITDA is meaningless. EV/R remains usable.
- Negligible profitability: A near-zero EBITDA produces an inflated EV/EBITDA multiple that tells you nothing. EV/R sidesteps that distortion.
- Cross-company comparison: When comparing companies with different cost structures or capital arrangements, revenue is a more stable denominator than earnings.
- Acquisition valuation: EV/R is a standard input when estimating what a target company is worth in a deal.
How to calculate EV/R
EV/R divides enterprise value by annual revenue:
EV/R = Enterprise Value / Annual Revenue
Enterprise value accounts for the full cost of acquiring a business. It includes market capitalisation, total debt, minority interest, and preferred shares, minus cash and cash equivalents.
Example: A company has an enterprise value of $20 billion and annual revenue of $5 billion.
EV/R = $20B / $5B = 4x
A multiple of 4x means investors are paying $4 for every $1 of revenue the company generates. Whether that's reasonable depends on the industry, growth rate, and comparable companies.
How to interpret EV/R
A higher EV/R means the market expects strong revenue growth and is willing to pay a premium for it. A lower EV/R may indicate undervaluation, or simply that growth expectations are modest.
There's no universal "correct" multiple. EV/R benchmarks vary significantly by industry and company stage. SaaS companies routinely trade at higher multiples than capital-intensive manufacturers because their revenue is recurring and margins tend to improve at scale. Comparing EV/R across sectors without adjusting for those differences produces misleading conclusions.
For investors, a lower multiple relative to peers can signal an opportunity. For founders and executives, understanding where your company sits relative to sector benchmarks tells you something about how the market is reading your growth story.
Create custom dashboards for you and your team.
Get started with KlipsEV/R in SaaS and early-stage company valuation
EV/R is the default valuation tool for early-stage SaaS companies, where profits are rare and subscription revenue is the primary signal of business health.
Venture investors and acquirers use EV/R to compare SaaS businesses because it cuts through the noise of variable cost structures and pre-profit operating models. A company burning cash to acquire customers may look alarming on an income statement but attractive on an EV/R basis if its revenue growth rate justifies the multiple.
In SaaS, EV/R is often paired with revenue growth rate and net revenue retention to give a fuller picture of whether the multiple is warranted.
EV multiples vs. equity multiples
Enterprise value multiples and equity multiples measure different things, and that distinction matters when comparing companies.
Equity value reflects what belongs to shareholders. Enterprise value reflects the total cost of acquiring the business, including debt holders. Because EV captures the full capital structure, EV multiples allow comparisons across companies with different levels of leverage, something equity multiples can't do cleanly.
EV multiples also tend to be more stable over time. Equity multiples shift as capital structure changes; EV multiples are less sensitive to those fluctuations. That stability makes EV multiples more reliable for ongoing performance tracking and cross-company analysis.
Commonly used EV multiples
EV/R is one of several EV multiples analysts use. The most common include:
- EV/Revenue (EV/R): Useful when earnings are negative or unreliable. Compares total company value to top-line revenue.
- EV/EBITDA: The most widely used EV multiple for profitable companies. Strips out financing and accounting differences to compare operating performance.
- EV/EBIT: Similar to EV/EBITDA but includes depreciation and amortization, making it more conservative.
- EV/FCF: Compares enterprise value to free cash flow. Useful for capital-intensive businesses.
Each multiple answers a slightly different question. EV/EBITDA is the standard for mature, profitable companies. EV/R fills the gap when EBITDA doesn't apply.
EV/R vs. EV/EBITDA: key differences
EV/R and EV/EBITDA are both enterprise value multiples, but they measure different aspects of a company's financial position.
| EV/R | EV/EBITDA | |
|---|---|---|
| Denominator | Annual revenue | Earnings before interest, taxes, depreciation, and amortization |
| Works when unprofitable | Yes | No |
| Accounts for cost efficiency | No | Yes |
| Best for | Early-stage, pre-profit companies | Profitable, mature companies |
| Common in | SaaS, high-growth sectors | Cross-industry M&A analysis |
EV/R tells you what the market pays per dollar of sales. EV/EBITDA tells you what the market pays per dollar of operating profit. Use EV/R when profitability isn't yet a reliable signal. Use EV/EBITDA when it is.
How to convert EV to equity value
When you need to move from enterprise value to equity value, the calculation follows a consistent sequence:
- Start with enterprise value.
- Subtract total debt, minority interest, and preferred stock.
- Add cash and cash equivalents.
The result is equity value: what the business is worth to its shareholders after accounting for all obligations and available cash. This conversion is a standard step in acquisition modelling and financial due diligence.
Limitations of EV/R
EV/R is a useful starting point, not a complete answer.
The metric ignores profitability entirely. Two companies with identical EV/R multiples can have very different cost structures, margins, and cash generation profiles. A company with a low EV/R but poor gross margins may be a worse investment than a higher-multiple competitor with strong unit economics.
EV/R also varies widely across industries. Comparing the EV/R of a software company to a logistics firm produces no useful insight. The multiple is only meaningful within a relevant peer group.
Use EV/R as one input in a broader analysis. Pair it with margin data, growth rate, and other financial metrics to reach a defensible conclusion about a company's value.
Create custom dashboards for you and your team.
Get started with KlipsTracking EV/R over time
Monitoring EV/R as a time-series metric, rather than a point-in-time snapshot, tells you how market sentiment around a company is shifting. A rising multiple can signal growing investor confidence in future revenue. A falling multiple may reflect slowing growth expectations or broader sector repricing.
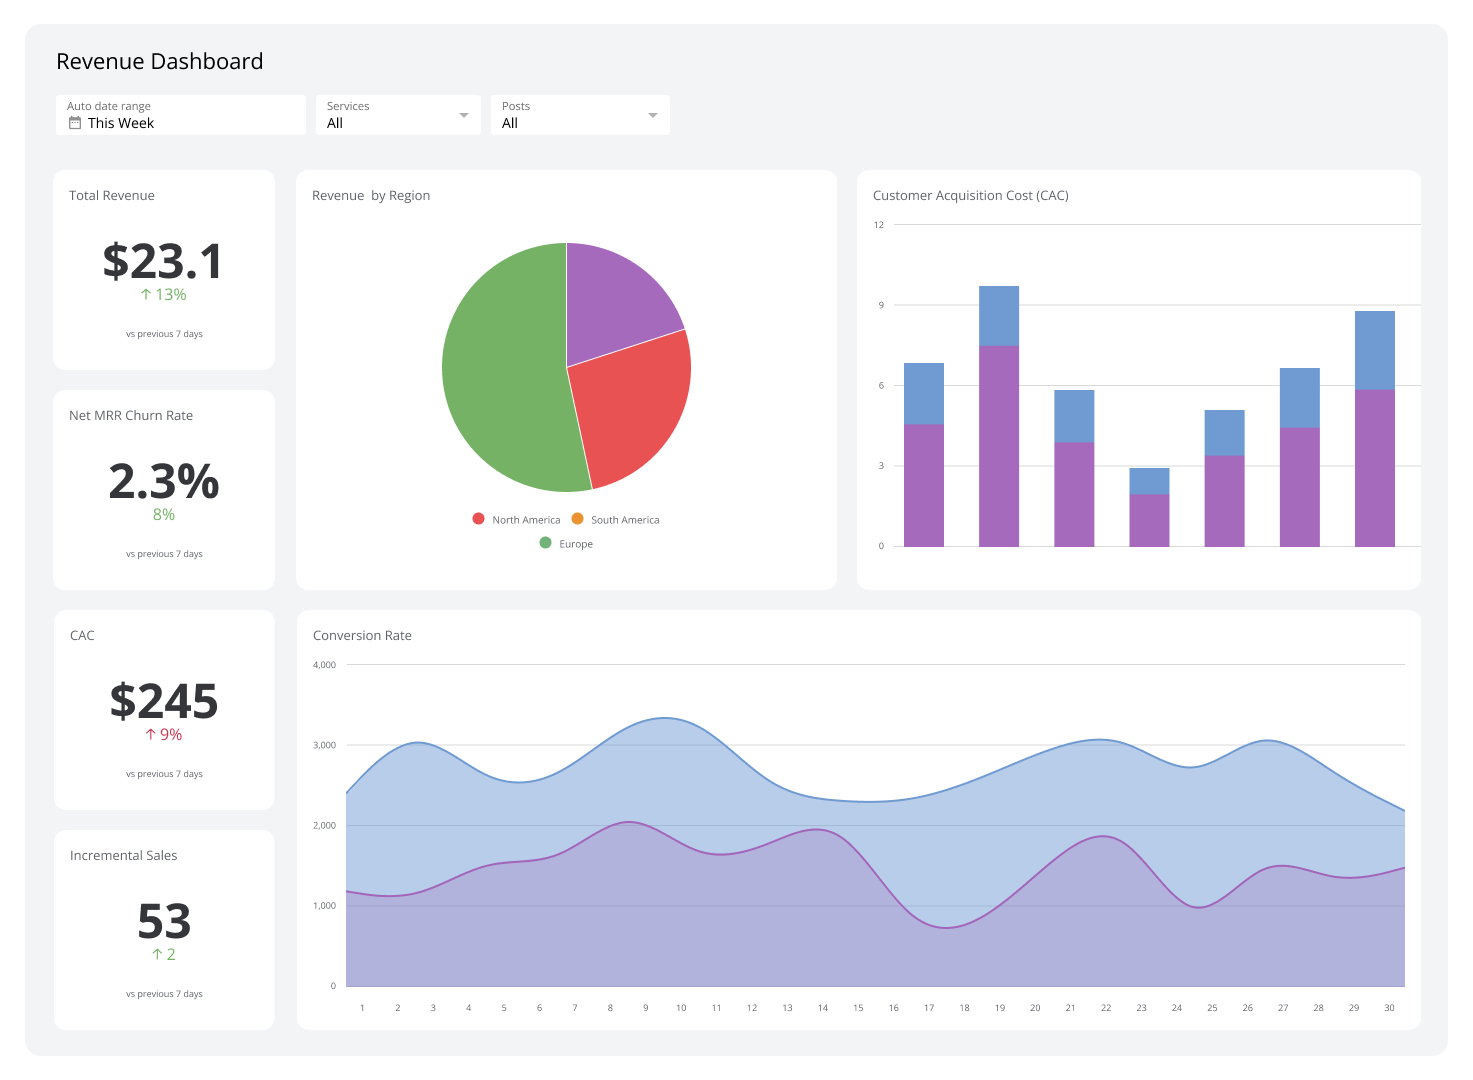
For finance teams and executives, tracking EV/R alongside revenue growth rate and other financial KPIs on a shared dashboard means everyone is reading from the same numbers. No one has to paste figures into a spreadsheet or explain the business context from scratch before a conversation can start. The answer is already there.