Email Marketing Dashboard
Take a data-driven approach to your email marketing campaigns.
What is an email marketing dashboard?
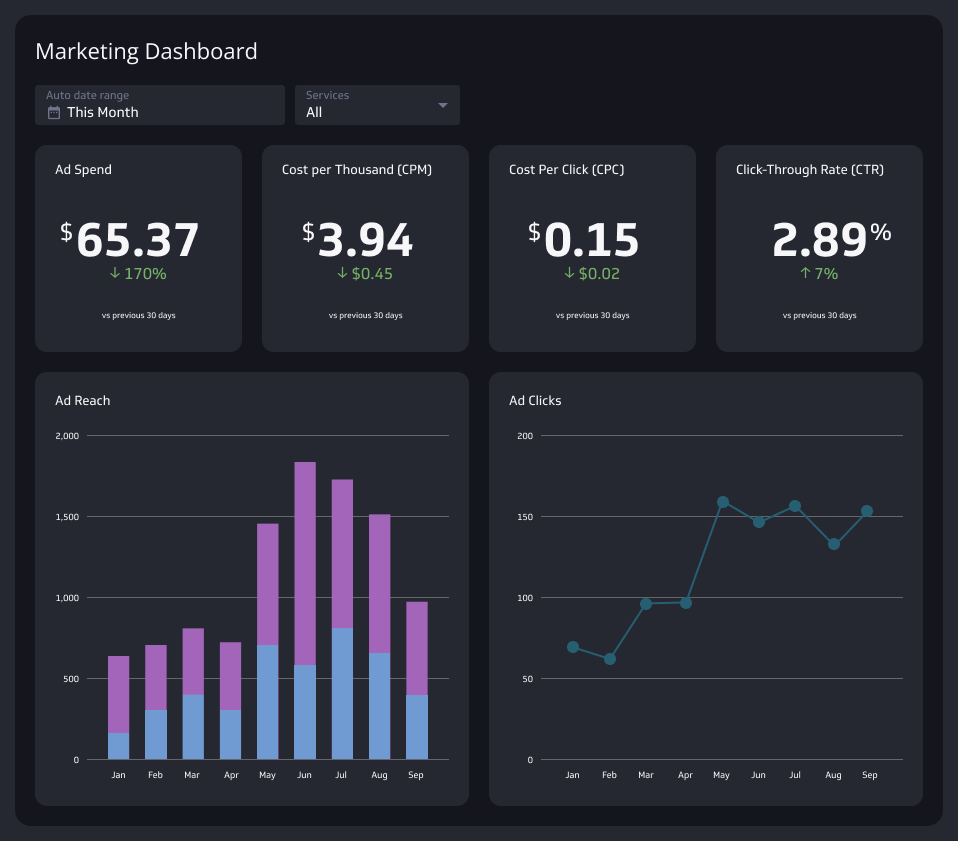
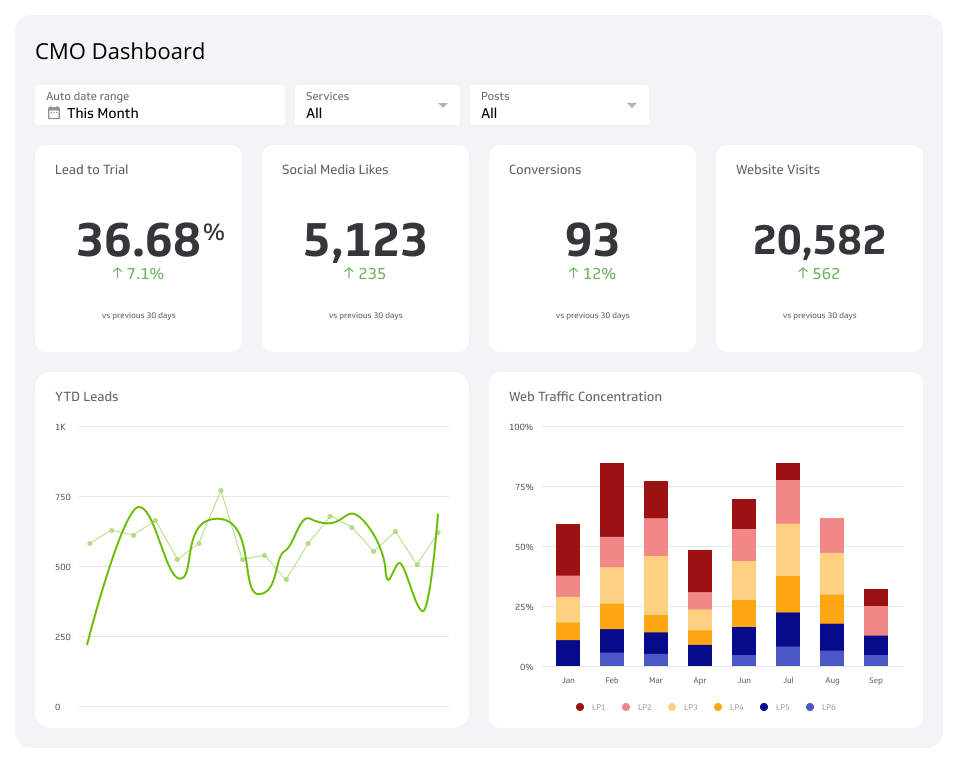
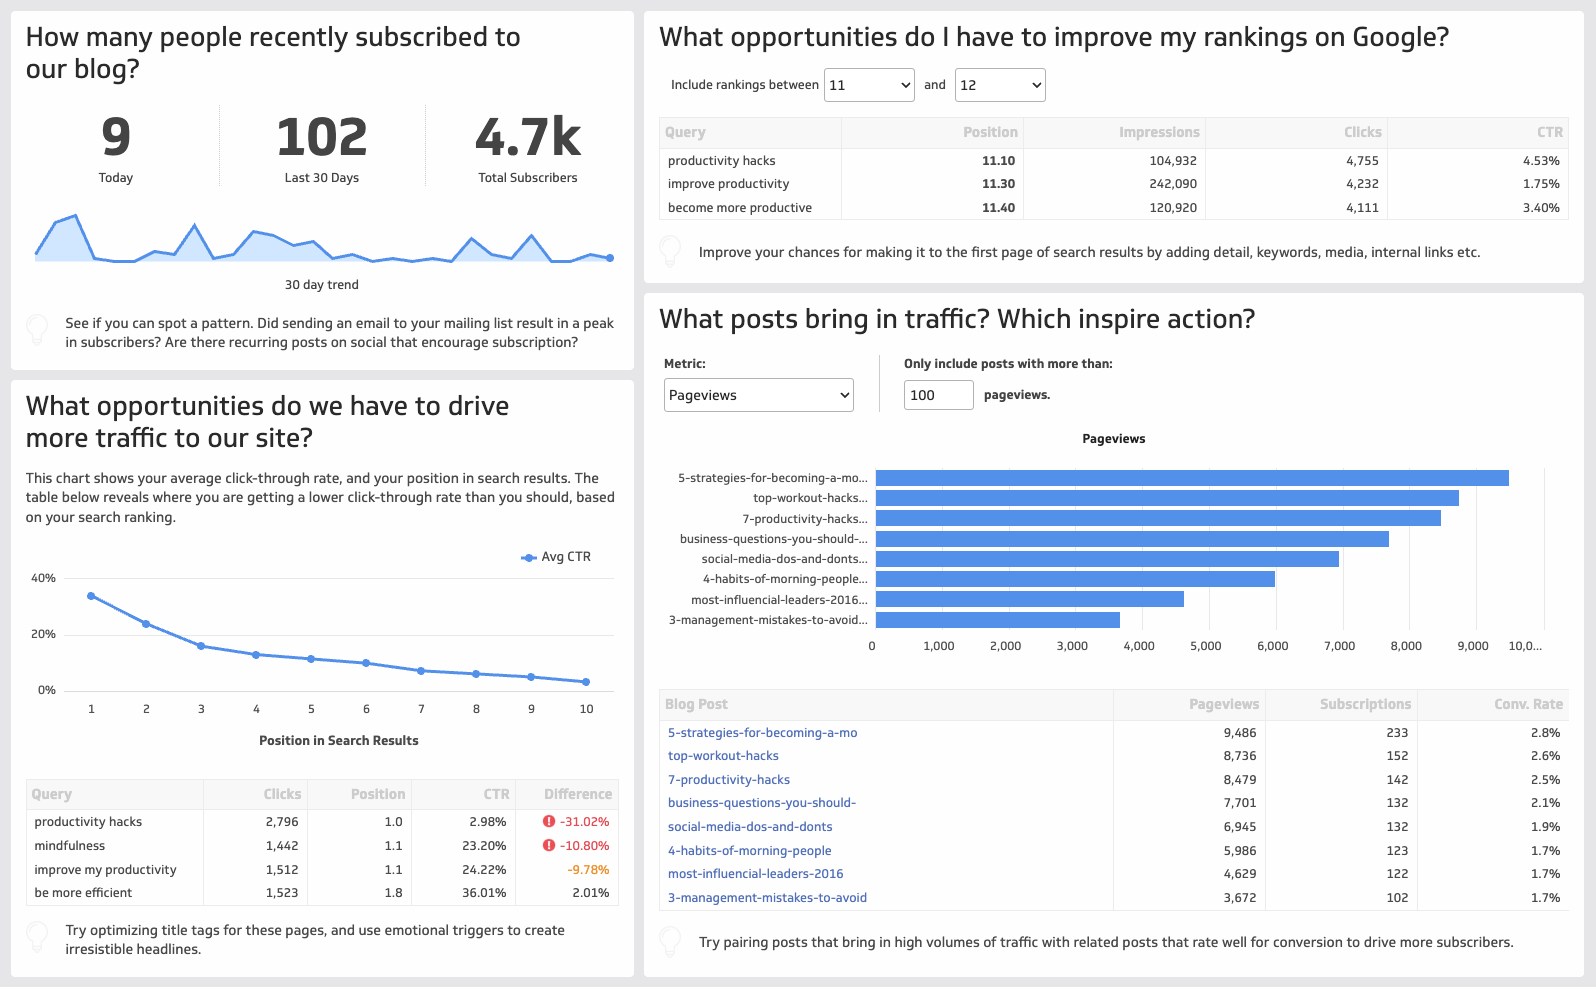
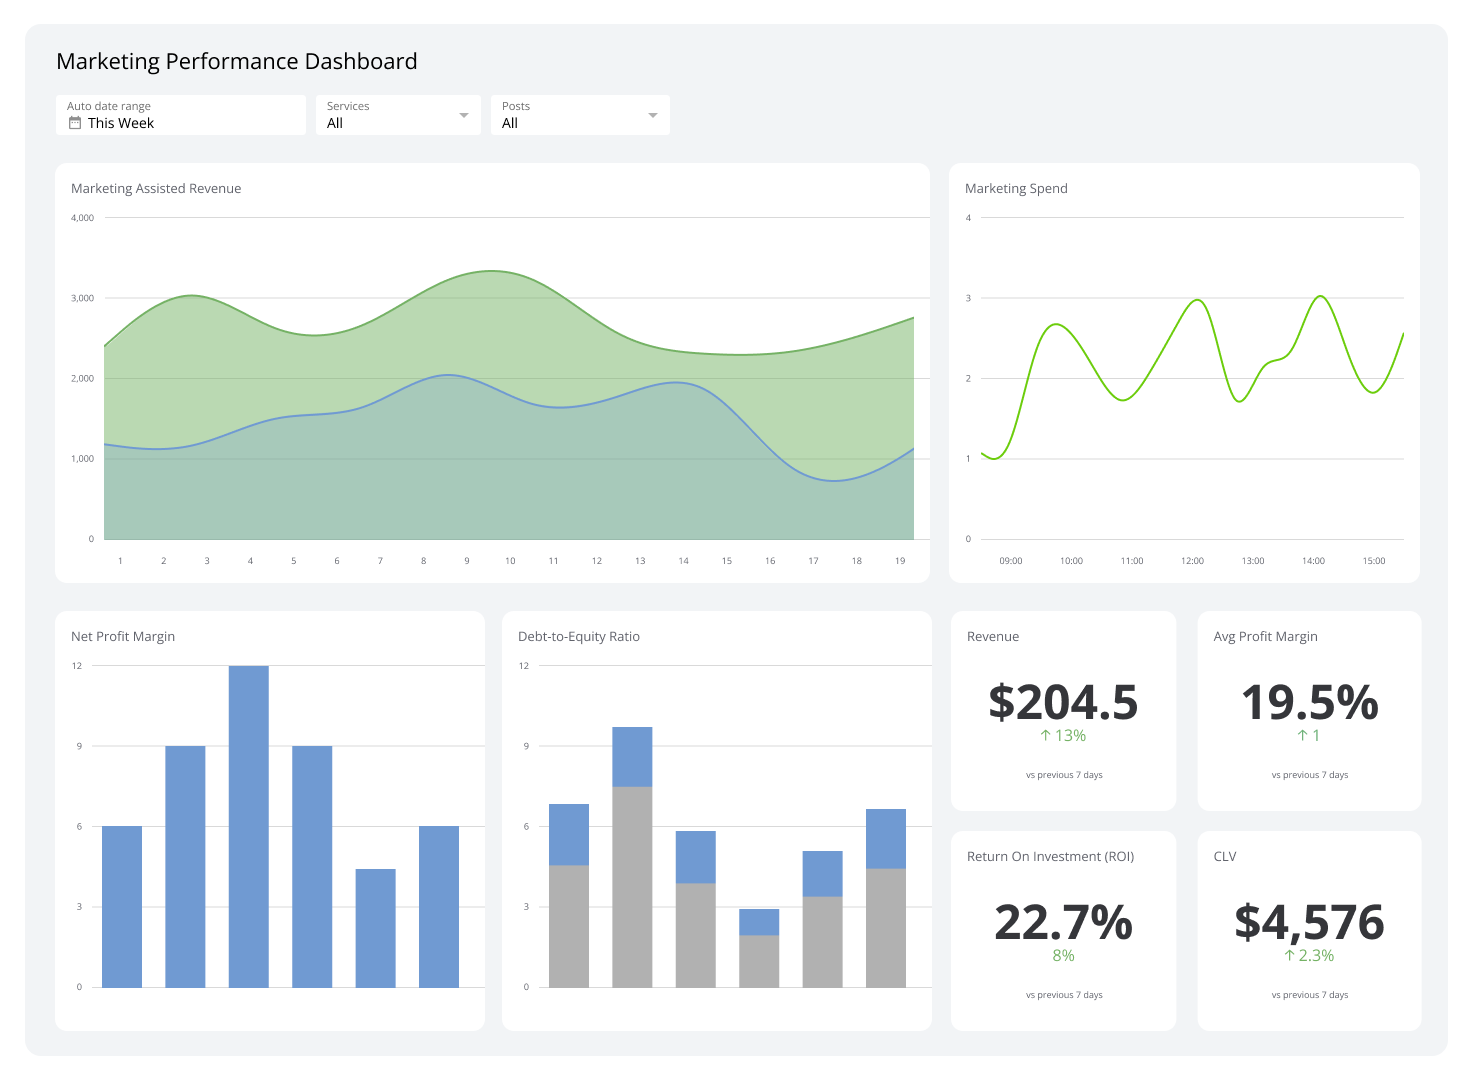
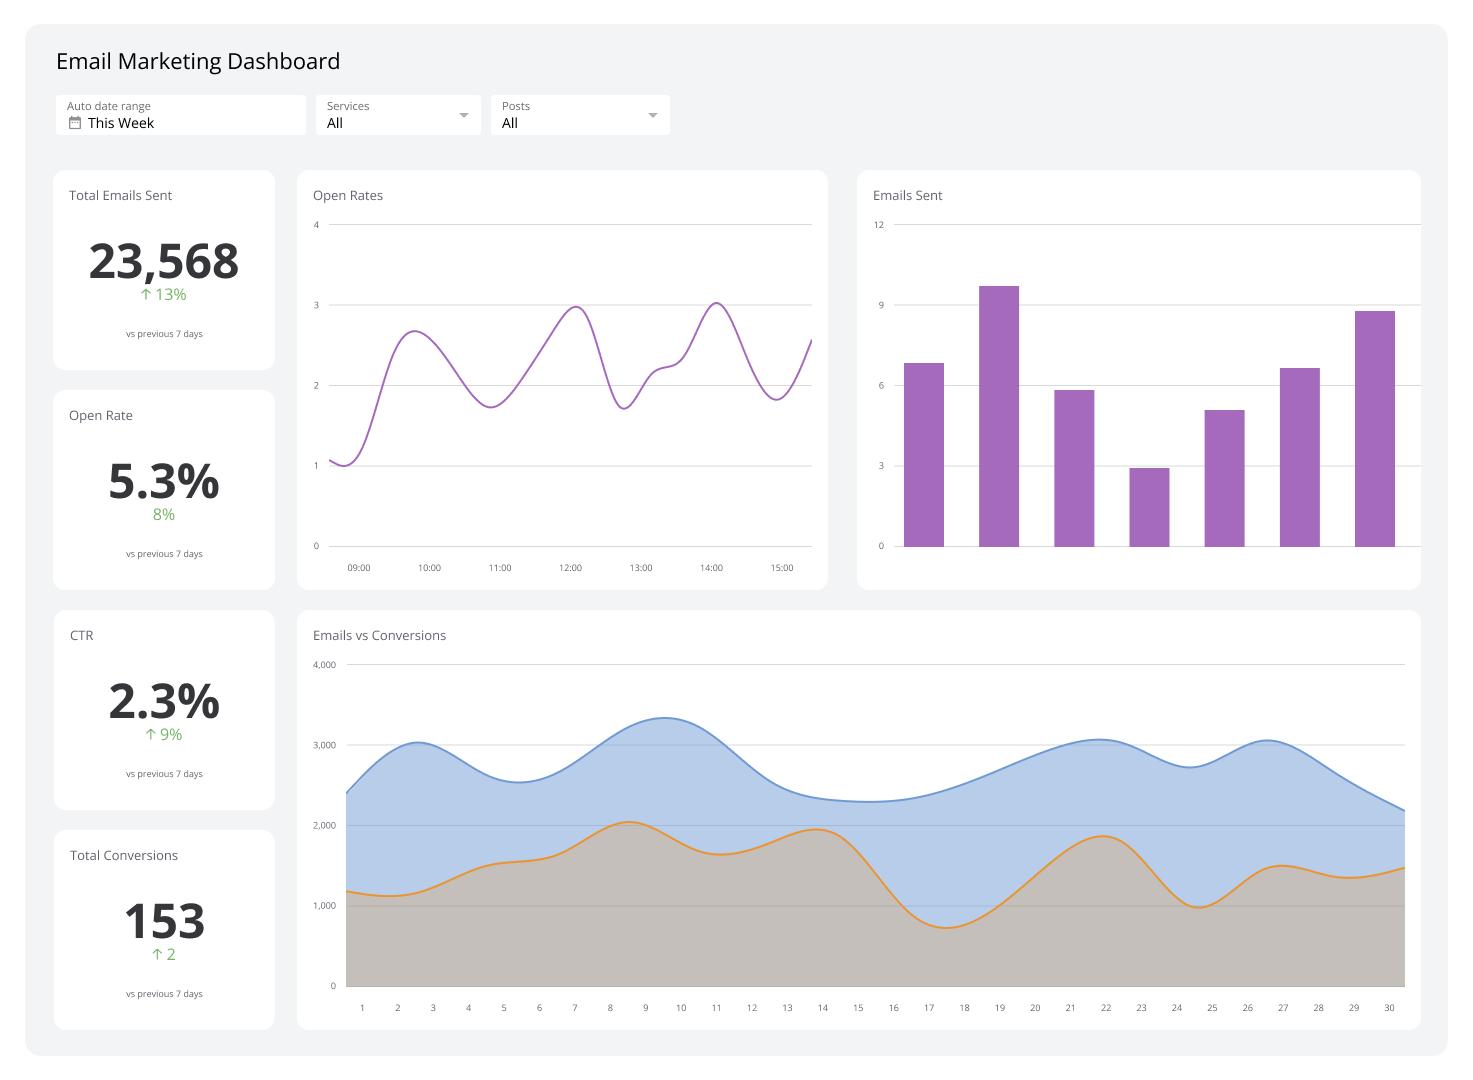
An email marketing dashboard is a centralized view of your email marketing campaigns, showing key performance indicators (KPIs) like opens, clicks, conversions, and revenue in one place.
Most email teams are pulling data from at least three places: an email service provider, a web analytics tool, and a CRM system. Without a dashboard, that means manual exports, mismatched numbers, and decisions made on yesterday's data. A well-built Email Marketing Dashboard closes that gap.
Why an email marketing dashboard matters
Email still delivers one of the highest returns on investment (ROI) of any marketing channel. The problem isn't the channel. It's the visibility.
When campaign data lives across disconnected tools, you spend more time assembling numbers than acting on them. You paste metrics into a spreadsheet, explain context to a chatbot, or wait for someone to pull a report. By the time the picture is clear, the campaign has moved on.
A centralized Email Marketing Dashboard changes that:
No more manual assembly: Data from your email platform, web analytics, and CRM flows into one view automatically.
Real-time performance signals: See what's working while you can still act on it, not in a monthly recap.
Decisions grounded in reliable numbers: Consistent, connected data means you're not second-guessing the source.
A clear line to business outcomes: Connect open rates and clicks to revenue, leads, and customer acquisition so leadership sees the full picture.
Email marketing best practices
Data-driven marketing isn't just about measuring more. It's about knowing which numbers signal that a campaign is working and acting on that signal before the window closes.
Modern email marketing has moved well past the batch-and-blast approach. The teams seeing strong results are sending relevant content to the right segments, testing continuously, and connecting email performance to business outcomes, not just campaign metrics.
Key practices include:
Segment your audience: Send relevant content to the right people at the right time, not the same message to everyone.
Test and iterate: A/B test subject lines, send times, and content. Let the data tell you what to keep.
Monitor engagement trends: Track opens, clicks, and conversions over time, not just per campaign.
Align with business goals: Map email metrics to revenue, customer acquisition, or retention targets so your work tells a complete story.
Automate where possible: Triggered campaigns and workflows scale personalization without scaling your workload.
Your marketing dashboards should combine email platform data with web analytics and CRM data. That combination is what turns campaign stats into business evidence.
Create custom dashboards for you and your team.
Get started with KlipsKey metrics to track
The right metrics depend on who is reading the dashboard and what decision they need to make. An executive needs to know whether email is driving revenue. A campaign manager needs to know which subject line won and why the click rate dropped on Tuesday.
Common KPIs for an Email Marketing Dashboard include:
Open Rate: Percentage of recipients who opened your email. A signal of subject line strength and list health.
Click-Through Rate (CTR): Percentage of recipients who clicked a link. Reflects content relevance and call-to-action effectiveness.
Conversion Rate: Percentage of clicks that resulted in a desired action, such as a purchase or signup. The clearest measure of campaign impact.
Unsubscribe Rate: Percentage of recipients who opted out. A rising rate signals a relevance or frequency problem.
List Growth Rate: Net change in your subscriber count. Healthy lists grow; stagnant ones erode deliverability.
Revenue per email: Total revenue attributed to email divided by emails sent. Ties campaign activity directly to business outcomes.
Cost per acquisition: Total email marketing spend divided by new customers acquired. Useful for comparing email ROI against other channels.
Bounce Rate: Percentage of emails that failed to deliver. High bounce rates hurt sender reputation over time.
Build your dashboard around the decisions your team needs to make. The goal isn't a comprehensive data dump. It's a view that tells you what changed, why it matters, and what to do next.