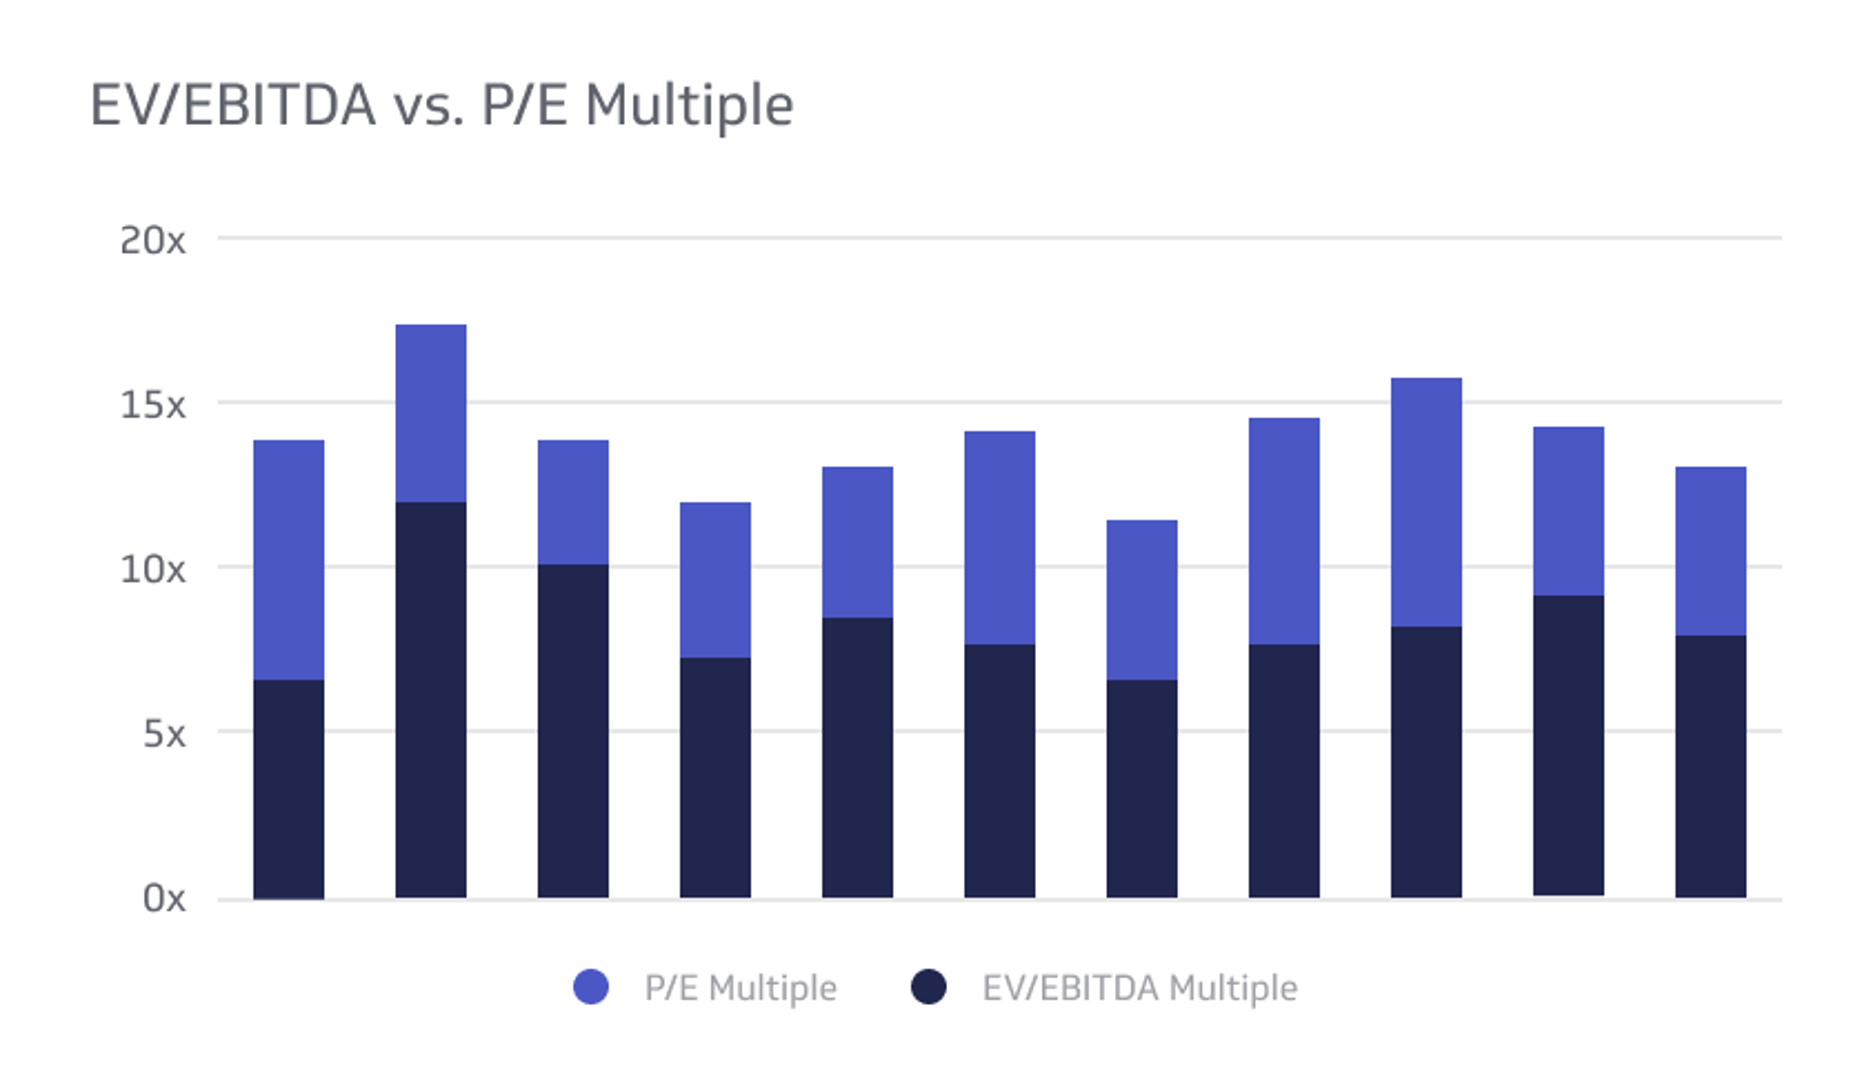
EV/EBITDA vs. P/E Multiple
This value can evaluate the potential and profitability of a company for investors.
Track all your Financial KPIs in one place
Sign up for free and start making decisions for your business with confidence.
Demystify the world of financial valuation and elevate your investment strategy with a comprehensive understanding of EV/EBITDA and P/E multiple. Navigating the complexities of these valuation metrics is essential for making informed investment decisions.
This in-depth article will guide you through the intricacies of both EV/EBITDA and P/E multiple, examining their advantages and disadvantages and highlighting the importance of utilizing them in conjunction with a well-rounded evaluation of a company's potential.
Equip yourself with the knowledge to confidently assess a company's worth and optimize your investment approach with our expert analysis of EV/EBITDA vs. P/E multiple.
What Is EV/EBITDA?
EV stands for Enterprise Value. EBITDA stands for Earnings Before Interest, Taxes, Depreciation, and Amortization. EV/EBITDA is when the enterprise value is divided by the total earning before interest, taxes, and amortization. This value can evaluate the potential and profitability of a company for investors.
It’s a big-picture evaluation that considers the company’s current value with its cash earnings. Enterprise Value (EV) is the company’s worth, including ownership interests and asset claims from equity and debt. Essentially, it’s how much the company could sell for if someone bought it right now.
The earnings before ITDA reflect the total cash earnings of the company at a given time. So it’s similar to gross profit, but factors in different considerations. But EBITDA focuses on a company's operating efficiency compared to competitors in the industry.
- EV = Market Capitalization + Preferred Stock + Outstanding Debt + Minority Interest – Cash and Cash Equivalents
- EBITDA = Operating Income + Depreciation + Amortization
What Is P/E Multiple?
P/E Multiple is a little simpler than EV and EBITDA. P/E stands for Price divided by Earnings. This financial metric is sometimes referred to as the Price Multiple or the Earnings Multiple. In this scenario, price refers to the share price, and earnings refer to the earnings per share.
The share price is how much investors pay for a single share in the company. The earnings metric refers to the total earnings the company has per share. This metric looks at the company value using smaller metrics, meaning the shares rather than the entire company valuation:
- P = Total Market Value / Number of Oustanding Shares
- E = (Preferred Dividends – Net Income) / Average of Oustanding Common Shares
What Are These Metrics Used For?
Both of these metrics can evaluate a company and help investors and potential investors make informed decisions with their money.
People use both these metrics to determine the potential and future of the company, which often drives decisions to buy stock in a company or look elsewhere to invest. Both of these valuation matrixes are helpful when buying stocks, but some people put more weight into one than the other.
The sections below will explain the advantages and disadvantages of using each metric to make financial decisions. However, the best way to use these metrics is together, so you can look at a fuller and more complete analysis of a company’s prosperity and potential.
The sections below discuss the advantages and disadvantages of using the two metrics, so you can decide how much to consider each metric when making investment decisions.
Advantages of Using EV/EBITDA
The sections below will explain the advantages of using EV/EBITDA to evaluate a company.
Clear Look at Financial Performance
Most professionals consider EV/EBITDA an accurate glimpse at financial health and potential. As mentioned, EV/EBITDA offers a look at a company from the inside, which can be far more reliable than the value according to the market perspective, which can be highly subjective.
And by eliminating interest, taxes, and other non-core financial aspects, investors and accountants can more accurately assess how well a company is doing.
Accurate Competitor Comparisons
While many people use P/E ratios to compare companies, this can be a highly misleading strategy. The sections below will dive deeper into the advantages and disadvantages of relying on P/E metrics, but the overvaluations and undervaluations are major downsides.
But with EV/EBITDA, comparing the company’s value to similar companies in the same industry can give you more accurate insight into how the company in question stacks up against others. Competitor comparisons are a common way investors make decisions, so this advantage of EV/EBITDA is very valuable.
Big Picture Metric
As mentioned, EV/EBITDA metrics offer a big-picture look at a company’s worth. Eliminating, interest, taxes, depreciation, and amortization does take some important elements away, but overall, the EV/EBITDA considers more financial factors than the P/E metric.
P/E helps you look at the nitty-gritty earnings and shares that affect you as an investor. But the big-picture that EV/EBITDA gives you tells you more about the future of the company and its potential.
Disadvantages of Using EV/EBITDA
While useful, EV/EBITDA does come with a few downsides to keep in mind.
Does Not Include Capital Expenditures
EV/EBITDA does not include capital expenditures, which helps show accurate earnings and value. However, excluding capital expenditures in some industries can severely warp the metric.
Industries like automotive, airline, oil, gas, mining, manufacturing, and real estate require hefty capital expenditure to be successful. If the capital expenditure drastically outweighs earnings, it’s a sign of failure. Excluding this aspect from the formula can cause a business to look wealthier than it is.
Can Misrepresent Liquidity
In many cases, the EV/EBITDA can misrepresent a company’s liquidity and cash flow. So, it may offer a more favorable number than the true one. Because it removes so many non-core financial aspects, including interest, taxes, depreciation, and amortization, it can paint a more positive picture of a company’s financial health, misleading investors.
While this metric is useful because it shows a company’s value by stripping debt, taxes, and other financial aspects that do not correlate to earnings and profit potential, it can make the company look more profitable than it is.
Debt can mislead investors to think a company has poor potential, but debt can also indicate how much liquid cash and flexibility a company has, increasing its growth potential.
Complex to Calculate
Many investors will avoid using the EV/EBITDA because it involves many numbers and become complicated quickly. While it’s not a question of laziness, it is a question of accuracy. If even one of the numbers in the formula is slightly off, the final calculation could be wildly inaccurate, leading investors to make ill-informed decisions.
If an investor is confident in the accuracy of all the numbers in the formula, it’s a brilliant metric to use for company valuation. But calculating and finding these numbers can be a substantial task, so many opt for the P/E ratio because they feel more confident in its accuracy.
Advantages of Using P/E Multiple
The advantages of P/E are very different than those of EV/EBITDA. Take a look at the reasons people use P/E Multiples when assessing companies.
Simple to Compute
One reason many investors choose the P/E metric when evaluating a company’s potential is that it’s a simple metric to calculate. Not only is the formula easier to comprehend and execute, but finding the needed numbers to make the calculation is convenient.
You can find the share price on any investing app or website, and you can find the earnings per share in the same way, referring to the stock market numbers.
Unlike the EV/EBITDA, you only need two or three numbers to complete the formula. You need the price per share, the company earnings, and the number of shares, unless you find the earnings per share already calculated. Finding the EV/EBITDA metric requires nearly ten different metrics to calculate.
Indicates Cost for Investors
P/E is a super convenient metric for investors because it tells them exactly how much they need to spend per share. Using EV/EBITDA shows a company’s growth potential and financial health, but investors must do more research and calculations to reveal what the investment will cost them initially.
But the P/E ratio offers this information inherently, which is often easier for investors to understand. So, not only is the P/E formula simpler, but the concept for investors is also simpler.
Shows Undervaluations and Overvaluations
For investors, undervaluations and overvaluations are essential considerations when buying stocks. Undervalued stocks are an excellent opportunity for investors to capitalize on a cheap stock that will likely grow, making them more money.
On the other hand, an overvaluation indicates that the investor should avoid this stock and seek other investment options. Discovering undervalued and overvalued stocks gives investors more power and information when browsing investment opportunities and can prevent them from making disastrous mistakes based on the stock values.
Disadvantages of Using P/E Multiple
P/E has its share of downsides you can read about below.
Emphasis on Market Perspective
The biggest disadvantage of using P/E to evaluate a company’s worth is that this metric focuses heavily on the market perspective, meaning what investors think about the company. A company may be drowning in debt and have little earnings to show, but has an enticing P/E metric because investors see the potential in the business.
On the other hand, a company may be doing well, but investors do not have faith, so the P/E does not reflect the company’s financial health. Essentially, relying on the P/E is, to a degree, relying on the opinions and judgments made by other investors, not necessarily the financial facts.
Does Not Always Show Growth Potential
A high P/E can be translated as excellent growth potential, while a low P/E can indicate that the company is not and will not grow. However, these assessments leave out many factors that indicate business growth. The problem is that P/E can be an excellent growth indicator, but it’s difficult to know if it’s accurate or not.
Relying solely on the P/E when assessing growth potential is neglectful and short-sighted. As mentioned above, P/E metrics can show undervaluations and overvaluations, but these undervaluations and overvaluations can easily be misinterpreted as growth potential or a lack thereof.
Neglects Certain Factors
The P/E ratio's simplicity can be a disadvantage, as many factors are not considered. Companies often use different accounting policies, so they may pay off debts unusually or focus on stock prices and earnings, which alter the P/E, offering investors a misleading metric. P/E also neglects to consider debt, which can be a major factor in financial health.
While P/E is easy to calculate and understand, it can be an overly simplified look at a company’s potential. So in some cases, it can cause investors to make hasty decisions that do not consider the full picture of a company’s finances.
EV/EBITDA vs. P/E Multiple: Which Is Better?
As discussed, these metrics look at different aspects of a company’s financial situation. Many investors ask which is better, using the EV/EBITDA vs. P/E multiple comparisons.
However, the best advice is to use both metrics. They offer different insights into a company’s success and growth potential, so the best way to make an informed investment decision is to assess both metrics.
Together, EV/EBITDA and P/E multiple can paint a clearer picture of a company’s present and future.
Related Metrics & KPIs