- Industry Solutions
- Klipfolio for eCommerce
All of your retail data in one spot.
Klipfolio for eCommerce

From brick and mortar to online, today’s shoppers have never been more empowered with more choices than ever before. The amount of data you are collecting to run your shopping experience has never been more easier to provide you crucial insights. The data for retailers has never been better, from transactions, supply chain, buying behaviour, website trends, multi-channel sales, global customer buying, these are just a few data sources your retail business has access too. From these sources gaining insights of your customers, pricing, POS, inventory controls, channels, marketing efforts, to ad spending and more.
You can easily create dashboards that track core performance metrics, such as Average Basket Size in retail, throughout your organization including at the store, headquarters, distribution centres, warehouse facilities, factories, shipping team and more. From online to in-store, and everything in between ensure your employees and team have the understanding of the business they need to succeed.
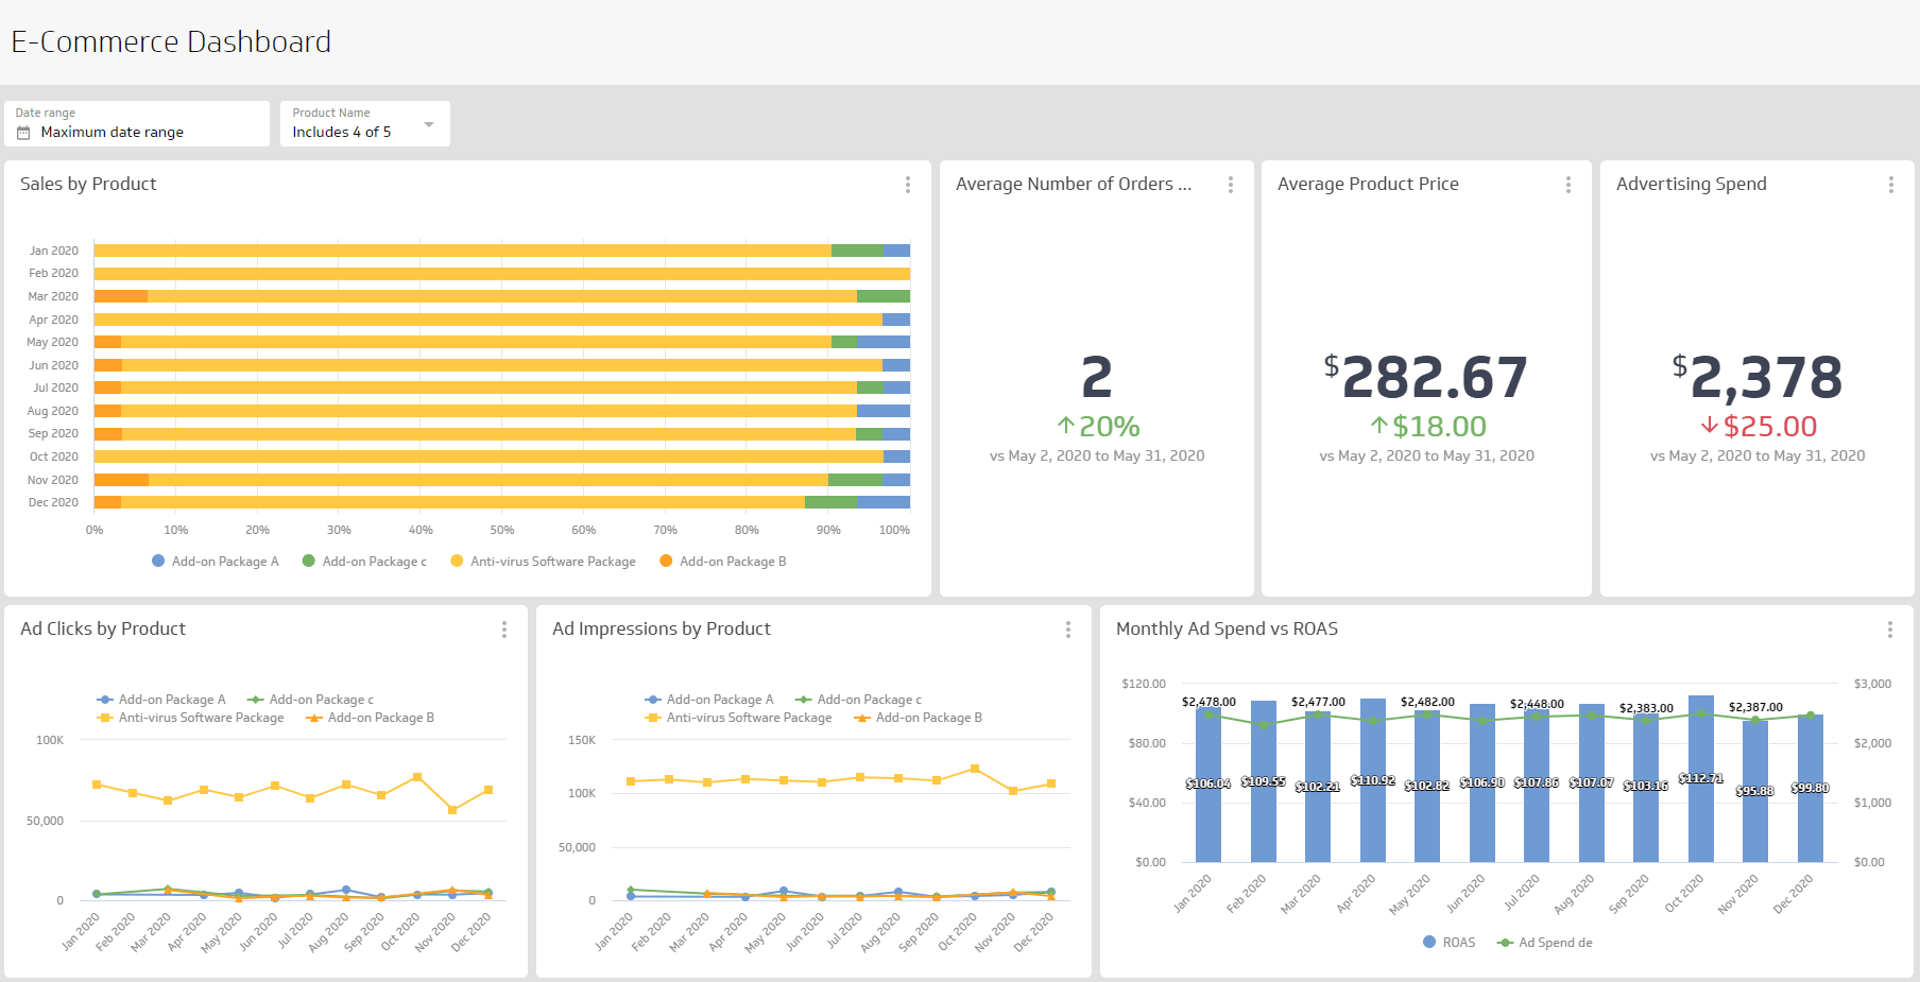
eCommerce dashboard examples
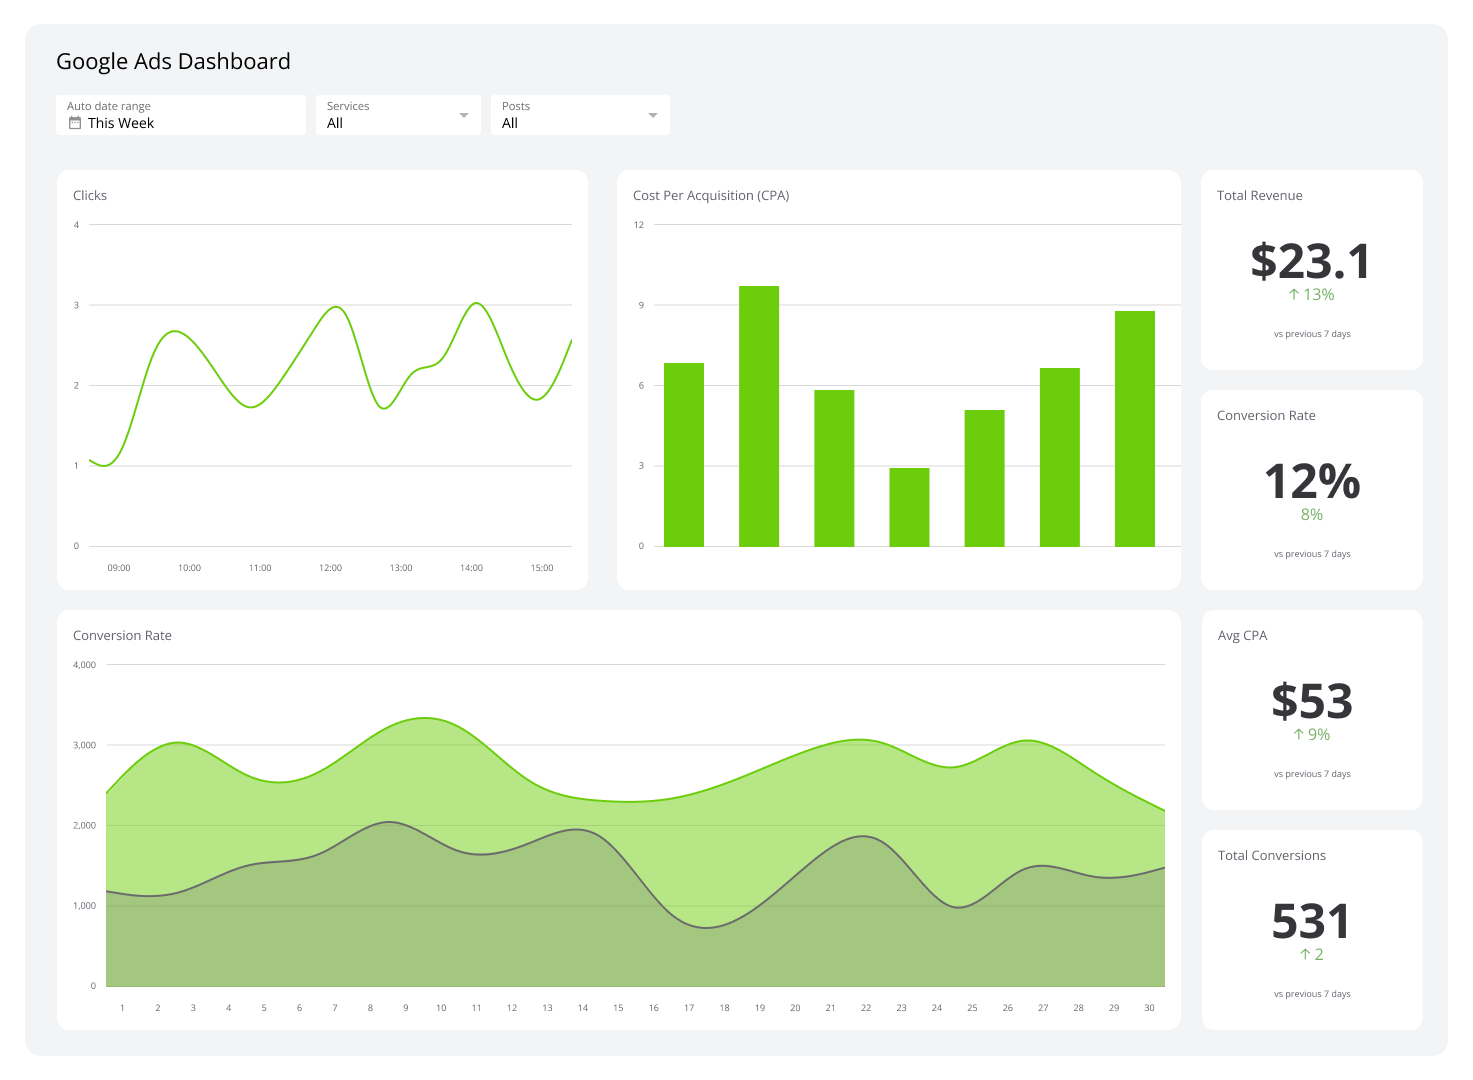
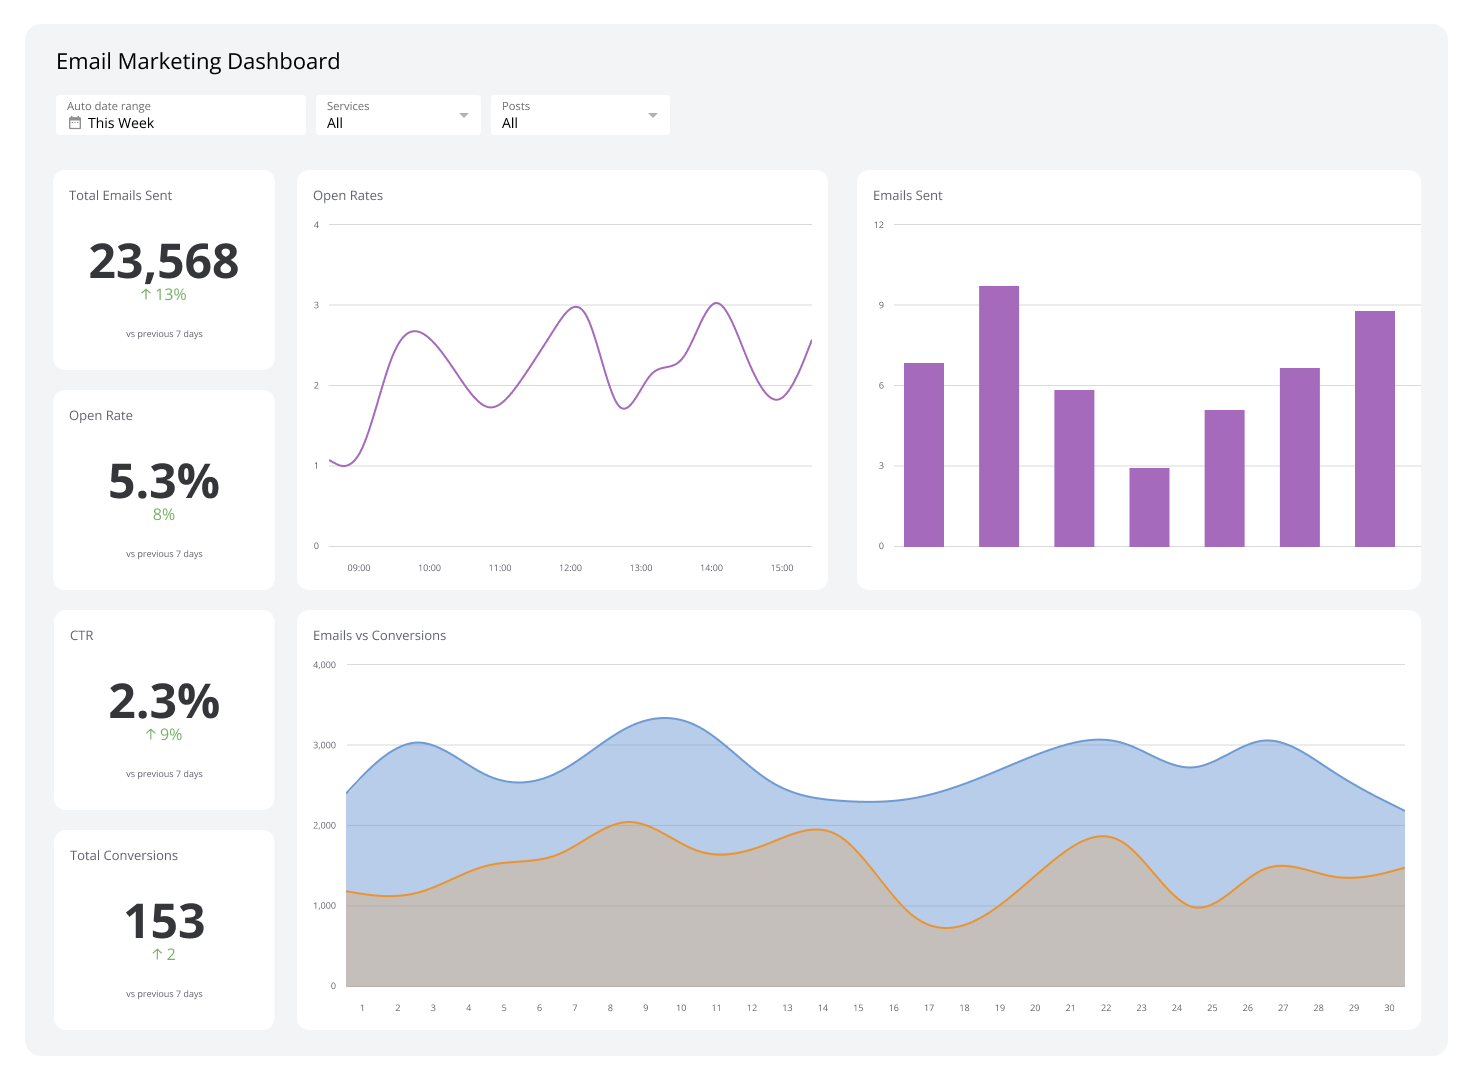
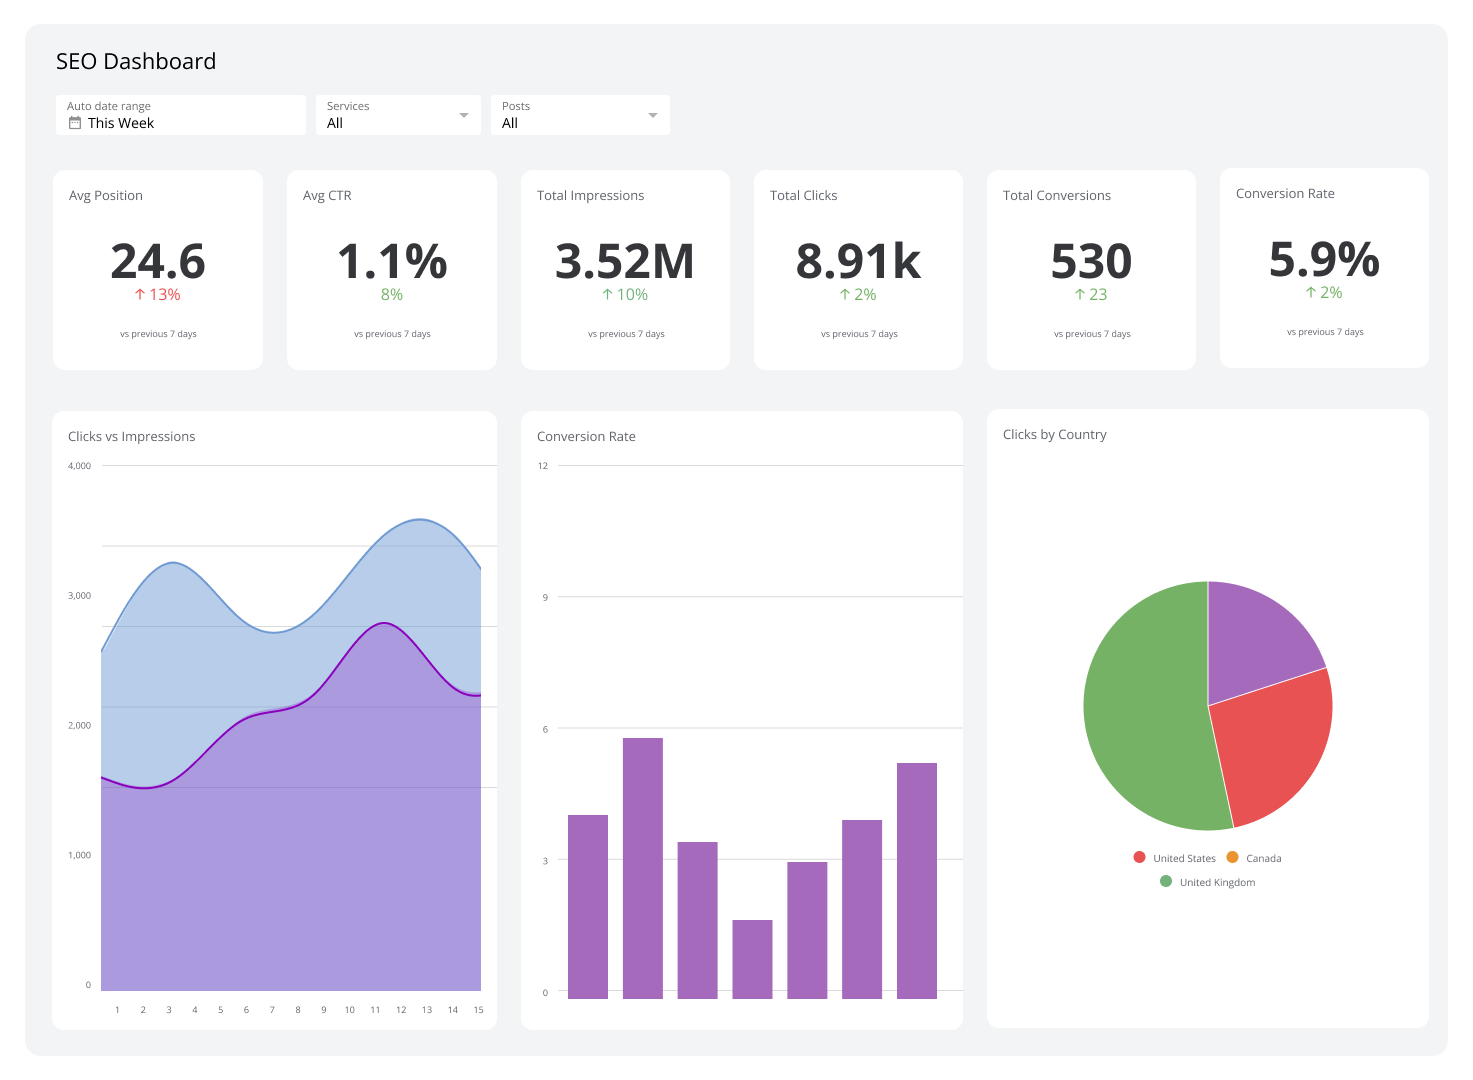
Curious to see what you can track in Klipfolio? Here are just a few examples of the ecommerce and retail dashboards you can build. View the Live Dashboard examples to get a better look.
Shopify Dashboard
- Get a real-time, interactive view of your ecommerce data
- Track order amounts, top cities, referring sites, and average order value
- Give your entire team an easy view into retail performance and trends
Facebook Dashboard
- Drill down into your social media presence
- Track your various key social metrics, such as demographics, followers, and engagement
- Have a view into social marketing opportunities
Metrics for eCommerce
Want to motivate your team and stay up to date on your data, but not sure which metrics to start with? Not to worry, we've compiled a list of common ecommerce KPIs (key performance indicators) our users have built using Klipfolio. If you are looking for more, check out our KPI Library:
- Average Basket Spend: The average dollar amount spent per transaction
- Average Shopping Time Online: The average length a customer who purchased that was on your website
- Cost of Goods: Equals the retail price minus the markup dollar costs
- Gross Sales: Total value of all sales
- Online vs In Store Purchases: Track the percentage of online sales vs your physical store sales, trending over time
- Returns & Allowances: The dollar amount of returns & allowances (track any trends)
- Shop Visitors: Number of visitors to your website (track % bounce rate to see if they are leaving to quickly)
- Transaction Count: How many customers submitted an order today/week/month/quarter
- Visitor Buying Ratio: Number of visitors against buyers
- Abandoned Cart: Track how many people started a basket but never bought
- Customer Reviews: Number of customers that left a review out of total number of customers

How to track your ecommerce and retail metrics with Klipfolio
Klipfolio allows you to pull in data from all of the different retail, marketing, and accounting platforms you use to track your store—and display precisely what you need in a single interactive dashboard. What does this mean for you? No more manual monthly reports or Excel sheets with multiple versions. And you can get started with just a few clicks. Click here for a complete list of all our integrations.
Pre-built Metrics
Using pre-built metrics
Our Klip Gallery allows you to track your key metrics with just a few clicks, wihtout the hassle of building. You can get the Klips that matter most to your business right from our Gallery to your dashboard in minutes.
Shopify
Shopify is one of the most prominent ecommerce platforms out in the world. Connecting your Shopify data into Klipfolio gives you instant access to your ecommerce metrics. With Klipfolio you can track metrics like:
- Average Order Amount
- Marketing and Sales Expenses
- Total Amount Sold
- Orders per Customer
- Top Cities (Last 30 Days)
Average Order Amount (Last 30 days)
See the trend, track, and compare your average orders over the past 30 days.
Uses:
Shopify and QuickBooks Marketing Expenses and Sales
Mash up your QuickBooks and Shopify data to see your Marketing Expenses and Sales for the last 30 days.
Uses:
See what else you can build for Shopify
QuickBooks
Do you use QuickBooks to manage your accounting data? Connect your account to Klipfolio to easily monitor your retail performance in a real-time dashboard. Easily share the dashboard with your team and rally around your numbers. With Klipfolio you can track:
- Income and Expenses
- Sales by Product
- Revenue
- Vendor Expenses
- Customer Balance Summary
- Marketing Expenses and Traffic
QuickBooks Income and Expenses
Bring your key accounting puzzle pieces - Income, Expenses, and Profit - together to help you make actionable decisions. Choose the time period of your choice from the drop-down menu, and compare to the previous period.
Uses:
Sales by Product
Make sure your products are profitable by monitoring each of their sales metrics during the time period of your choice.
Uses:
See what else you can build for QuickBooks
Google Analytics
Are you using Google Analytics to track on-site data? Connect your account with Klipfolio and easily track key metrics in a dashboard that's easy to share. In Klipfolio, you can track metrics like:
- Conversion Funnel
- Landing Page Views
- Traffic Channels
- Website Performance
- Audience Metrics
- Organic Search Performance
Conversion Funnel
Use Google Analytics and Salesforce data to create your conversion funnel. This Klip displays your users, leads, opportunities, and wins for the past 30 days.
Uses:
Google Analytics Landing Page Views
Your landing page is the backbone of your marketing campaign. Make sure people are seeing it by tracking views this month-to-date, and compare it to last month and your target.
Uses:
See what else you can build for Google Analytics
Building in Klipfolio
Our ecommerce and retail users love Klipfolio because it empowers them to build their own dashboards. Sure, it takes time to get it right, but it’s absolutely worth it.
Connecting your data
You’ve got an impressive technology stack, but how do those puzzle pieces fit together? Klipfolio is an API machine with 100s of connections to the support services you use to run your business.
Browse the 100+ services you can connect toThe Editor
Love to tinker and build but tired of using Excel to share your data? The Klip Editor is where you bring your data story to life. Build custom data visualizations that you can share with your entire company.
Custom visualizations
Drag-and-drop visualizations from the palette to start assembling your custom dashboard. Choose from standard data visualizations like charts, bullet charts, and scatter plots. Or get creative and inject custom HTML into your dashboard. The choice is yours.
Sharing
Data is meant to be shared. A dashboard without any viewers is, well, kind of sad. Wouldn’t you agree?
Which is exactly why we make sure you can share with your team and clients through multiple channels.
TV dashboard display
Our customers love showing off their dashboards on wall-mounted TVs throughout the office. It’s a great way for executives to nurture a culture of data transparency and the team to see their performance at a glance. Plus, it looks super cool.

Slack, email snapshots, and links
Send Klips or entire dashboards via Slack, setup manual or recurring email snapshots, and share links to your live dashboard.


Mobile
Get access to all your dashboards with our mobile app for iPhone and Android! Just because you're on the go doesn't mean you should miss out on your data, right?