

Summary - Metrics help you use numbers to measure your success. The top 12 SaaS metrics of 2024 will help you determine whether you’re on target to meet your goals, or slightly lagging behind. Master your data by owning a set of key metrics that you track regularly.
Tracking metrics is a tricky subject. It’s one of those things where everyone agrees it’s important but not many can clearly articulate why.
If you’re in the SaaS space, or even if you’re a founder, executive, or decision maker in any industry, chances are you’ve come across metrics. You probably even use them in your day-to-day reporting. But do you know why they’re actually a superpower you should add to your skillset?
Why are SaaS benchmarks for metrics and KPIs important for companies?
Metrics help you use numbers to measure your success. Whether you’re on target to meet your goals, or slightly lagging behind, your best bet to mastering your data is by owning a set of key metrics (known as KPIs) that you track regularly.
And how would you know if you’re on track if you have no industry data to compare your metrics against?
Fear not, because we’re going to take you through the most important SaaS metrics tracked by industry professionals and experts in 2024, along with corresponding benchmarks. This will be a roundup of the greatest hits, but in-depth analyses on any of the metrics you see here are available in the Metric Stack Newsletter.
Boosting SaaS performance with key metrics
Metrics give you a clear view of how well you're doing and help you choose smart ways to enhance your SaaS business. When you measure your metrics against what's standard in your field, you learn how your company stacks up against others.
1. Net Revenue Retention Rate: A key metric for SaaS businesses
Net Revenue Retention Rate (NRR Rate) isn’t called the top SaaS metric of 2024 for no reason. It’s hard to grow your business with the constant outflow of customers. And often, low retention rates are merely a symptom of poor customer fit or customer experience.
Net Revenue Retention = [Revenue Retention (RR) beginning of period + expansion RR during period - downgraded RR during period - cancelled RR during period] / (RR beginning of period)
Customer Acquisition Costs (CAC) are at an all time high and the way to go is through retention and emerging go-to-market strategies such as product-led growth.
The average annual NRR rate lies between 85% - 135%, with more than 50% of SaaS companies surveyed by OpenView in 2020 reporting an NRR Rate of 95% - 115%. Take a look at the chart:
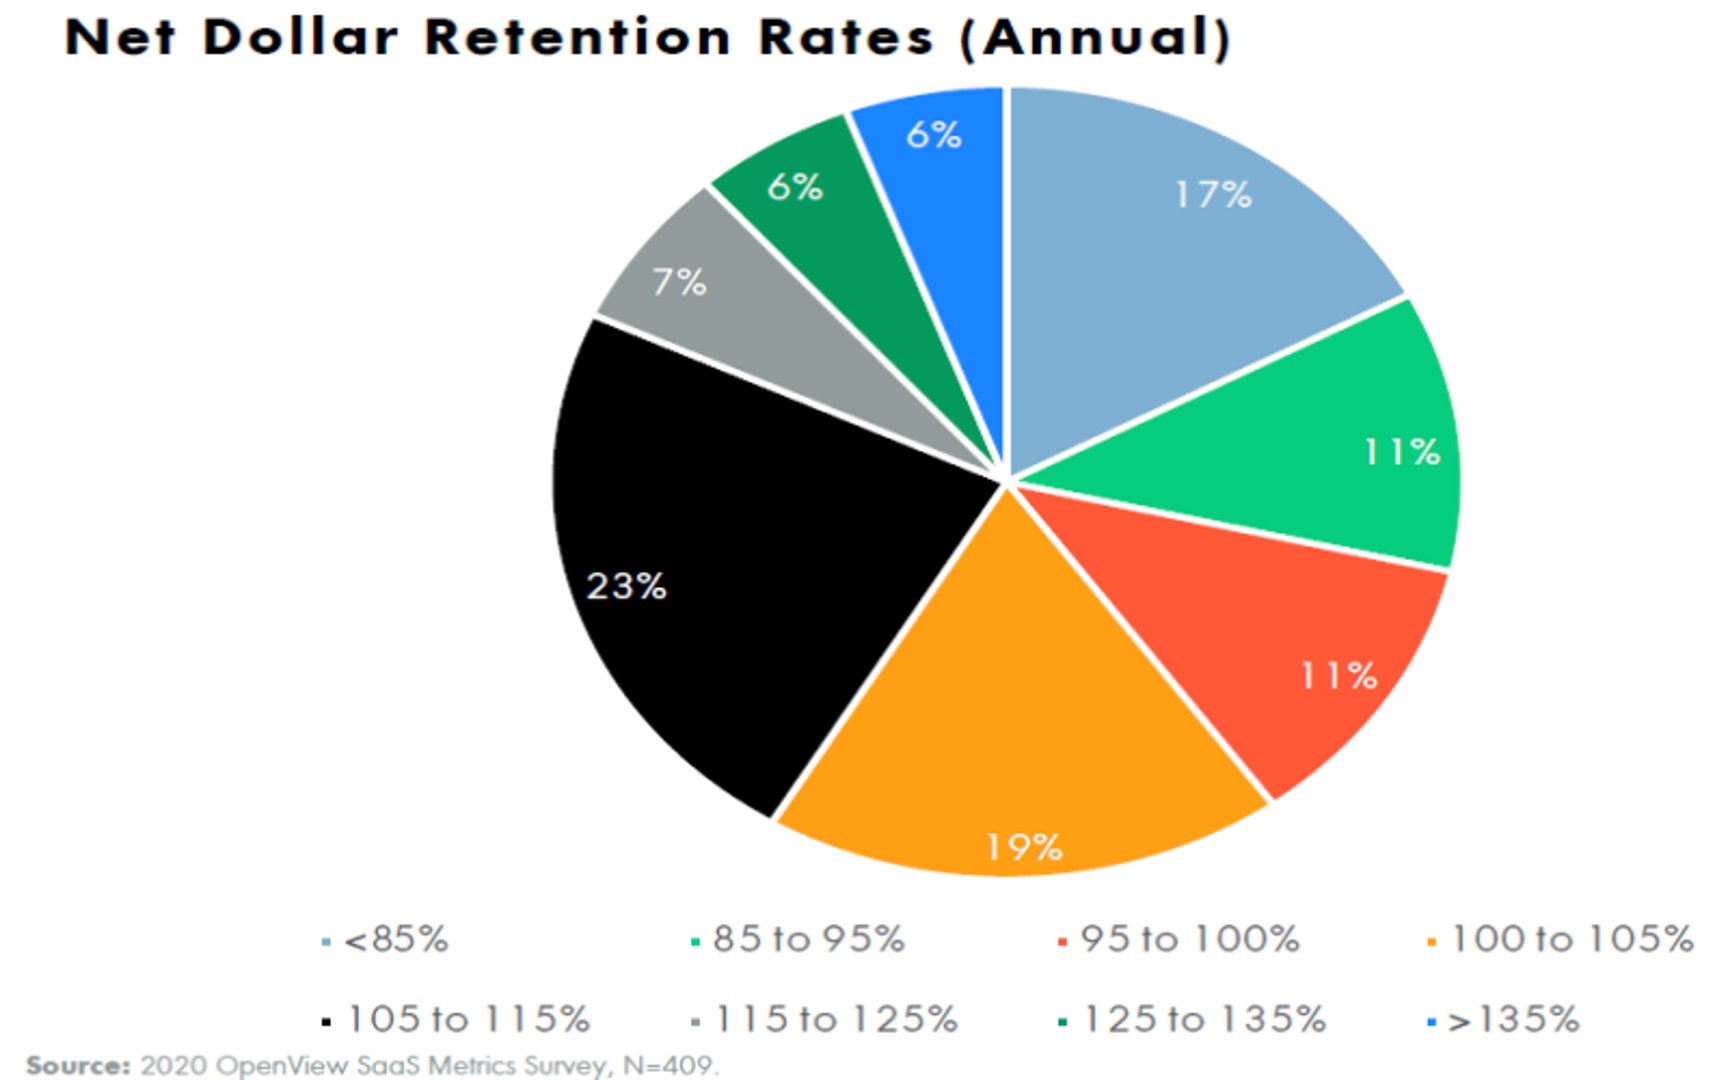
What’s the secret to increasing NRR? Guest contributor to the Metric Stack Newsletter, Sagar Shukla, co-founder of Foresight, puts it best: “The key input of the NRR equation is revenue expansion that comes from reducing discounts, selling new users (cross-sells) and new solutions (up-sells).”
And expansion revenue simply cannot take place unless you’ve addressed product-market fit. Customers will only buy more from you if you win them over with their current experience.
Read more about NRR in the Metric Stack Newsletter.
2. Hype Factor: Staying updated on the SaaS market buzz
One of the biggest insights I've uncovered through writing a weekly newsletter about metrics is that metrics measure humanity. Metrics measure how human decisions impact business.
It might be overwhelming to look at metrics as direct measurements of your decisions, but this also means you have the power to influence them. And perhaps even influence others, as can be seen with Hype Factor.
Hype Factor measures how efficiently raised capital is converted to Annual Recurring Revenue (ARR). But here’s where it gets interesting: this metric measures how much of the buzz surrounding your company is hype.
Hype Factor = Capital raised / Annual Recurring Revenue
It works on the principle that if you’re raising funds that are not converted to revenue, the funds are most likely being used for marketing hype.
What does hype mean, exactly? Anything from marketing stunts with enormous budgets, press releases and ads creating a mysterious front, and even fundraising events themselves.
Dave Kellogg, SaaS entrepreneur and creator of this metric, suggests that the target Hype Ratio should be between 1 and 2. Anything higher than 5 can be considered “hype”, meaning your raised capital is not efficiently directed towards revenue generation. Is all hype bad though?
Read more about Hype Factor in the Metric Stack Newsletter.
3. Burn Multiple: Monitoring SaaS financial health
In the spirit of capital efficiency metrics, let’s look at Burn Multiple. Burn Multiple measures how much cash you are burning to generate each new incremental dollar. Whereas Hype Factor above measures raised capital against ARR, Burn Multiple gives you the ratio between cash burn and net new ARR.Bonus:
Burn Multiple = Net Burn / Net New ARR
I refer to Burn Multiple as the one financial performance metric to rule them all, because of how it can act as an early warning of several underlying problems in your SaaS business. These problems include poor product-market fit, high acquisition costs, excessive churn, and growth disproportional to spending.
Let’s talk benchmarks: the target range for Burn Multiple is less than 1X, but between 1X and 2X is generally acceptable as well. If your Burn Multiple is higher than 2X, you have cause for concern and should regulate your cash burn.
Read more about Burn Multiple in the Metric Stack Newsletter.
4. Cash Conversion Score: Measuring ROI
Cash Conversion Score is essentially a startup’s ROI. Cash Conversion Score is popular with investors to measure the return on each dollar of investment in a company.
Cash Conversion Score = ARR / Capital Raised to Date - Cash on Hand
Generating interest in your business and getting investors to fund you is hard as it is. How do you know when it’s the right time to raise incremental capital? Cash Conversion Score SaaS benchmarks can help you determine if you’re at the right place to approach investors.
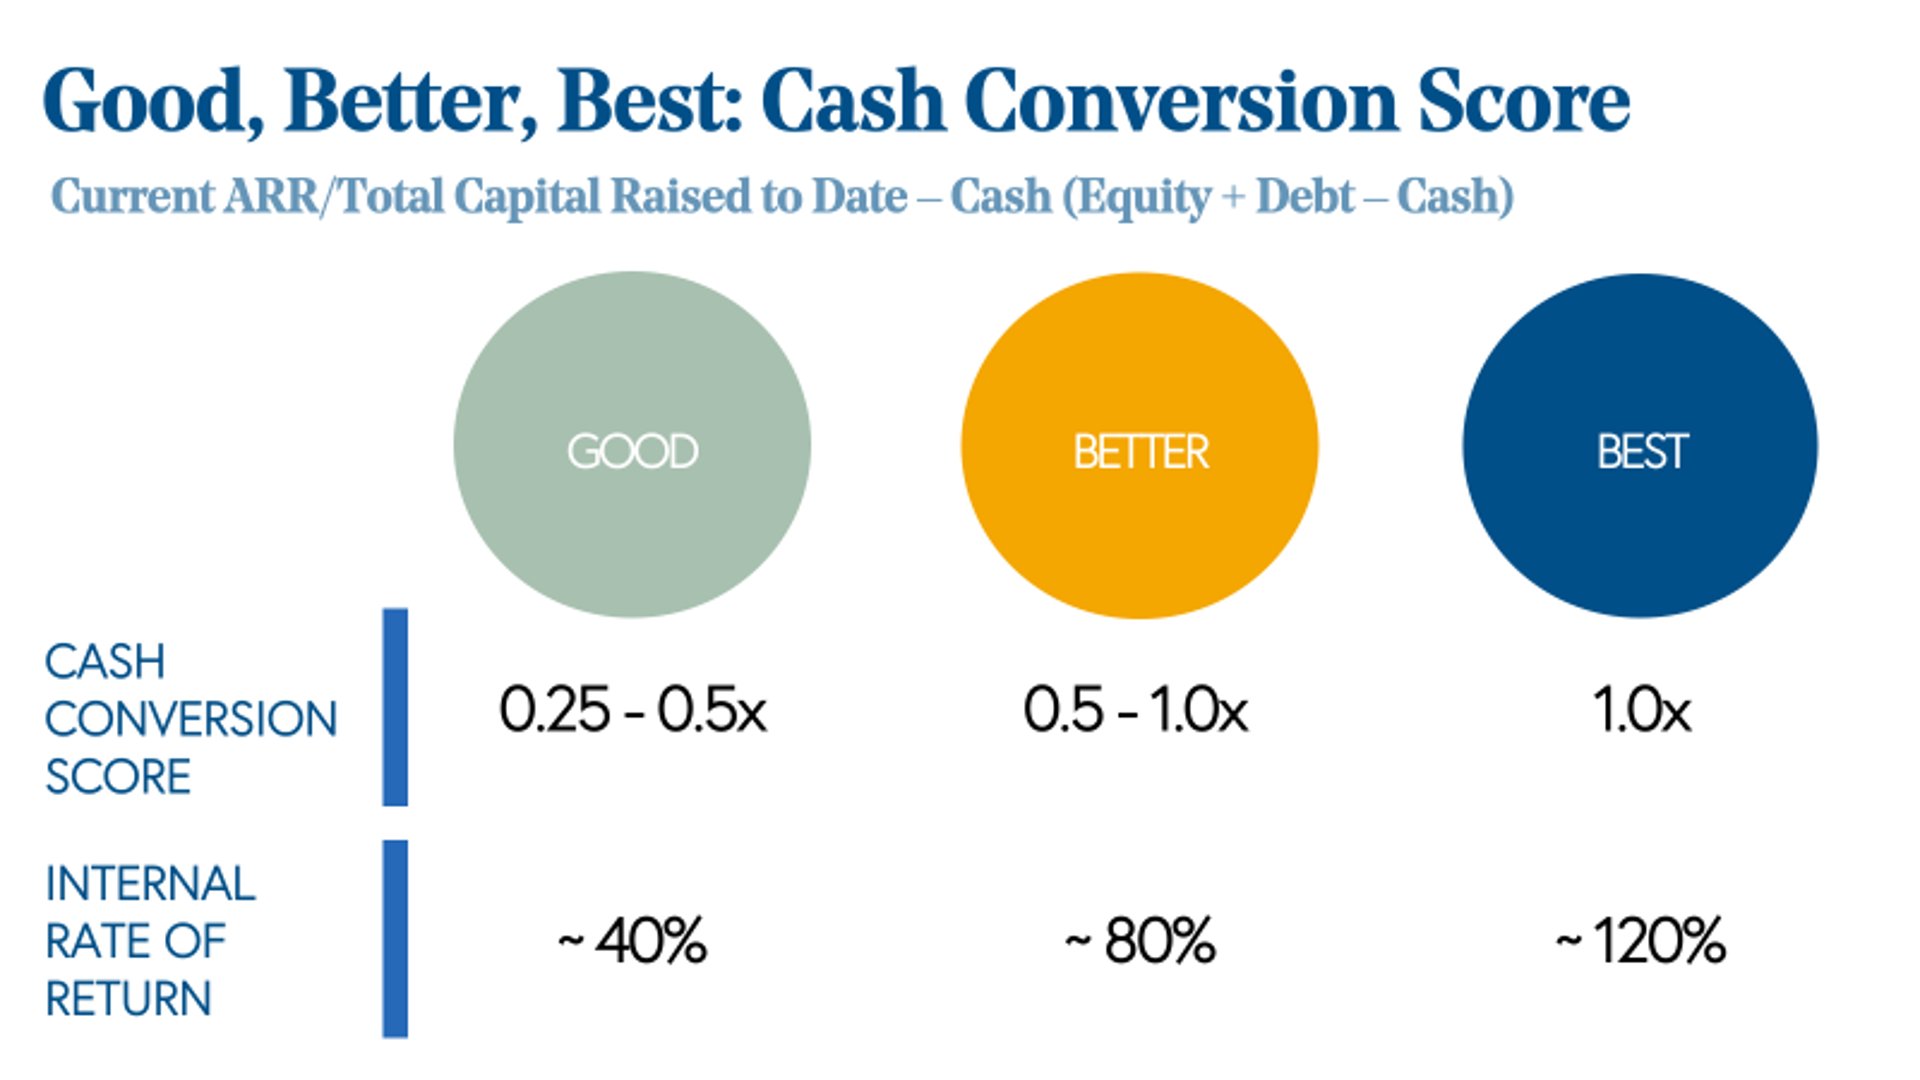
Take a look at the benchmark chart from Bessemer’s 2019 benchmark study. If you reach a Cash Conversion Score of 1X, this is a great indicator of strong product-market fit and scalable sales and marketing models.
Read more about Cash Conversion Score in the Metric Stack Newsletter.
5. Bessemer Efficiency Score: Evaluating SaaS business efficiency
Bessemer Efficiency Score completes our collection of capital efficiency metrics to track in 2024 and beyond. Still remember the formula for Burn Multiple? Bessemer Efficiency Score is its inverse:
Bessemer Efficiency Score = Net New ARR / Net Burn
What’s so special about Bessemer Efficiency Score? This SaaS benchmark lets companies measure hope. Rather, it lets you quantify your hopes and wishes for your business into concrete numbers you can act on. And that’s the beauty of metrics!
Bessemer Efficiency Score calculates net new ARR brought into the business for each dollar of net burn, basically qualifying cash burn with one of the key symbols of growth and potential: incremental revenue.
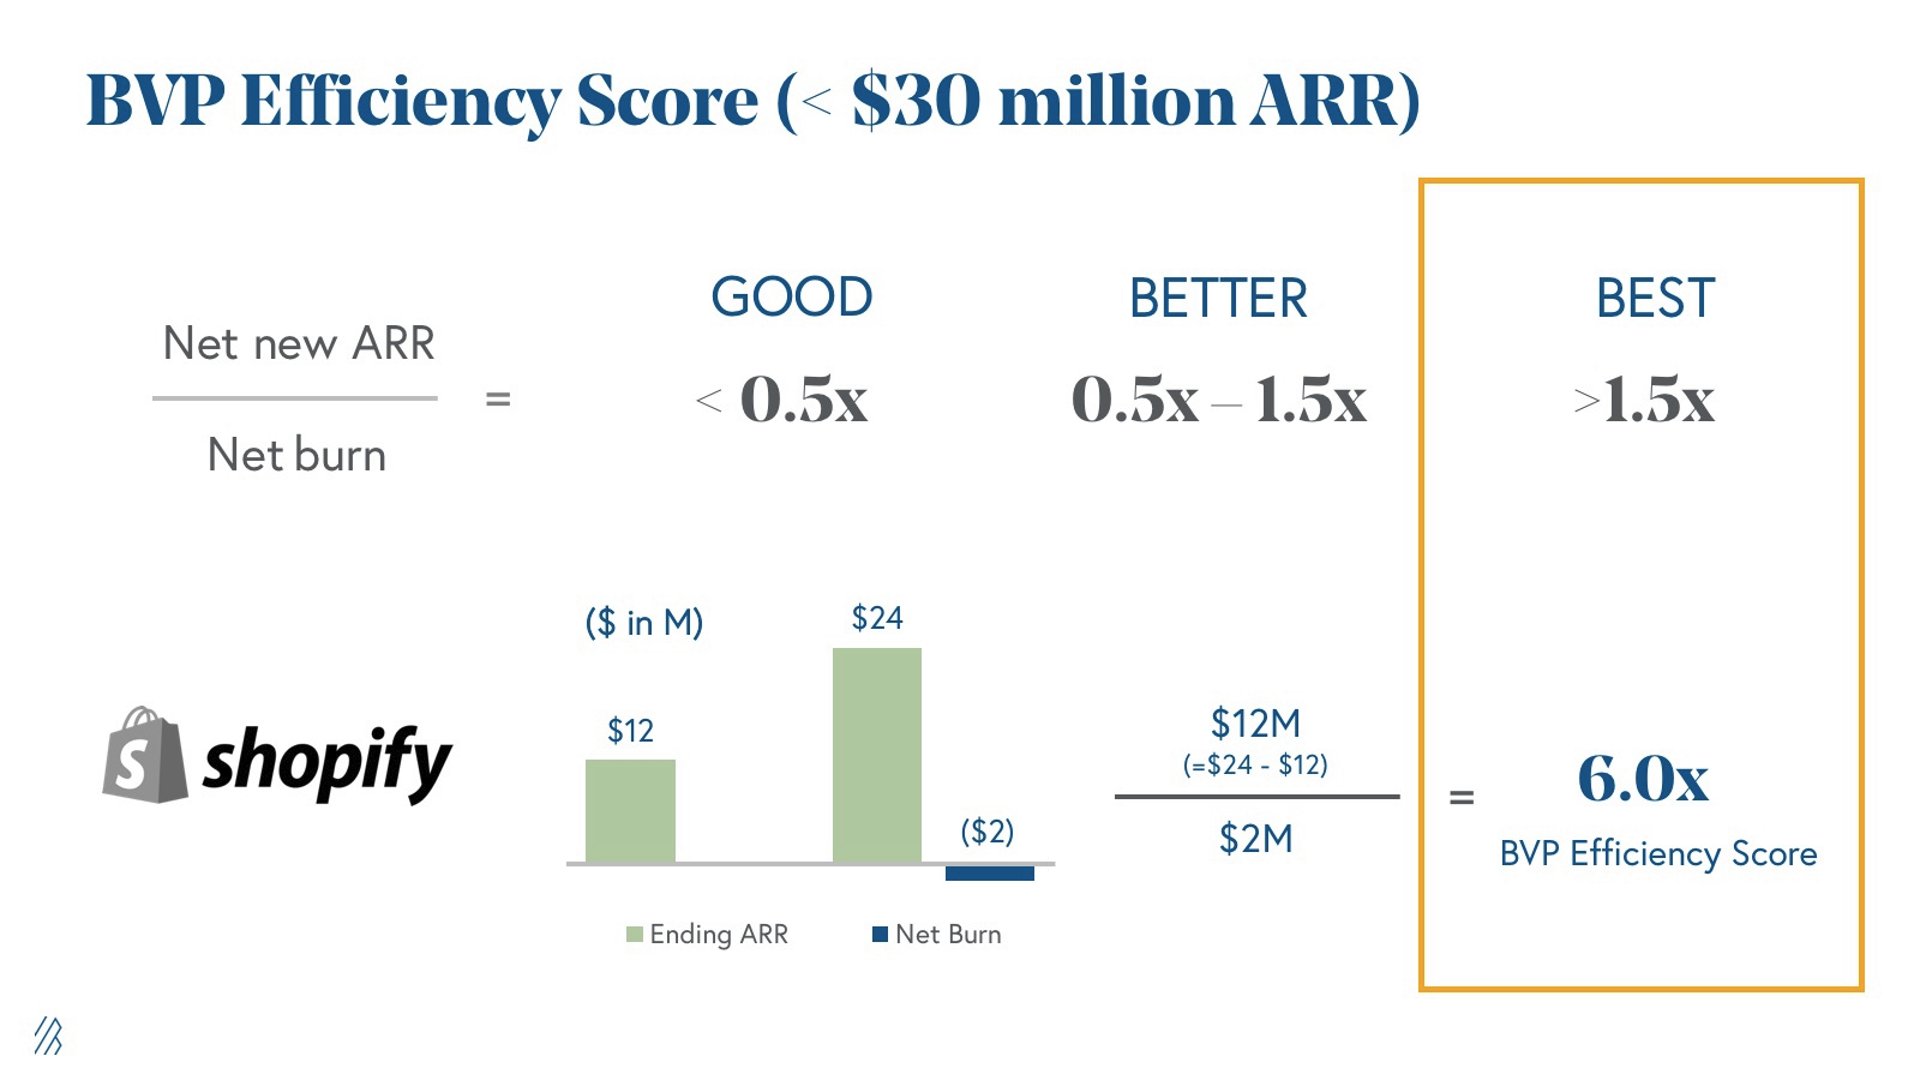
According to Bessemer Venture Partners (can you tell they coined this metric?), the best Bessemer Efficiency Score you can achieve is greater than 1.5X.
To learn more about how you can get there, read more about Bessemer Efficiency Score in the Metric Stack Newsletter.
6. Customer Acquisition Costs (CAC): Balancing cost and growth
Here comes the startup killer! Are you prepared to battle ever-growing customer acquisition costs increased by 1.6X in 2024 YoY? Customer Acquisition Cost (CAC) may have a terrible reputation among SaaS metrics, but I think it just reflects the reality we’re faced with.
SaaS customers have endless options and access to information at their fingertips. While it’s a great thing that customers are making informed choices, it does mean increasing acquisition costs for your business.
CAC = (Sales Costs + Marketing Costs) / New Customers
The average CAC for a B2B SaaS company is around $200. If you find your acquisition costs exceeding the normal metrics benchmark, it may be time to look inwards at your growth and acquisition strategy.
Ensure that your product is generating value for the right customers, your time-to-value is within reason, and strengthen your organic acquisition to begin combating the effects of CAC.
Read more about CAC in the Metric Stack Newsletter.
7. LTV:CAC: SaaS sustainability
Customer Lifetime Value to Customer Acquisition Cost (LTV:CAC) ratio is a great SaaS metric to measure the return on investing in new customer acquisition. This metric works on the simple principle that you want to make more money through new (and existing) customers than you spend on acquiring them.
The magic LTV:CAC ratio is 3:1, which means you always want your customer lifetime value to be three times more than the cost of acquiring a new customer.
LTV:CAC = Customer Lifetime Value / Customer Acquisition Cost
Read more about LTV:CAC in the Metric Stack Newsletter.
8. CAC Payback Period: Timing investment returns
So you’re tracking CAC and LTV:CAC. You know the cost of acquiring SaaS customers and the return on investing in each one. What completes the equation? The missing dimension is time!
CAC Payback Period estimates the amount of time, usually expressed in months, it takes for the average customer to pay back the cost of acquiring them.
CAC Payback Period = Average CAC per customer / Average ARR per customer
This SaaS metric is so crucial to your acquisition strategy because it helps you measure risk. When you determine how long it takes for customers to pay off the costs associated with them, you can plan your finances and forecast your company’s future.
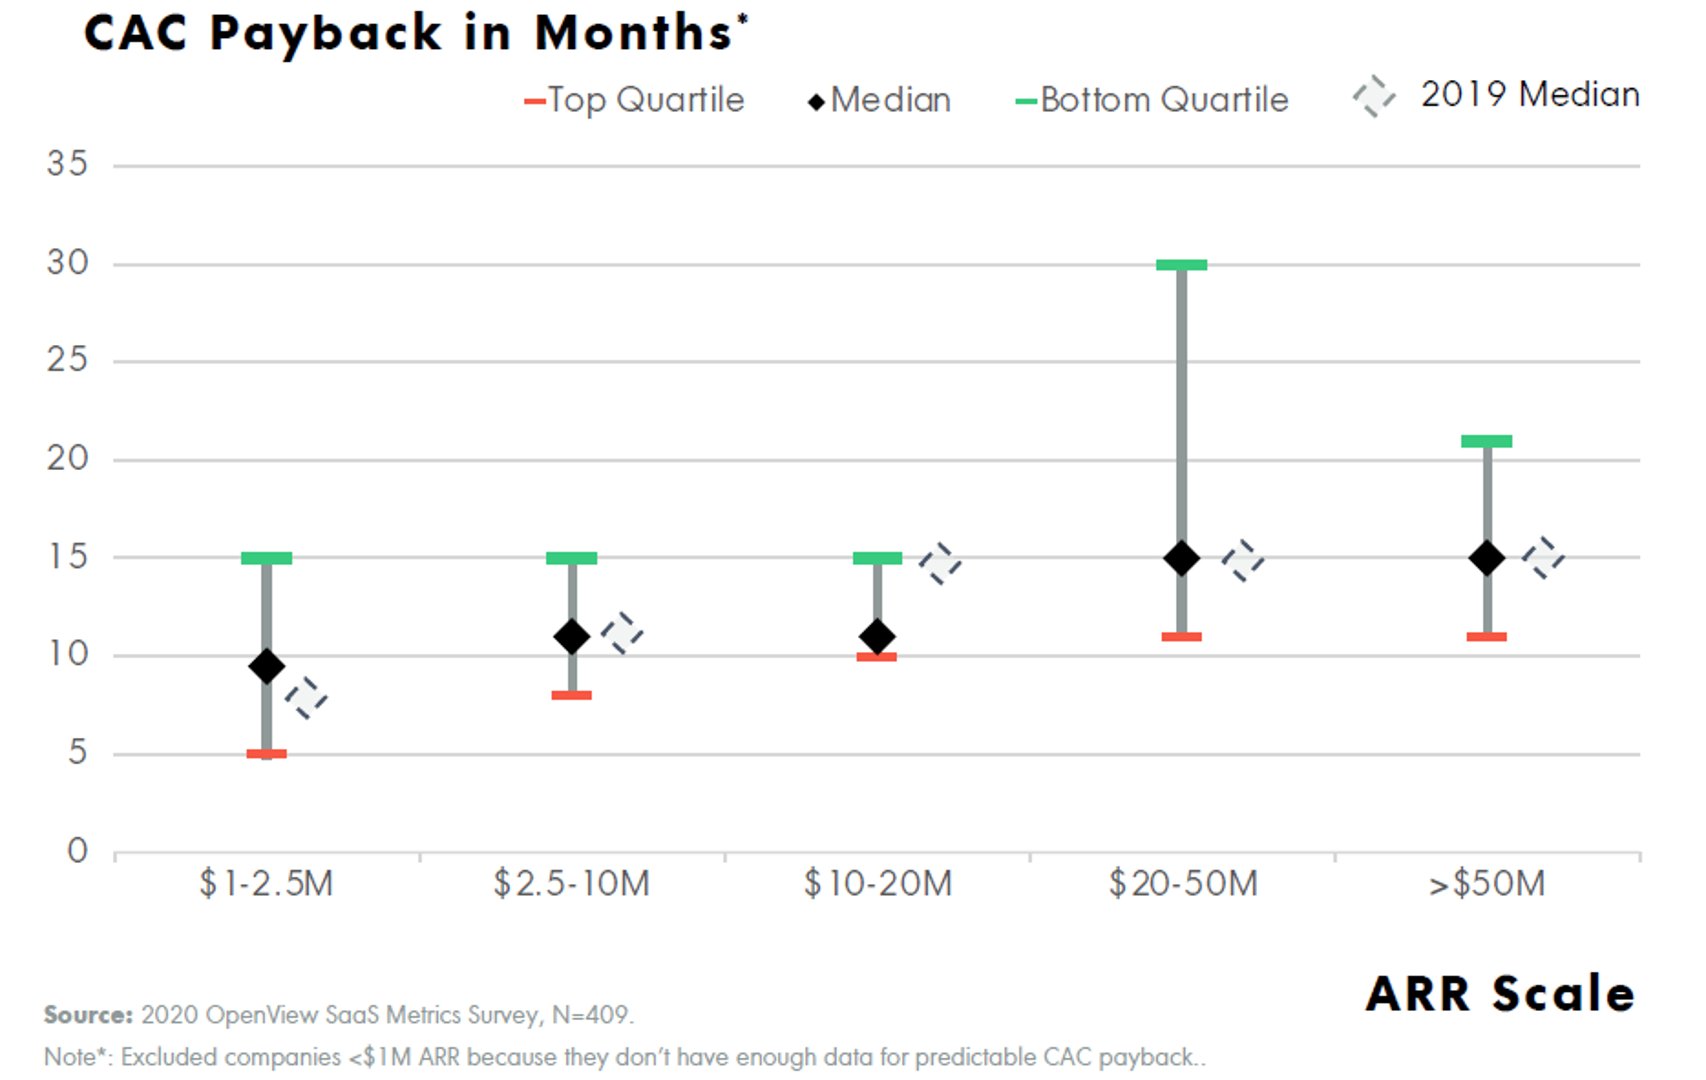
And if you’re wondering how long it should take for this to happen, the rule of thumb is a CAC Payback Period of 12 months.
According to OpenView’s SaaS benchmark report, CAC payback Period hovers around 10 months for SaaS companies with lower ARR scales, and edges up to 15 months for higher ARR companies.
Read more about CAC Payback Period in the Metric Stack Newsletter.
9. DAU/MAU Ratio: Understanding user engagement
DAU/MAU Ratio is a fascinating metric that compares daily active users of an app to its monthly active users. Disclaimer, the definition of “active” users varies wildly from company to company and across industries.
But here, you have a metric that can essentially tell you how often users come back to your product, helping you understand the stickiness of your app. Yet another disclaimer: this might be irrelevant to your business case if daily usage is not the normal frequency of usage of your app.
However, if you do identify daily active usage as important customer behavior, then DAU/MAU Ratio is your best friend.
DAU/MAU Ratio = Daily Active Users / Monthly Active Users
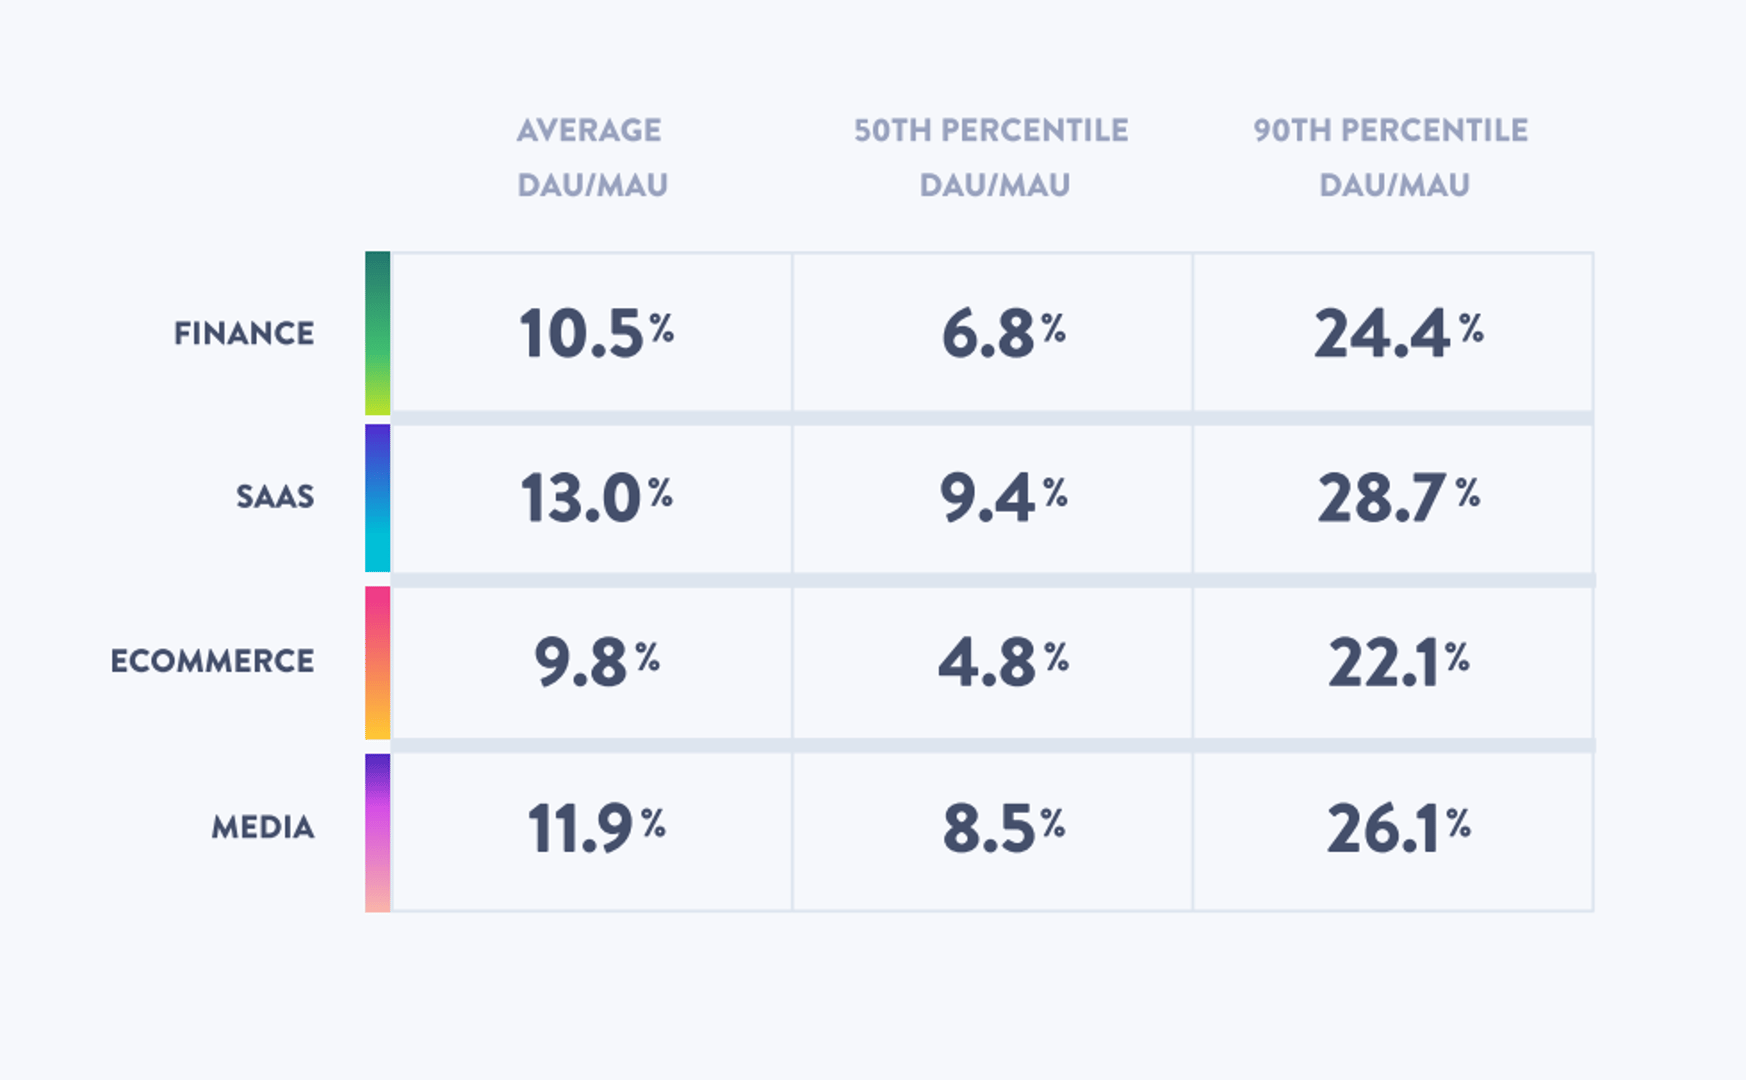
As you can see from the benchmark report by Mixpanel, the average SaaS DAU/MAU Ratio is 13%. This number is for both B2C and B2B companies, and generally, B2Bs have a much lower DAU/MAU Ratio.
The best way to approach this SaaS metric is by using it as a gauge of how frequently users use your app to solve their problems.
First, identify how often their problems arise. For example, if you own a messaging platform, your customers need to communicate with their peers, friends, and family often on a daily basis.
Second, define what it means to be active within your app. And, finally, distinguish between free, freemium, and paid customers.
With a bit of nuance and initial set up, DAU/MAU Ratio is a useful tool to measure inherent product value and predict user base growth.
Read more about DAU/MAU Ratio in the Metric Stack Newsletter.
10. Natural Rate of Growth (NRG): Tracking organic growth
I like to start strong and end strong, so the final top SaaS metric of 2024 that you should absolutely track is one of my favorite new metrics to learn about. Natural Rate of Growth measures your company’s organic growth and is based on product-led growth.
Natural Rate of Growth (NRG) = Annual ARR Growth Rate * Percentage Organic Signups * Percentage ARR from Products
This metric is best illustrated with an example. Say your annual ARR growth rate is 110%. You get 90% of your signups through organic traffic from your website, and 90% of your ARR is achieved without intervention from sales, i.e. from within the SaaS product. A simple calculation (110 .9 .9) gives you an NRG of about 89%.
Let’s check that against some benchmarks.
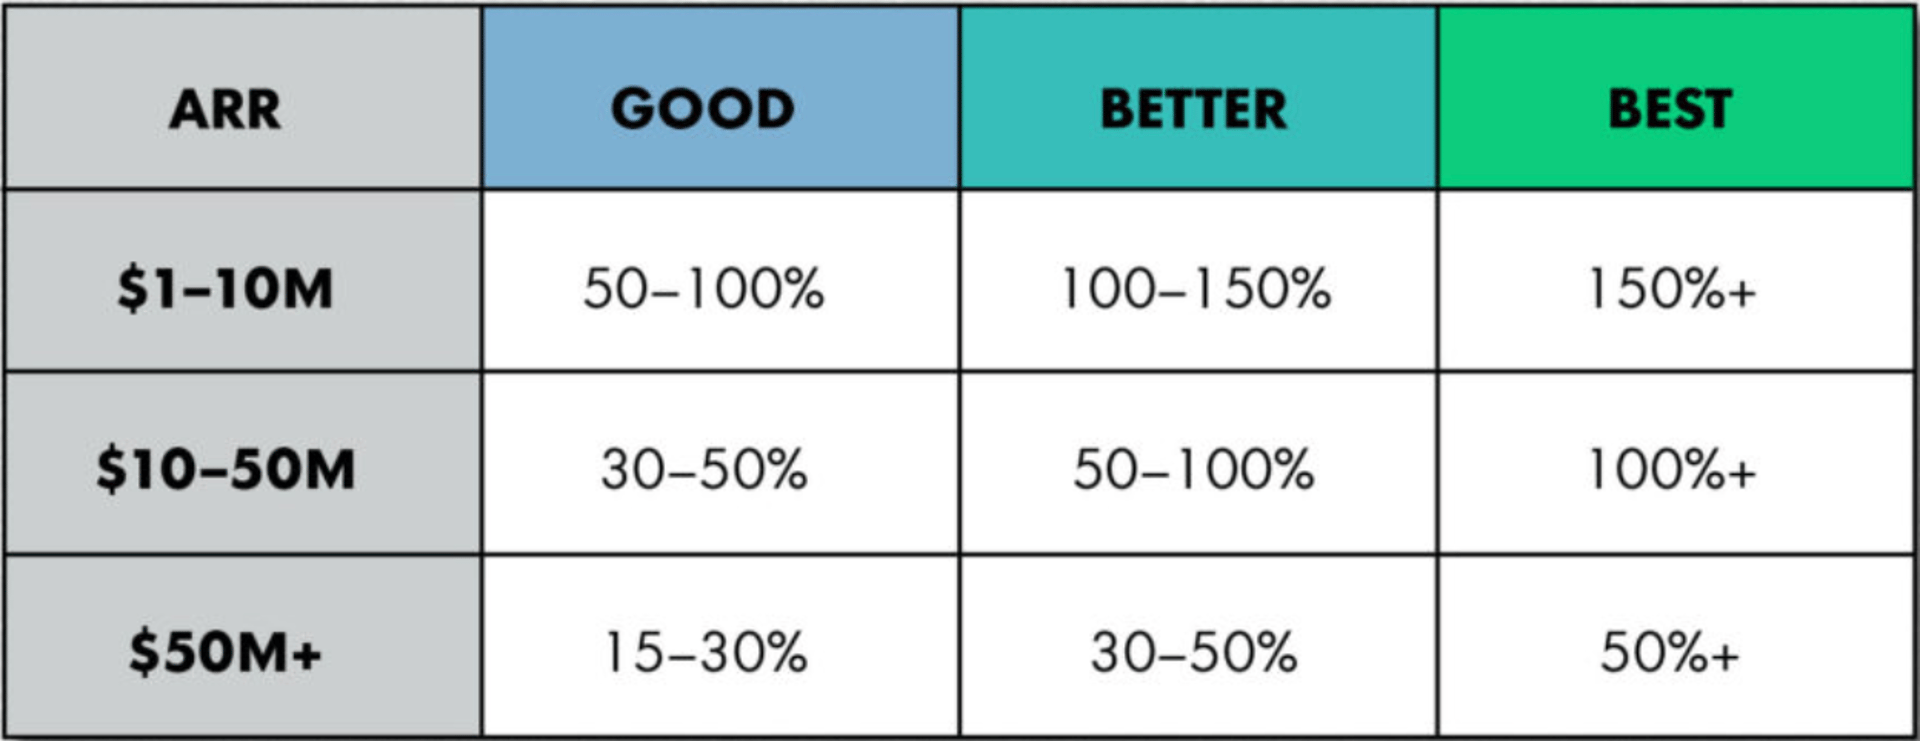
Assuming you’re a $1-10M ARR company, you can see that an 89% NRG is good, but could be improved to be greater than 150%. And why would you want to do that?
NRG is a way of measuring product-led growth, a popular and emerging business model that involves acquisition, expansion, conversion, and retention on the merit of the product itself rather than marketing-led or sales-led approaches. It is achieved through focus on delivering true value to your customers through your product features.
Primary benefits include lower CAC, higher revenue per employee, and most importantly, happier and more loyal customers.
Read more about Natural Rate of Growth in the Metric Stack Newsletter.
11. Net Promoter Score (NPS): Measuring customer loyalty
Net Promoter Score (NPS) is like a health check for your customer relationships. It measures how likely your customers are to recommend your services or products to others.
For example, you ask your customers one simple question: “On a scale from 0 to 10, how likely are you to recommend our SaaS company to a friend or colleague?” Their responses place them in one of three categories: Promoters (9-10), Passives (7-8), or Detractors (0-6).
Net Promoter Score = Proportion of Detractor Scores - Proportion of Promoter Scores
Now, why does NPS matter for your business, especially if you're a SaaS company? A strong NPS means your customers appreciate your SaaS product or service enough to recommend it to others. As a result, you can enjoy more organic growth driven by positive word-of-mouth.
Most SaaS companies typically have an NPS between 31 and 36. Since this is the average score, aiming higher and setting you apart from competitors, turning satisfied customers into enthusiastic promoters who contribute to organic growth through referrals.
Learn more about Net Promoter Score and the factors that influence it on our blog.
12. Customer Retention Rate: Pathway to long-term success
Customer Retention Rate is important for any subscription-based company, like those in the SaaS sector. Since it tells you the percentage of customers your business keeps over a specific period, you can check which strategies work with your customer base.
It directly impacts your revenue and customer satisfaction levels. Moreover, retaining your customers is more cost-effective than acquiring new ones, which is four to five times higher for SaaS companies.
Recent data shows a shift in retention benchmarks for SaaS companies. In 2022, over half of these businesses saw a drop in customer retention, likely due to economic challenges causing companies to rethink their SaaS investments. This was a notable change from 2021, where nearly 70% enjoyed higher retention rates.
Despite these fluctuations, the median net retention for SaaS companies in 2023 stood firm at 102%, with median gross retention at 91%, showing stability in the sector.
Discover strategies, metrics, and expert insights on customer retention rate here.
SaaS data for actions and advancement
Data remains the cornerstone of any organization, including SaaS businesses. Knowing the different types of data and how to use them can guide your team toward informed decisions and accelerated growth. Here are three data types that SaaS companies should know about:
Customer usage patterns
These insights show you how customers interact with your product. What features do they use the most? Where do they face difficulties? Knowing this can help you refine your product to suit customer needs better.
Subscription metrics
Data on subscription rates, renewal rates, churn rates, and upgrades/downgrades provide a clear picture of your business health. Tracking these SaaS metrics lets you see trends and respond proactively to retain and grow your customer base.
Financial indicators
Revenue, recurring revenue, cash flow, and other financial data reflect your SaaS company’s current financial health and also predict future growth potential. By monitoring these indicators, you get a better perspective on where your company’s at financially and forecast future growth accurately.
Staying ahead with SaaS metrics and benchmarks
Well, that wraps up the top 12 SaaS metrics to track in 2024. If you’re wondering how and where to track your SaaS metrics, PowerMetrics is a free forever analytics tool that lets you instantly connect and track your data with just a few clicks.
The metrics discussed here are just a starting point. Once you’ve mastered the basic SaaS metrics, you can explore connections between metrics and explore how to apply them to your data.
Interested in learning more about SaaS metrics? Subscribe to Metric Stack Newsletter for more metric deep dives to get you thinking about how to apply and track metrics in your day-to-day work.
Related Articles

5 tips to understand (and organize) your restaurant data
By Saleem Khatri — June 9th, 2026
6 dashboards I use daily to run my SaaS company
By Allan Wille, Co-Founder — April 10th, 2026
Business Metrics vs. KPIs: What’s the Difference?
By Jonathan Taylor — March 13th, 2026
