How Data Visualization Helps Prevent Cyber Attacks

Published 2023-02-13
Summary - With a constantly evolving threat landscape, you need dynamic, real-time data visualizations to access continuously updated information.
With a constantly evolving threat landscape, including new surfaces and vectors, traditional static cybersecurity methods are no longer enough. Reports, spreadsheets, and modular Governance, Risk & Compliance (GRC) tools are ineffective at staying on top of threats.
In today’s environment, you need dynamic, real-time, and actionable IT insights. You need a unified view across your network to provide continually updated information about your security posture. That’s where data visualization comes into play.
What is data visualization in security?
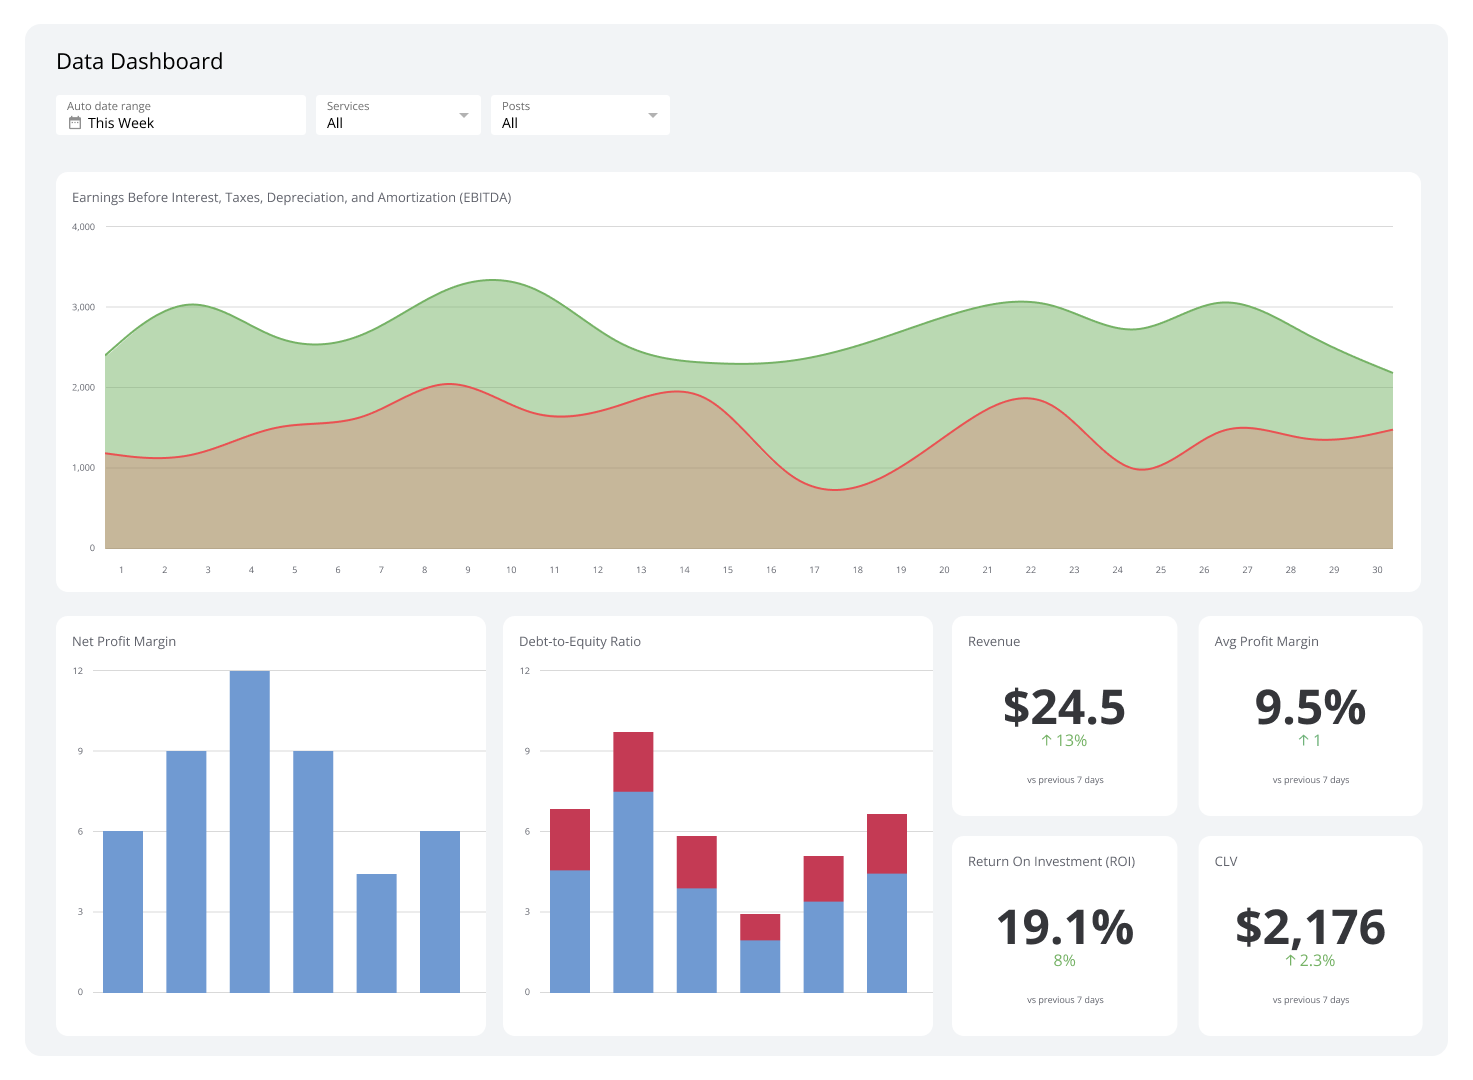
Cybersecurity data visualization provides an easy way to view data from different sources. Using charts, graphs, and real-time dashboards, IT teams and security professionals can reduce clutter and make it simple to spot anomalies that may indicate threat activity.
Using data visualization for security, vital information is sorted and organized so it’s easier to spot at a glance. Rather than digging through multiple reports or logs, using data visualization means the most important threat indicators are always visible.
For example, data visualization tools can be used to create comparative graphs that can uncover patterns of potentially malicious activity. Charts can illustrate threat activity and quickly isolate both the scope and severity of an incident.
Why is data visualization important in security?
Data visualization can provide you the peace of mind you need to be assured things are running smoothly and give you an early warning of potential threats so you can mitigate them.
The problem today isn’t a lack of data. There’s plenty of information from tracking, logging, and classifying activity. What’s become more difficult is sorting through the vast amount of data that is generated and analyzing it in a timely manner. It’s easy to miss key indicators or patterns when you’re looking through reams of information that might be in disjointed reports.
In other words, it’s not the data. It’s the interpretation of the data that gives you the insights you need.
Here are 4 cybersecurity metrics to focus on
With data visualization, you cut through the clutter so you can focus on the key metrics. When something looks suspicious, you can quickly flag it and check on it. A visual representation will make it jump out at you whereas numbers on a spreadsheet may not be as obvious.
Data visualization helps spot threat activity early, which is critical in mitigation. In 2020, it took an average of 44 days before breaches were discovered with a median of 16 days. Cybercriminals and threat actors can do a lot of damage if it takes a long time to discover them. Here are a few key cybersecurity metrics to focus on in order to keep criminals out of your network.
Time to Detect and Time to Respond
Mean Time to Identify (MTTI) and Mean Time to Contain (MTTC) refer to the average time it takes an organization to identify a breach and respond to it. In 2020 an IBM report showed that the mean time to identify a breach was 228 days while the mean time to contain a breach was 80 days. These slow MTTI and MTTC performance metrics have a huge impact on the annual cost of data breaches.
Days to Patch
Holes in software applications is a huge cyber security defensive downfall for IT teams. If security patches are not deployed quickly to any and all vulnerable applications then hackers have an opportunity to infiltrate the system. The number of days it takes to deploy patches, called Mean Time to Patch (MTTP) has a direct correlation to the number of breach attempts on the system.
Total Volume of Data Being Transferred on Corporate Network
In today’s remote work environment it’s more difficult than ever to control what employees access or download while on the corporate network. Downloading software, videos and applications can slow network traffic while leaving the door open for malware, ransomware and botnets to infect their environments. With so many organizations using cloud storage services, this can create an even more dangerous cyber security threat if the cyber infection reaches company data from an infected device.
Monitoring data volumes across the corporate network is critical to identifying users who may be using company resources for potentially dangerous activities. This data flow can help IT teams pinpoint users as they are downloading larger files such as videos or software from unknown sites on the internet.
Third Party Network Attempts
Monitoring the frequency and length of third parties accessing your network can help to identify malicious actors or the potential for a breach. Creating a mapping system that shows all partners and vendors along with their access points into your system can help to identify where you may be vulnerable.
Emerging cyber threats in 2021
Over the past decade, data breaches have increased 300%, and those are just the ones that have been publicly reported. Experts expect activity to increase in 2021 with threats centered around these types of attacks:
- Remote and cloud attacks
- Ransomware
- Distributed denial of service
- Fileless malware attacks
- Zero-day exploits
- Swarm attacks
- Phishing and spoofing
One of the most significant changes over the past year is the increasing number of threat vectors that have emerged. With one out of every four Americans working from home in 2021, there are more people accessing data and networks through the cloud than ever before.
While data visualization can help spot trends and incursions, security professionals also need to take proactive steps to limit threats created by remote work. Making sure employees working from home are employing the proper security procedures, such as encrypting data and using a Virtual Private Network (VPN) are essential.
As more employees access your data through BYOD and mobile devices, it’s also important to deploy mobile VPNs to protect identity and data especially if connected to an unprotected Wi-Fi network. With the rollout of faster 5G, protecting your mobile data will be even more important.
Summing up: The 5 key benefits of data visualization for cybersecurity
Here are the five key benefits you get from using a data visualization dashboard for cybersecurity.
- Visualization helps you to organize large data sets to more easily recognize patterns, context, and missing information.
- Visualization can save a considerable amount of time analyzing data or missing key data points.
- Visualization lets you take faster action when an anomaly is detected.
- Data visualization is highly customizable, so you can filter data to create customized dashboards.
- Visualization can be used as an exploratory tool to find and mitigate risks that otherwise would be difficult to see.
Related Articles

Klipfolio Partner How-To #1: Duplicating dashboards across client accounts
By Stef Reid — November 27th, 2025
The Starter Guide to Dashboard Design
By Emily Hayward — September 24th, 2025
What is a data dashboard?
By Emily Hayward — August 18th, 2025

