
Summary - We're introducing two new capabilities to support data-driven teams in PowerMetrics. Meet the Metric Homepage and Explorer!
We continue to innovate with PowerMetrics to make it a comprehensive, self-serve way for teams to explore, visualize, and track their business data. With metrics, users can analyze segments, apply filters, change visualizations, and create and share dashboards quickly and easily. Metrics also automatically update with new data, while preserving historical data, so you and your team have insights at your fingertips.
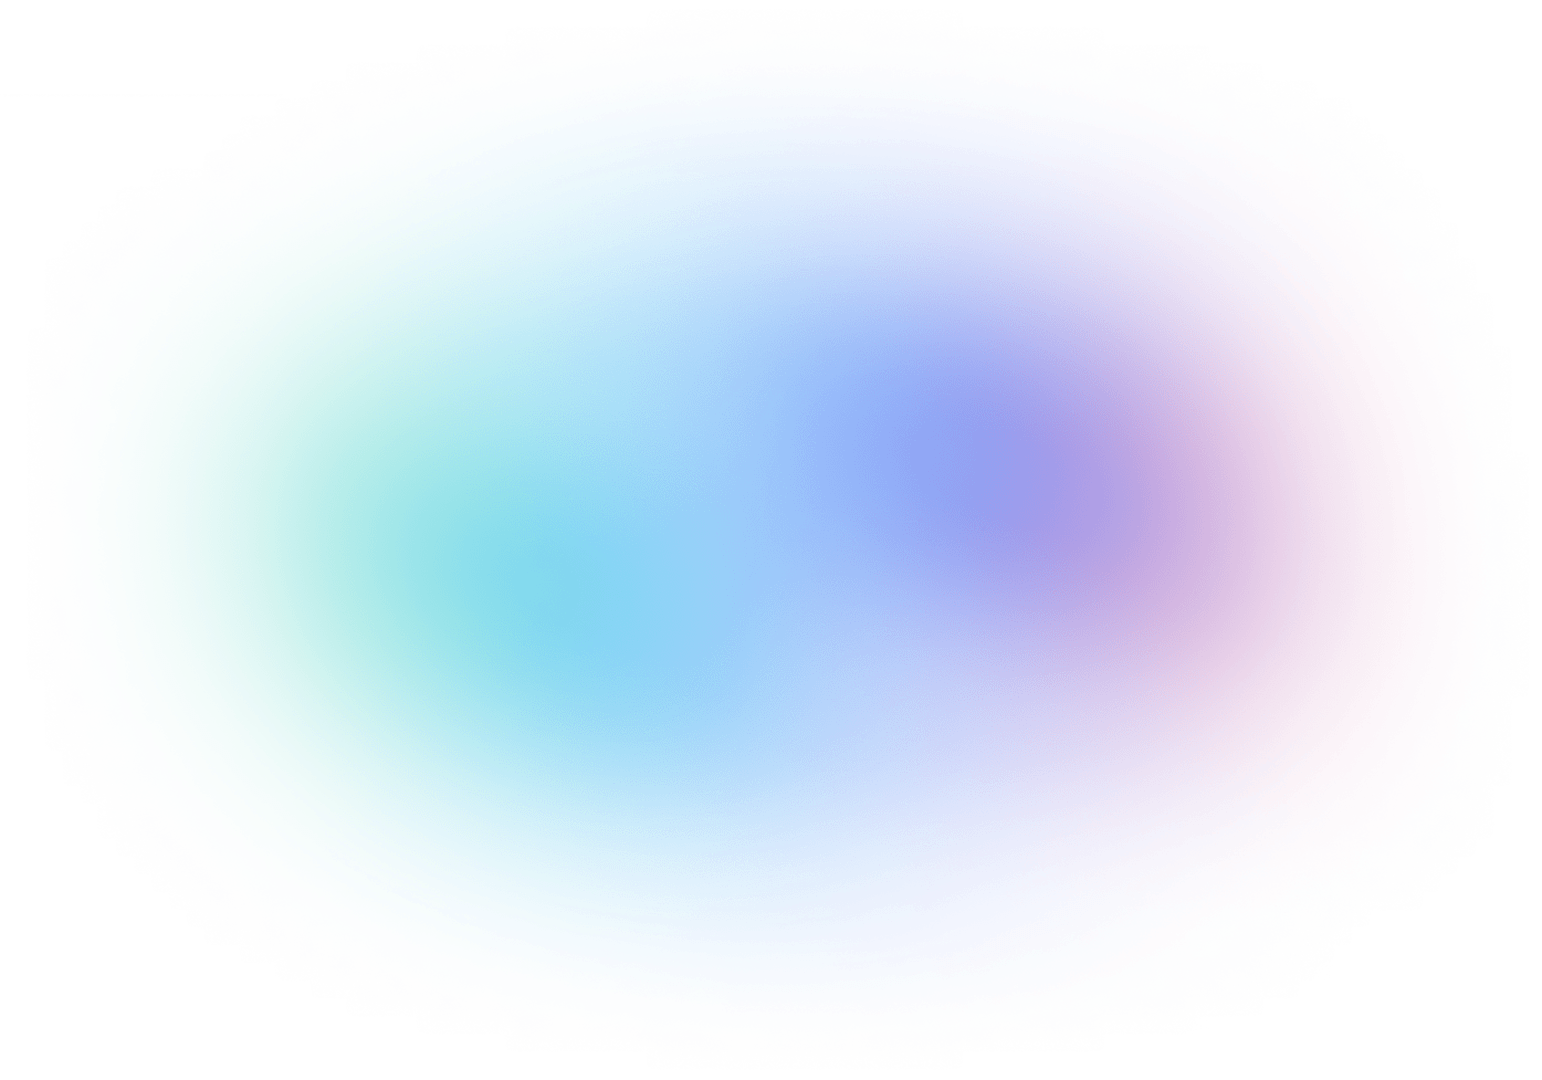
Today, we’re introducing two new capabilities to support data-driven teams: Metric Homepage and Explorer.
What is the Metric Homepage?
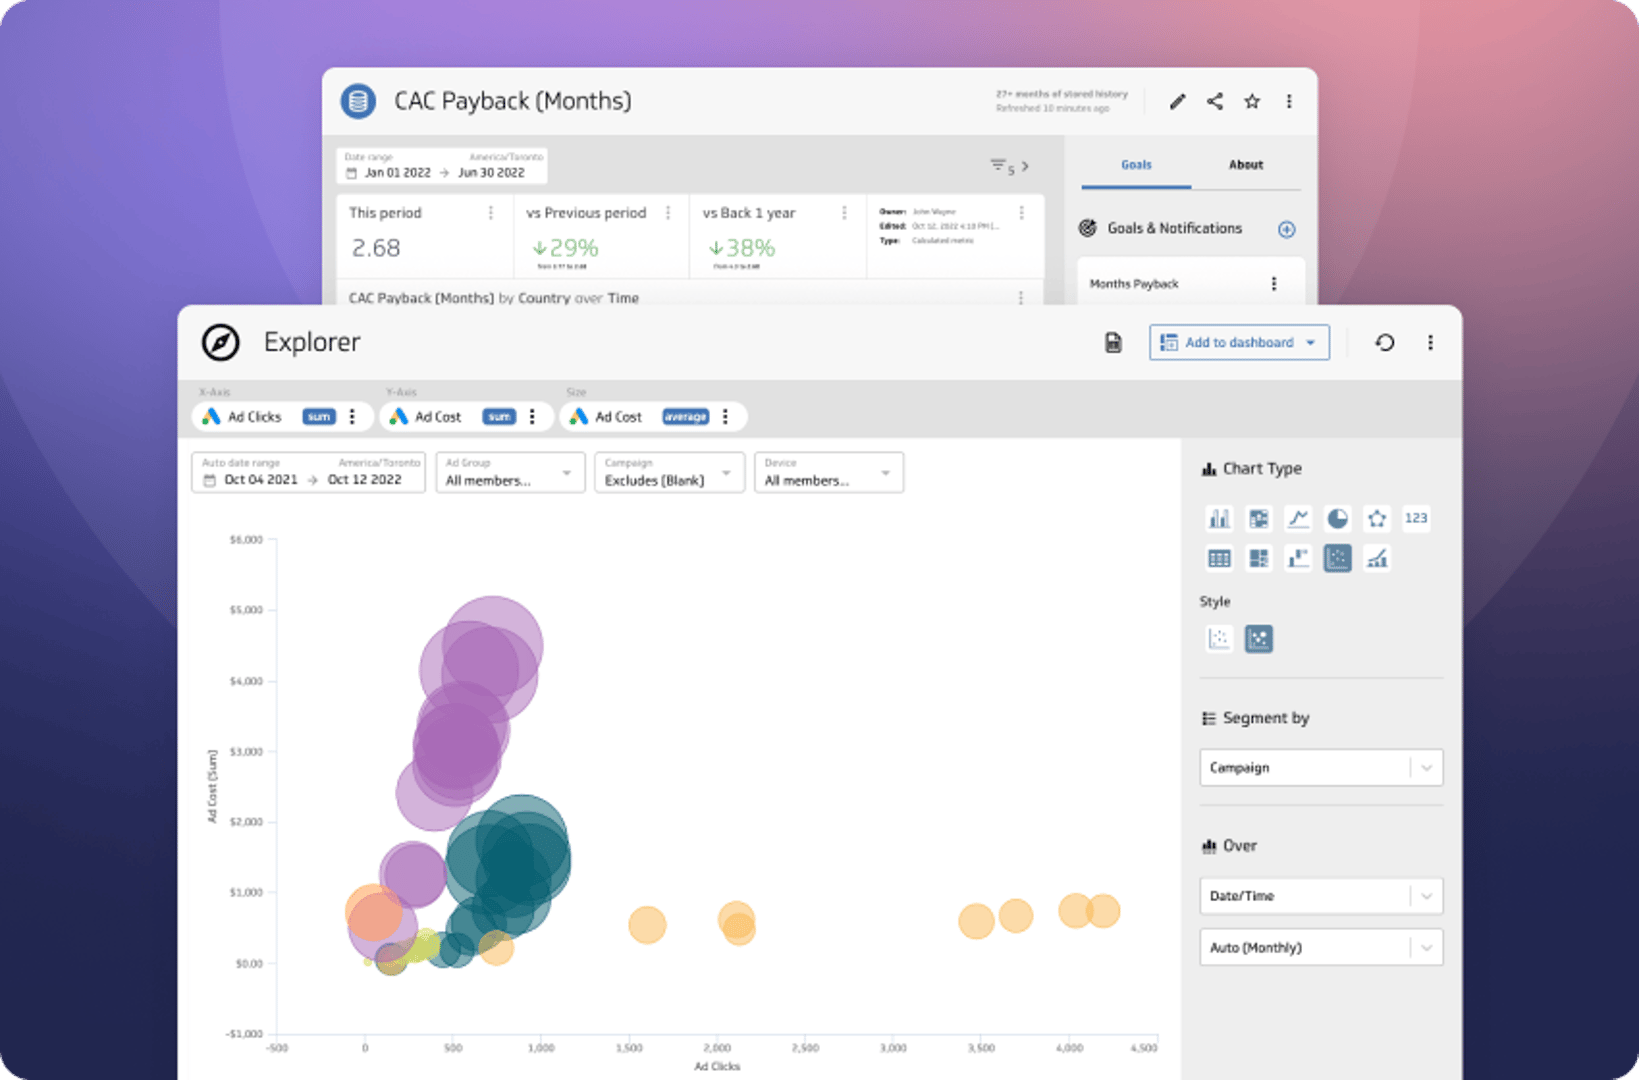
We’ve heard from hundreds of users that PowerMetrics provides a lot of choice, but they struggle to understand the best visualizations to use for the type of data they have in their metric. To help with this, once your data is defined, we now automatically create a homepage for each metric (instant, custom, or calculated). The homepage provides an overview of the metric’s performance in up to 7 visualizations.
On the homepage you will see: the metric’s current value, definition (if it’s an instant metric), previous period, segmentations, and multiple chart types. The charts are selected based on the type of data and shape of your metric but they can be further customized by each end user with date ranges, filters, segmentation, trend lines, and comparison periods. In addition, users can define goals that are relevant to the metric and visualize their goal progress directly on the homepage.
We designed the homepage to help users better understand their data with a clear, curated overview of a metric’s performance. When you create a metric, you can place it directly on a dashboard using one of the recommended visualization types. This saves you time building charts (or guessing which one to use) and dashboards, and opens up a world of possibilities for others on your team to use your data, too. Now, easily create custom dashboards and PDF reports by using any homepage visualization with just a few clicks or use any homepage visualization as a pre-built jumping off point for deeper data analysis in Explorer.
For instant metrics, the homepage also shows the metric definition and a link to more information on MetricHQ—our open and public repository of hundreds of metrics and KPIs curated by industry experts. Learn more about the Metric Homepage.
What is Explorer?
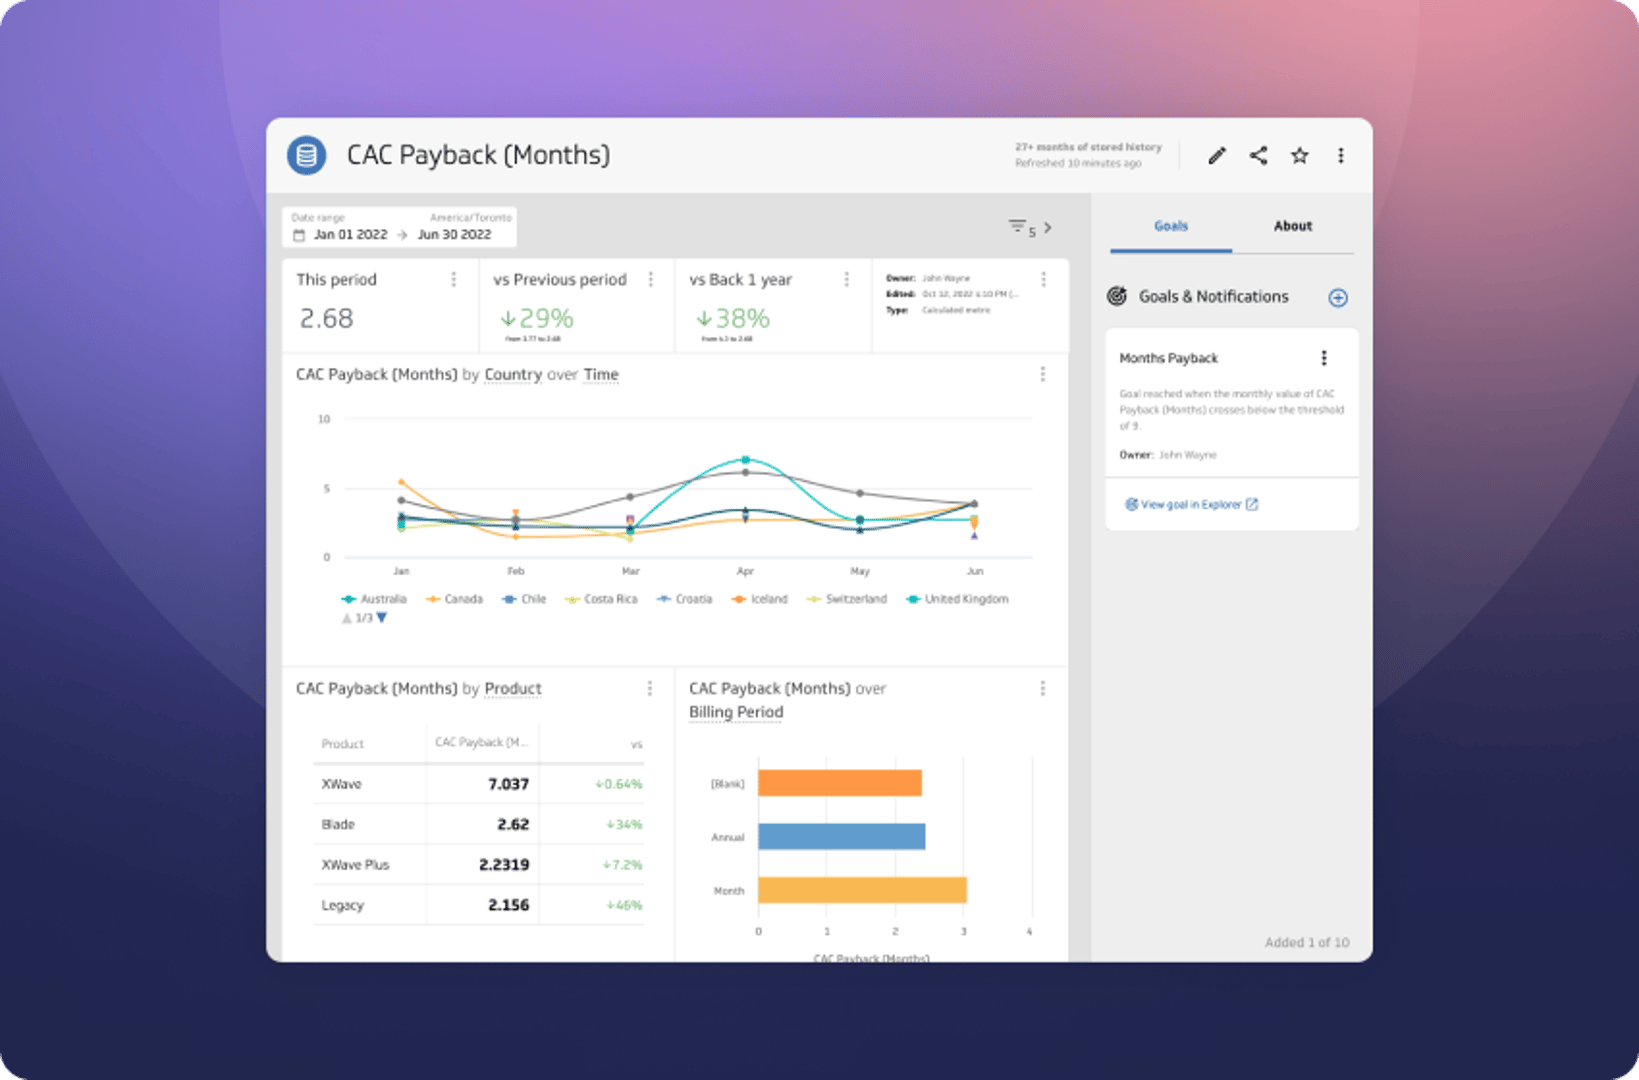
After the Metric Homepage, you can bring your metric into Explorer, a safe and playful environment for further data analysis. What makes Explorer different from the Metric Homepage? While the Homepage is an automatically generated overview of your metric, Explorer provides free-form data exploration of multiple metrics in a single visualization.
Explorer allows you to combine data from different data sources in one place where you can use the full suite of 30+ visualization types, flexible date ranges, and filters.
Explorer also allows you to change the aggregation for each metric independently, download a CSV to keep a record of your data, or import it into other tools. Finally, you can create dashboards in a snap by saving interesting explorations directly to them.
In many cases, displaying a single metric as a chart on your dashboard conveys a powerful, focused message. However, Explorer supports up to 5 metrics in a single exploration to help you compare and consolidate multiple metrics in one visualization. Create scatter, bubble, and combination charts—all of which require more than one metric—with ease. Learn more about the Explorer.
But there’s more to come…
We have more exciting features coming over the next month that help support the jobs to be done for metric and dashboard builders. However, we hope these two new features will help decision makers and their teams play with their data, gain insight faster, and leverage the full power of their metrics.
Related Articles

Case Study: How Media Propulsion Laboratory improved client analytics with the PowerMetrics – BigQuery integration
By Cathrin Schneider — September 12th, 2024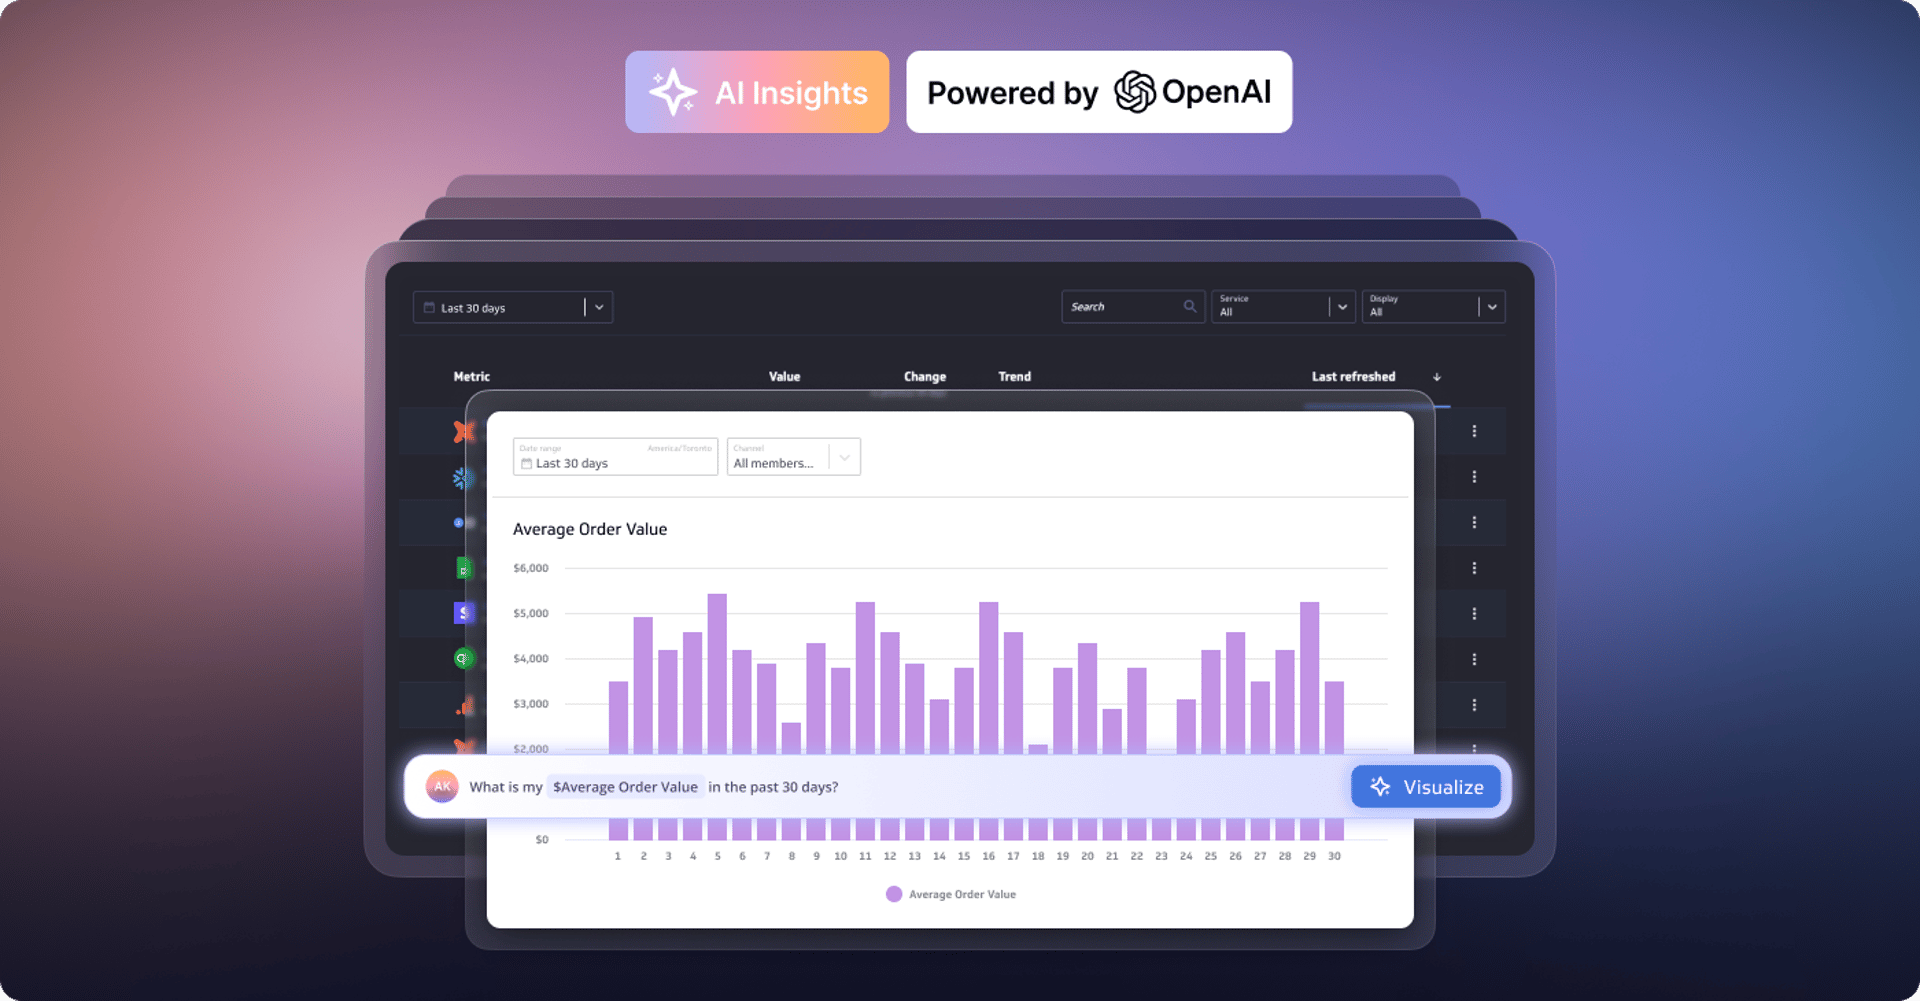
Metrics provide rich context for better AI: Introducing the new PowerMetrics AI experience
By David Mennie — June 21st, 2024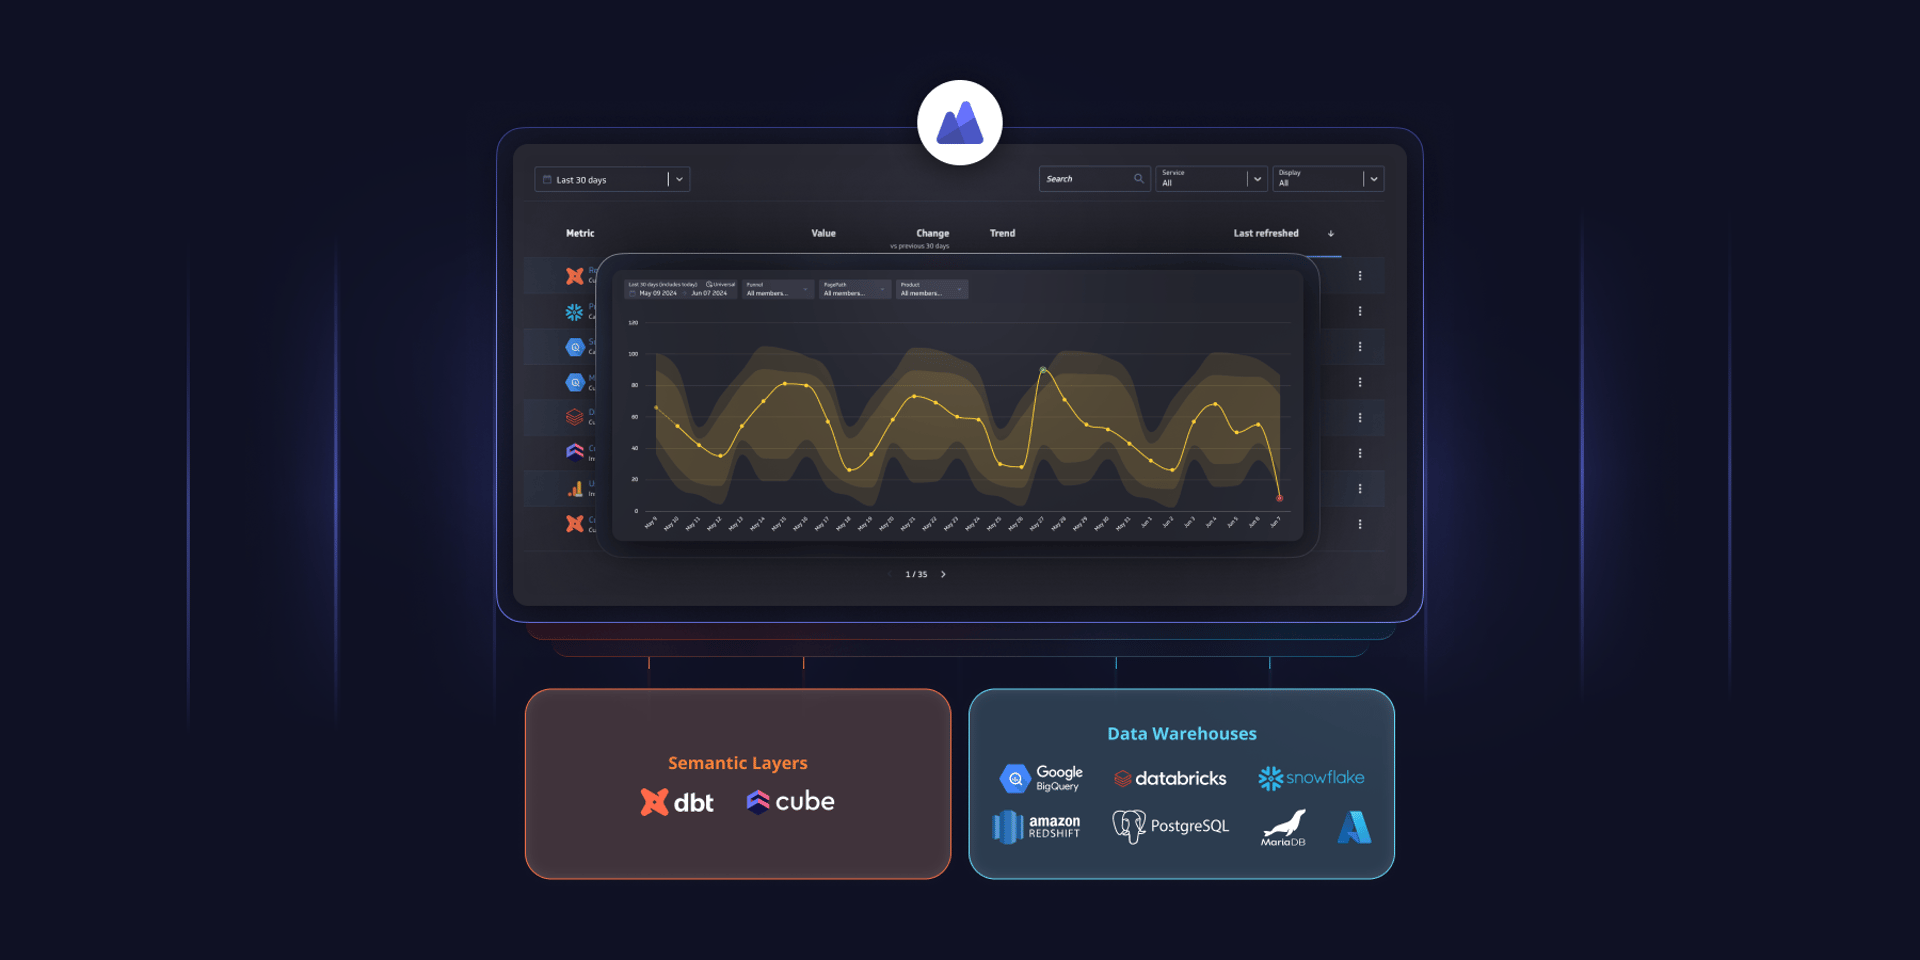
PowerMetrics - New data warehouse integrations and Cube semantic layer support
By David Mennie — June 14th, 2024