Turn your data into insights
Metrics measure your performance and progress against your goals and objectives and offer powerful ways to explore and share trusted data.
Get PowerMetrics Free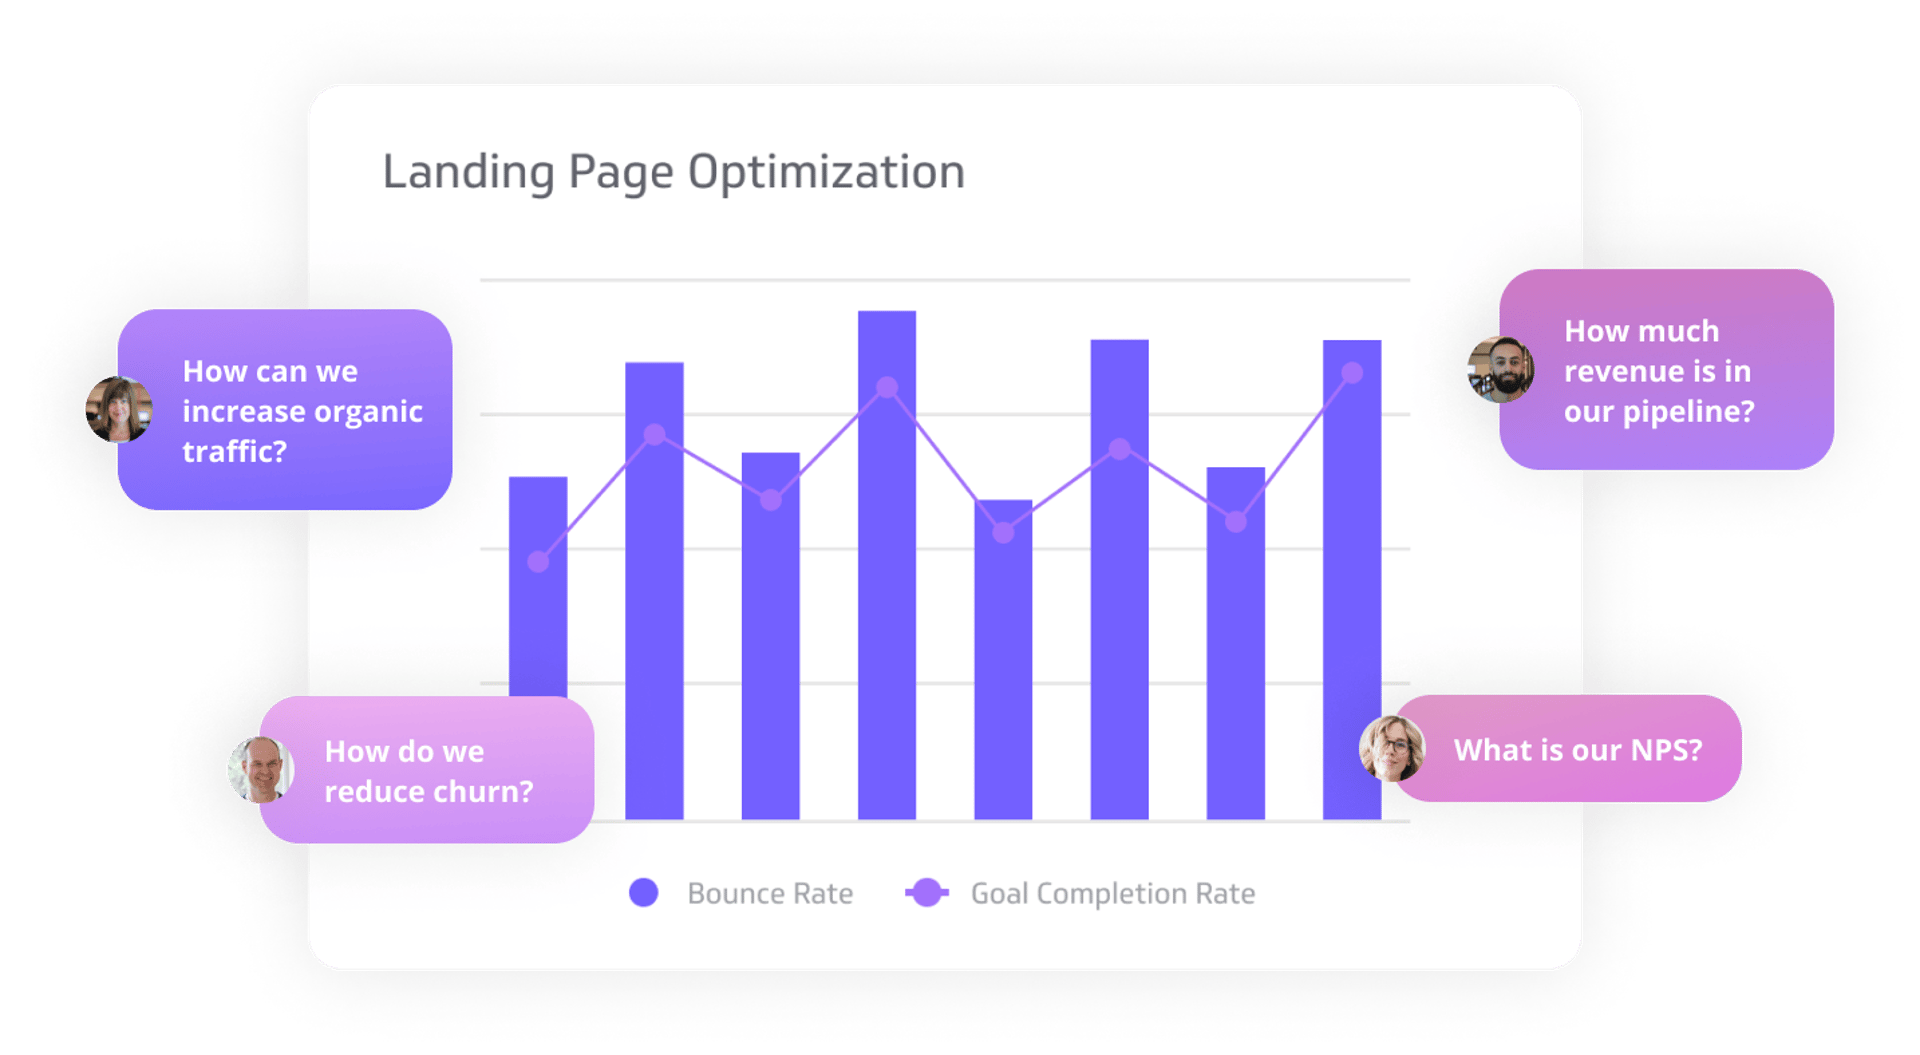

Explore your metrics
PowerMetrics is a self-serve way for teams to explore, visualize, and track their business data. Let your team instantly segment the data, look at it with different filters or visualization types, and create and share dashboards with ease. Metrics also automatically update with new data, while preserving your historical data, so you always have a record of your insights—right at your fingertips.
Get a head start into data exploration
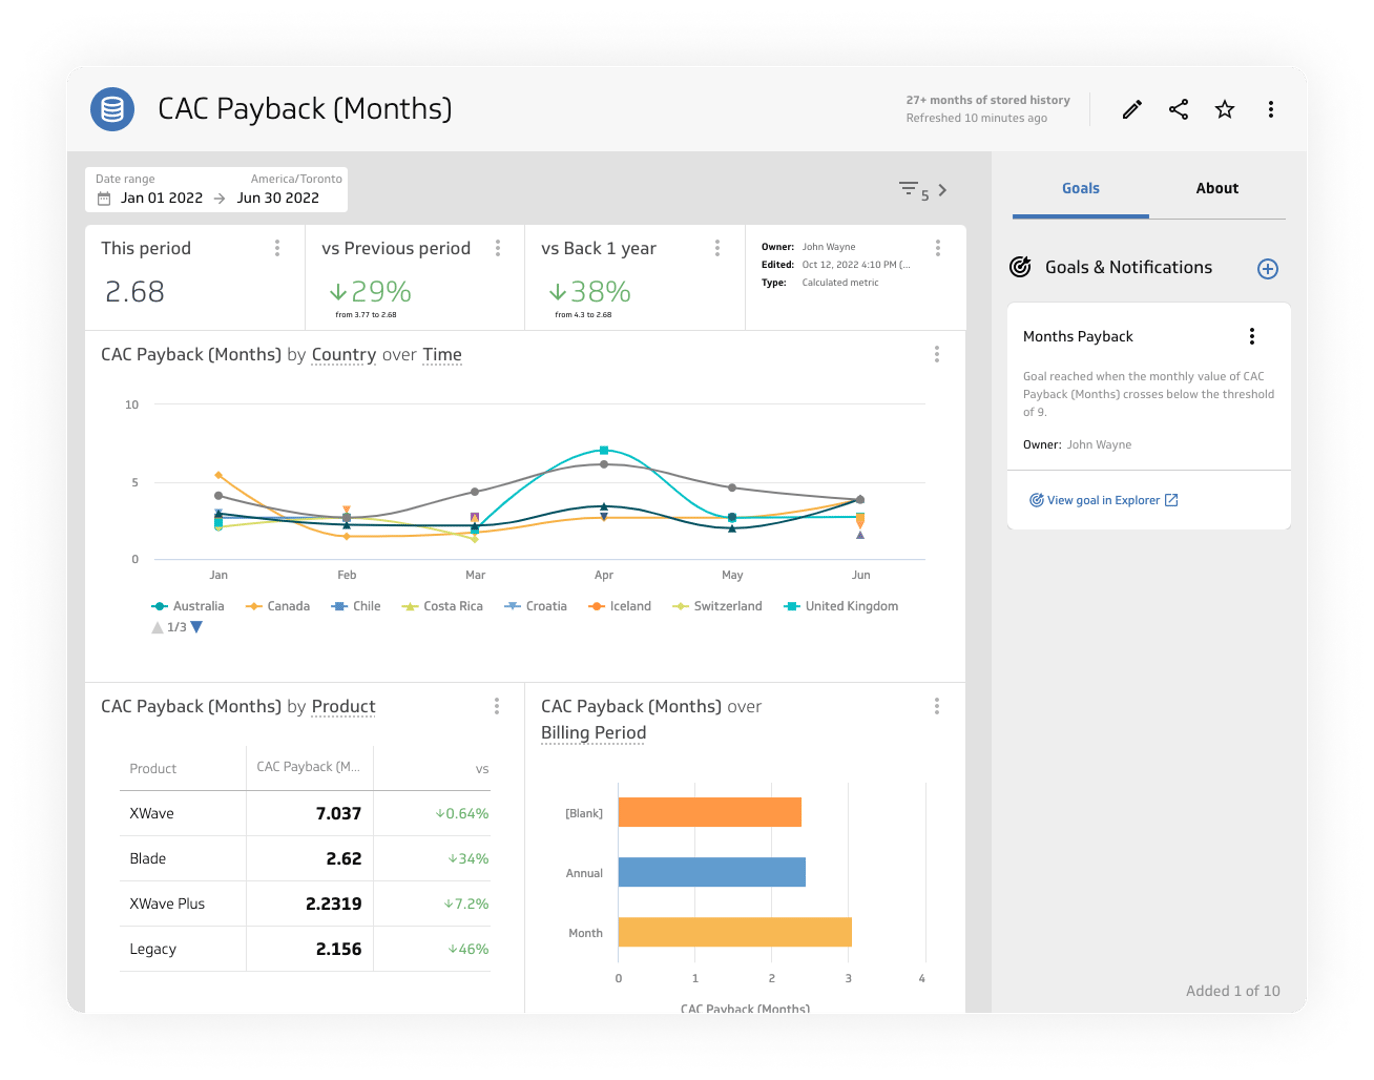
To help you get started with understanding your metrics, PowerMetrics automatically generates a homepage for each metric. This is a clear, curated overview of a metric’s performance in up to 7 visualizations. It is designed to get a first orientation, providing the value, definition, previous period, segmentations and multiple chart types.
The homepage is also the place to customize your metric’s visualization to make it your own. Easily create custom dashboards and PDF reports with just a few clicks or use any homepage visualization as a pre-built jumping off point for deeper data analysis.
Deep data exploration for everyone
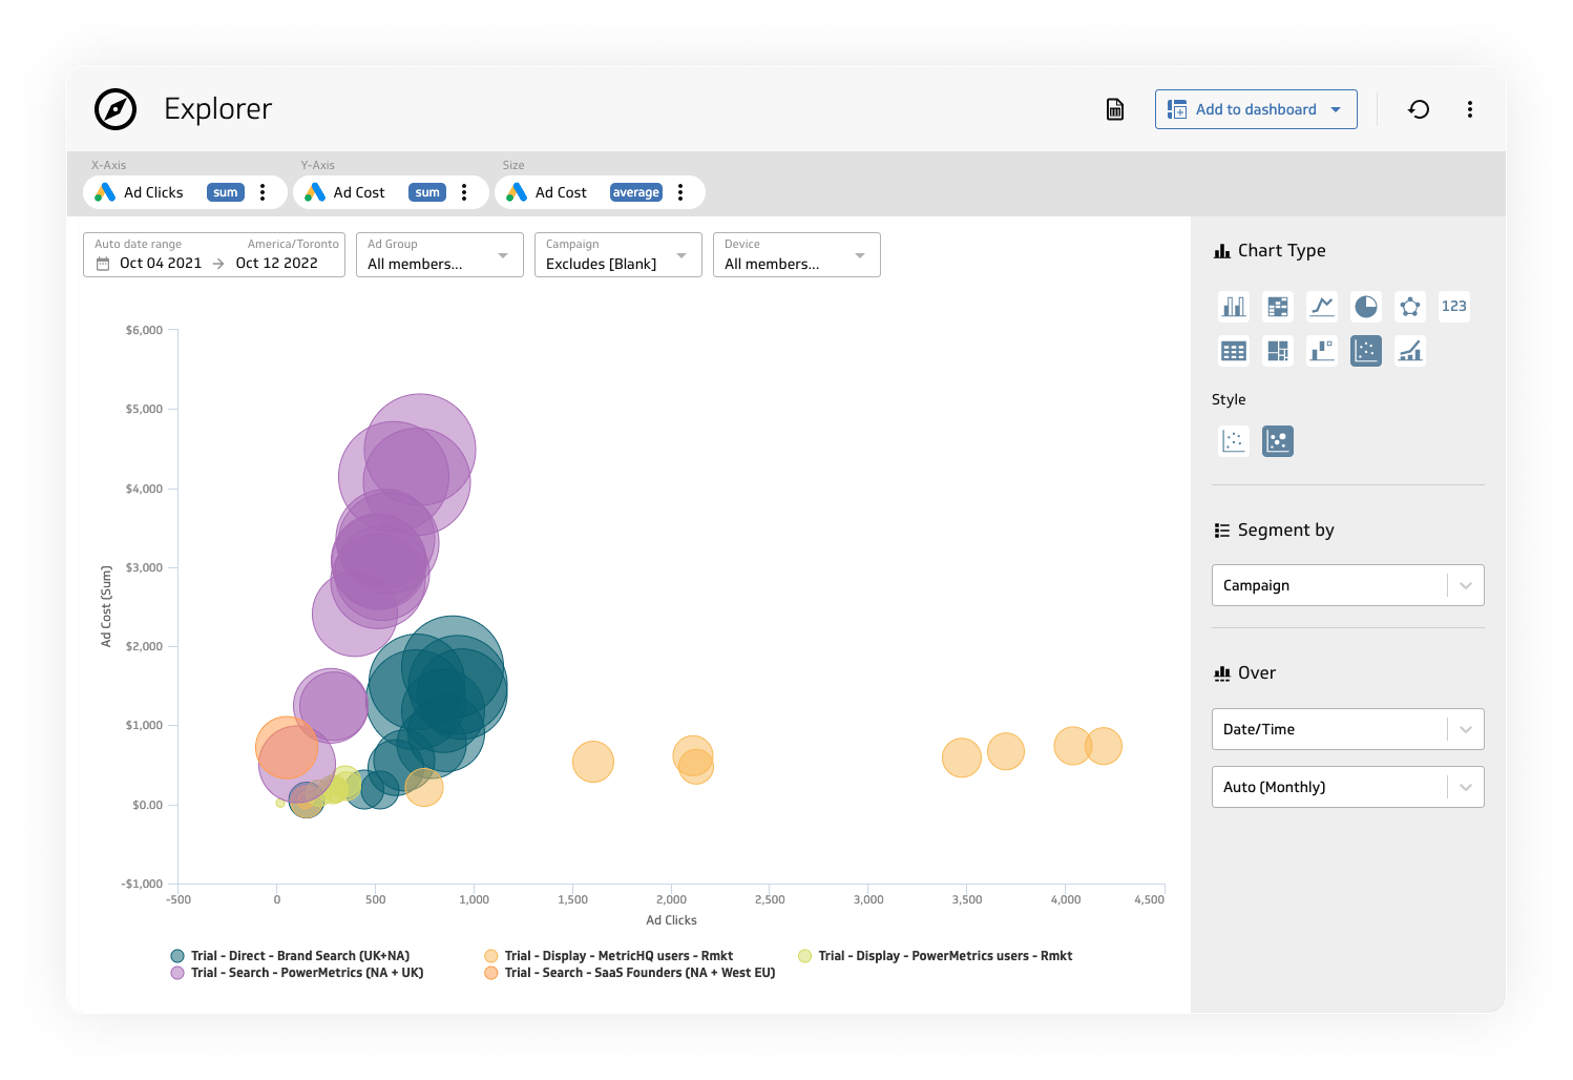
Explorer is a powerful tool to use to go deep into your data analysis. Combine data from different data sources and mix and match the data from up to 5 different metrics in one view. Explorer lets you use the full suite of visualization options, flexible date ranges, and filters in a playful and safe environment.
Once you've found your perfect visualization, save it to your dashboard and share it with your team.
Discover MetricHQ
MetricHQ is the place to discover metrics contributed and vetted by industry experts so you can level up on your data knowledge.
Need inspiration? Explore hundreds of pre-built metrics that you can instantly add to your PowerMetrics dashboard.
Rich and easy toolset
to explore your metrics
Once your metric is created, you can explore to get to the insight you need. Metric exploration is easy, regardless of your technical capabilities.
Data Visualizations
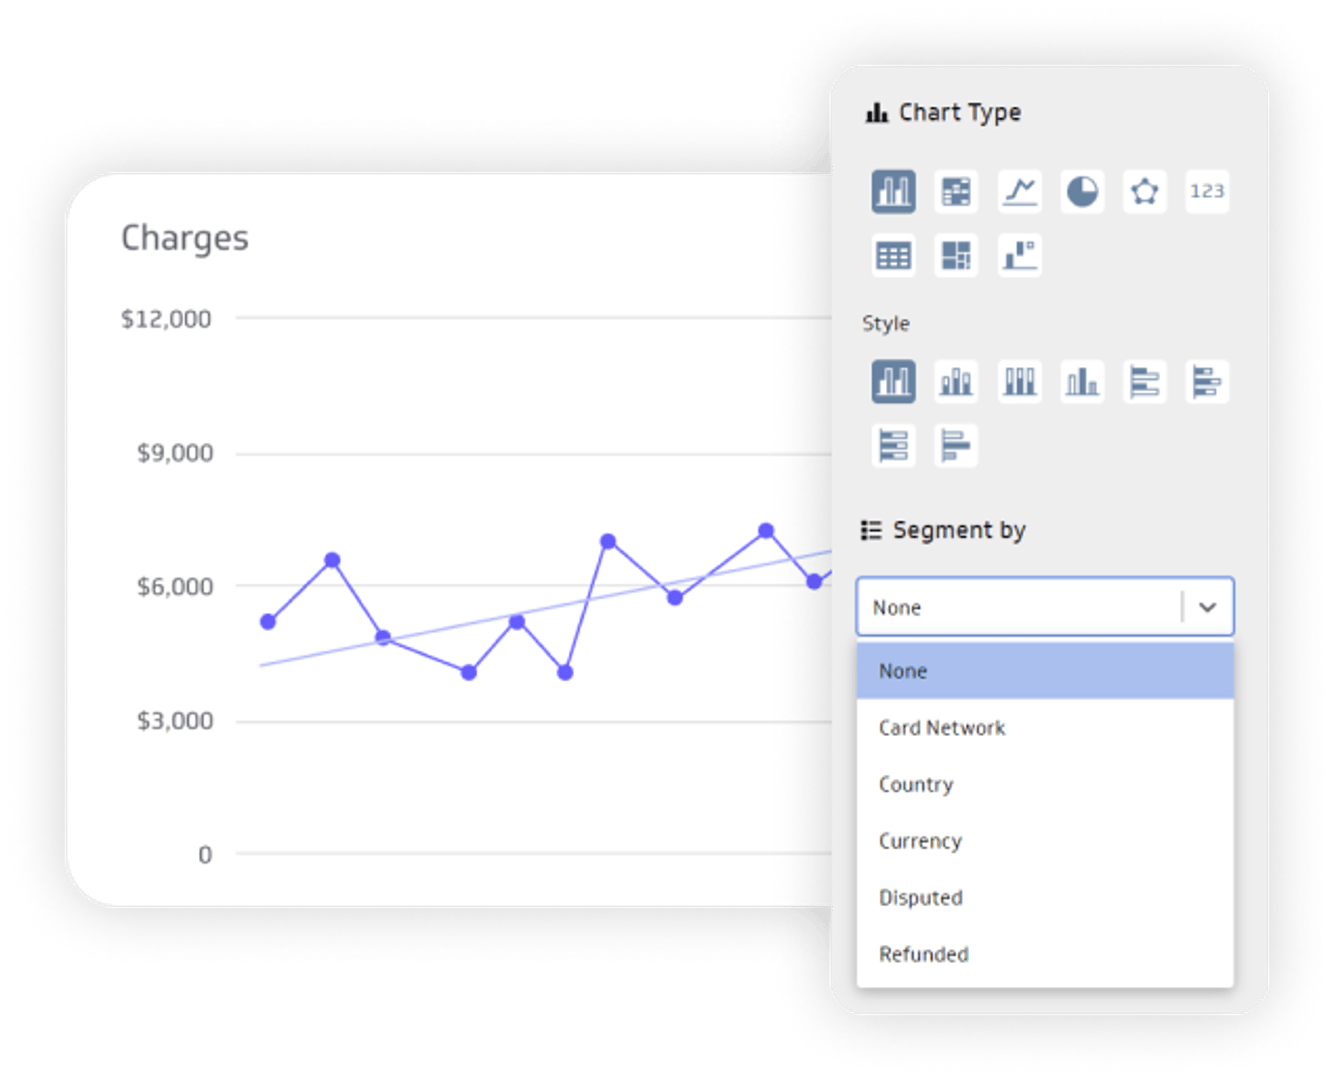
Choose from our rich library of 28 chart types to visualize your metric in one click. Change the visualization of your metrics to experiment with different views to articulate the message in your data. Or even combine two metrics from different data sources on one chart for deeper insights and smarter decisions.
Read more about the data visualization possibilities with PowerMetrics
Segments and Filters
Segments are a powerful way to slice and dice data and uncover deeper insights in just a few clicks. Filter by geography, customer type, channel, or other dimensions that are built into your metric. Add multiple filters to your selected segment to drill down even further. You can add up to five dimensions per metric to add depth to your analysis.
Time Periods
Each metric and dashboard has built-in date range controls for fast, efficient time period comparisons. Analyze today, last week, last month or last year’s data in one click, or select a custom date range and compare with the previous time period.
PowerMetrics stores all your data history so it’s at your fingertips when you need it. Data history allows you to monitor trends by adding a trend line to see how your data changes over time. No matter where you are in the world, all data is shown in the time zone you set in your account.
Turn your data
into insights
Get PowerMetrics FreeNext:
Data Visualizations
Data visualizations show you and your team the insights in your data. Change chart types or colours within seconds in our self-serve platform, no technical skills required!
Learn more