ACV vs ARR
ACV measures the average annual value of a single customer contract, while ARR tracks the total recurring revenue your business generates across all customers in a year. Understanding both helps you see not just how much revenue you have, but where it comes from and whether it will last.
ACV vs ARR by month
ACV and ARR are both annual revenue metrics used by SaaS companies, but they measure different things: Annual Contract Value captures the average yearly value of a customer contract, while Annual Recurring Revenue tracks the total recurring revenue your business generates in a year.
Understanding both helps you see not just how much revenue you have, but where it comes from and whether it will last.
What is ACV (Annual Contract Value)?
Annual Contract Value (ACV) is the average annual revenue generated from a single customer contract. It normalizes contract value across different lengths so you can compare deals on equal footing.
ACV is especially useful for SaaS companies with multi-year contracts or customers on different billing cycles. It tells you how much a typical customer is worth per year, which directly informs decisions about pricing, sales targets, and customer acquisition spend.
How to calculate Annual Contract Value
Divide the total contract value by the number of years in the contract:
Annual Contract Value = Total contract value / Number of years
Example: Annual subscription
A customer signs a 5-year contract worth $120,000:
ACV = $120,000 / 5 = $24,000
Example: Monthly subscription
A customer pays $70 per month on a 3-year contract. First, find the annual rate and total contract value:
Annual rate = $70 × 12 = $840
Total contract value = $840 × 3 = $2,520
ACV = $2,520 / 3 = $840
Always convert monthly rates to annual before dividing. Using the monthly figure directly will significantly understate the ACV.
How to calculate ACV across multiple contracts
When you have many customers on different contracts, calculate the ACV for each group, then find the average across all contracts.
Example:
- 3 customers on a 1-year contract worth $25,000 each
- 2 customers on a 2-year contract worth $50,000 each
- 1 customer on a 5-year contract worth $150,000
Calculate ACV per group:
Group 1: $25,000 / 1 year × 3 customers = $75,000
Group 2: $50,000 / 2 years × 2 customers = $50,000
Group 3: $150,000 / 5 years × 1 customer = $30,000
Total ACV across all customers: $75,000 + $50,000 + $30,000 = $155,000
Average ACV: $155,000 / 6 customers = $25,833
That number tells you what a typical customer contributes per year. It shapes how you set acquisition budgets, quota targets, and renewal priorities, without having to dig into every individual contract each time.
Why ACV matters
ACV is a core SaaS metric for understanding the shape of your revenue. A rising ACV means customers are signing larger or longer deals. A falling ACV may signal pricing pressure or a shift toward shorter commitments.
Here is what ACV helps you act on:
- Revenue concentration: Identify which customers generate the most annual value and where to focus retention efforts.
- Sales productivity: Measure whether your team is closing larger deals over time.
- Pricing decisions: Spot when discounts or incentives are eroding per-contract value.
- Forecasting: Set realistic revenue targets based on average deal size rather than guessing from one-off contracts.
What is ARR (Annual Recurring Revenue)?
Annual Recurring Revenue (ARR) is the total revenue your business expects to receive from active subscriptions over a 12-month period. It excludes one-time fees and focuses only on what recurs.
ARR is the number most SaaS leaders watch closely because it reflects the predictable, compounding engine of the business. When ARR grows consistently, you have a foundation for confident hiring, investment, and planning decisions. You are not estimating; you are working from a number you can trust.
How to calculate Annual Recurring Revenue
The simplest version uses Monthly Recurring Revenue (MRR):
ARR = MRR × 12
Example:
If your MRR is $12,000:
ARR = $12,000 × 12 = $144,000
This works well when your subscription base is stable. When customers are churning, upgrading, or downgrading throughout the year, use the expanded formula:
ARR = ARR at start of year
    + ARR from new customers
    + ARR from upgrades
    - ARR lost to downgrades
    - ARR lost to churn
Example with changes:
You start the year with 200 subscribers at $2,000 each. Base ARR:
200 × $2,000 = $400,000
During the year:
- 30 new customers join at $2,000
- 50 existing customers upgrade from $2,000 to $3,000 (adding $1,000 each)
- 10 customers downgrade from $2,000 to $1,500 (losing $500 each)
- 5 customers cancel (losing $2,000 each)
ARR = $400,000
    + (30 × $2,000)
    + (50 × $1,000)
    - (10 × $500)
    - (5 × $2,000)

ARR = $400,000 + $60,000 + $50,000 - $5,000 - $10,000
ARR = $495,000
Tracking ARR this way shows you not just the total, but where growth is coming from and where you are losing ground. That distinction matters when you need to decide where to act.
Why ARR matters
ARR tells you whether your business is growing, holding steady, or eroding. It is the single number that most investors, boards, and leadership teams use to assess the health of a SaaS company.
ARR helps you:
- Forecast cash flow with confidence, because recurring revenue is predictable.
- Allocate budget across sales, marketing, and product based on what you can reliably count on.
- Spot churn early by watching ARR lost to cancellations and downgrades.
- Set growth targets grounded in actual subscription trends rather than projections built from scratch.
- Benchmark performance against prior periods or industry standards.
When ARR is visible in real time, you are not waiting for a monthly report to know whether the business is on track. You know it without having to ask, and you can act on it while the window is still open.
ACV vs ARR: key differences
Both metrics measure annual revenue, but they answer different questions. Use this table to see where each one applies:
| ACV | ARR | |
|---|---|---|
| What it measures | Average annual value of a single contract | Total annual recurring revenue across all customers |
| Scope | Per-contract or per-customer | Whole business |
| Includes one-time fees | Sometimes | No |
| Best for | Pricing, sales benchmarking, deal analysis | Business health, forecasting, investor reporting |
| Changes when | A new deal is signed or renewed | A customer subscribes, upgrades, downgrades, or churns |
The practical difference: ACV tells you what a deal is worth. ARR tells you what the business is worth, on a recurring basis.
A company could have a high ACV but a low ARR if it has few customers. Conversely, a business with many small contracts might show strong ARR while individual ACV figures remain modest. Both views matter, and neither one alone gives you the full picture.
Who uses ACV and ARR?
Create custom dashboards for you and your team.
Get started with KlipsSaaS companies
SaaS companies are the primary users of both metrics. ARR tracks the health of the subscription engine. ACV benchmarks deal size and informs sales compensation and quota-setting. Together, they give leadership a clear picture of revenue quality and growth trajectory.
Financial services
Banks, credit unions, and wealth management firms use ARR to track recurring revenue from deposit accounts and ongoing service fees. ACV helps them assess the value of longer-term client relationships and advisory contracts.
Retail and subscription businesses
Retailers with loyalty programs or subscription boxes use ARR to measure predictable recurring revenue. ACV helps them understand the annual value of a typical member relationship and whether promotional offers are helping or hurting that value.
Telecom companies
Telecom providers use ACV to value new plan sign-ups and multi-year contracts. ARR captures the recurring revenue from active data plans, roaming agreements, and service bundles.
How to track ACV and ARR without the manual work
Calculating ACV and ARR once is straightforward. Keeping them accurate across hundreds or thousands of customers, through upgrades, downgrades, and churn, is where spreadsheets break down.
When your numbers live in separate systems and someone has to pull them together manually, there is always a lag. By the time the report lands, the moment to act may have passed. And if you are pasting figures into a spreadsheet or copying numbers into a chat tool to make sense of them, you are spending time on assembly that should go toward decisions.
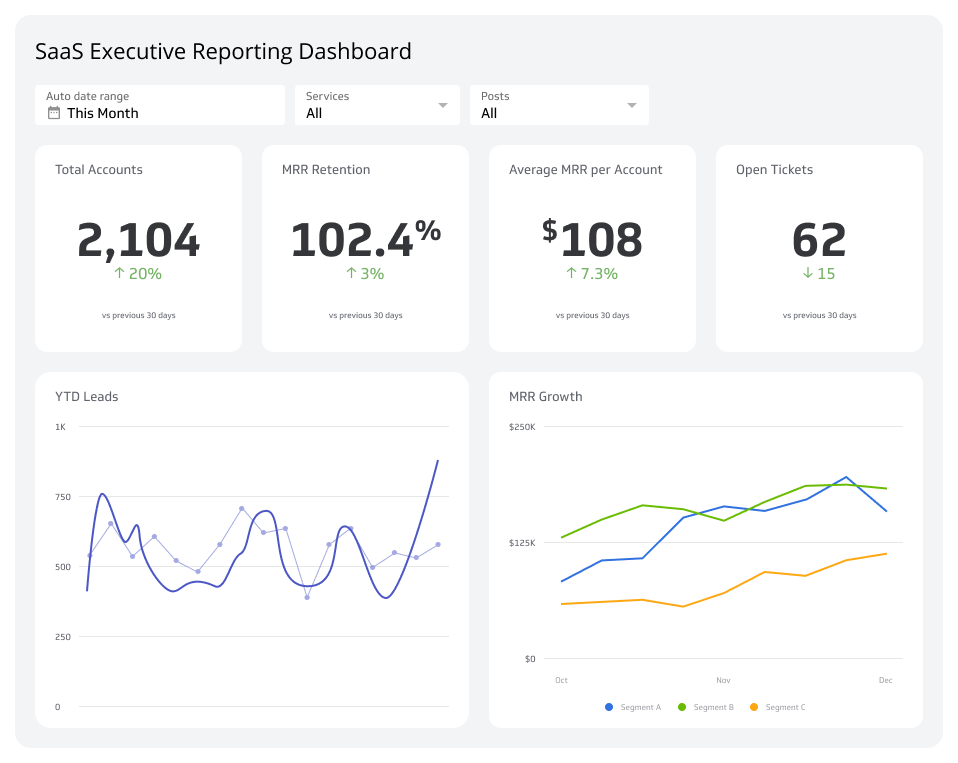
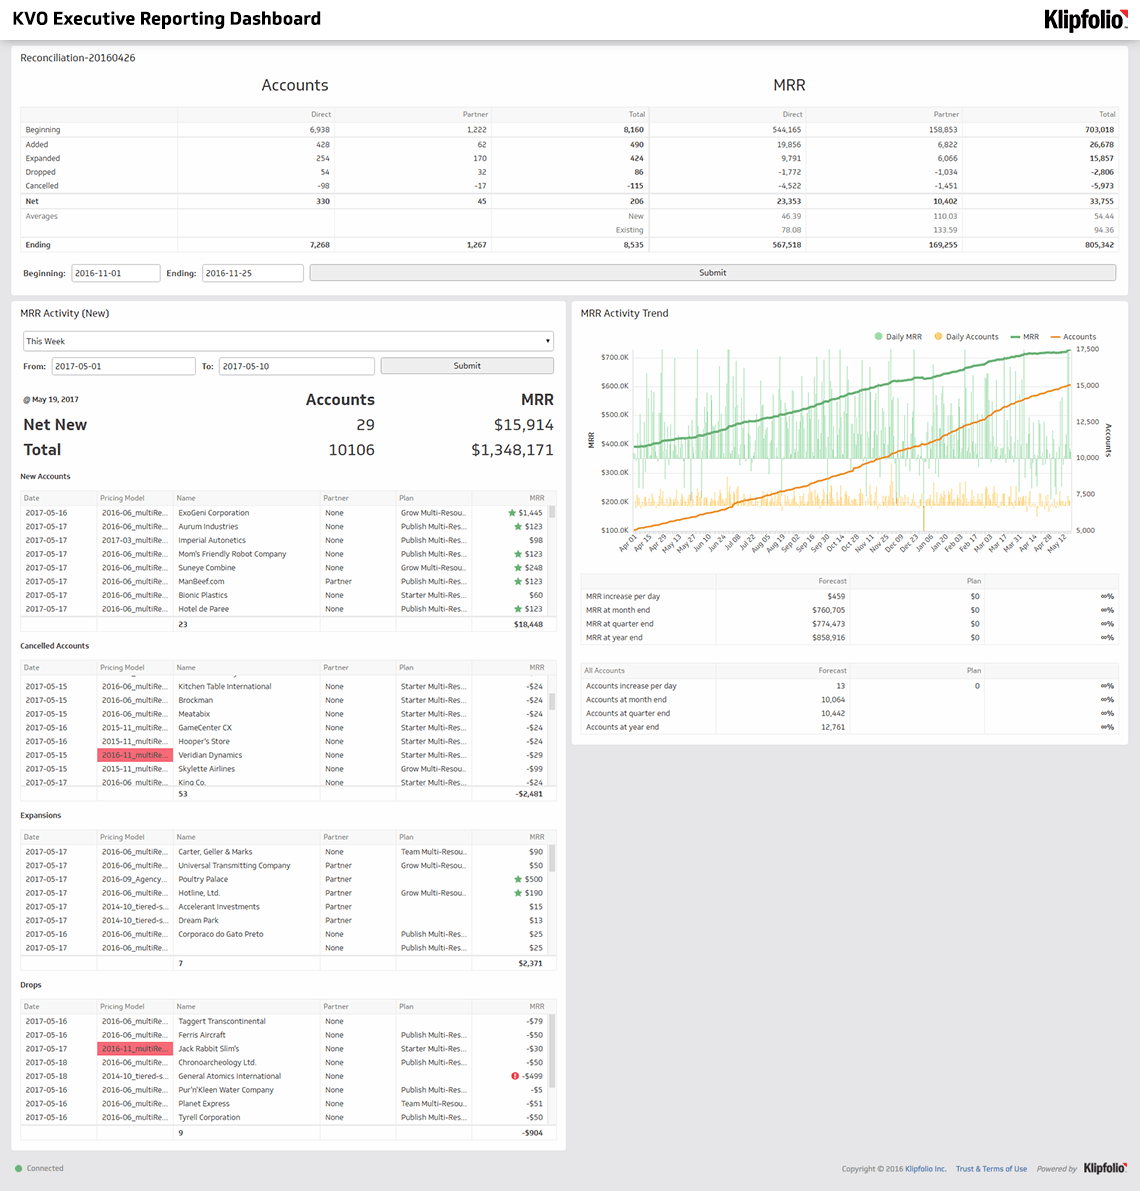
A Klipfolio dashboard connects directly to your billing and CRM data, so ACV and ARR update automatically. Your whole team sees the same numbers, in real time, without waiting for someone to run the calculation. That means faster decisions, fewer errors, and no more conversations that start with "which version of the spreadsheet are we using?"
Frequently asked questions
Are there specific timeframes for ACV and ARR?
No. ACV and ARR are both annualized metrics, but the period you use to track them is up to you. What matters is consistency: if you calculate on a rolling 12-month basis, do that every time. Switching methods mid-stream makes benchmarking unreliable.
What factors influence ACV and ARR?
Pricing is the most direct factor: your pricing strategy sets the ceiling for both metrics. Beyond pricing, ACV is shaped by deal length and contract structure. ARR is influenced by churn, expansion revenue from upgrades, and the pace of new customer acquisition. Customer behaviour and competitive pressure affect both.
How can you increase ARR and ACV?
To grow ACV, focus on moving customers to longer contracts or higher-value tiers. Improve the sales process so reps are closing deals that reflect the full value of the product.
To grow ARR, reduce churn, increase expansion revenue from existing customers, and bring in new subscribers consistently. All three levers matter: a business that acquires well but retains poorly will see ARR stall.
Which team should calculate ACV and ARR?
Finance typically owns the official calculation. Sales uses ACV to set targets and measure deal quality. Leadership watches ARR as a top-line health indicator. Marketing uses both to assess whether campaigns are attracting the right customers. In practice, everyone benefits from seeing these numbers, which is why centralizing them in a shared dashboard is worth the effort.