Software Development Dashboard
A real-time view of your key software development metrics and project breakdown.
What is a Software Development Dashboard?
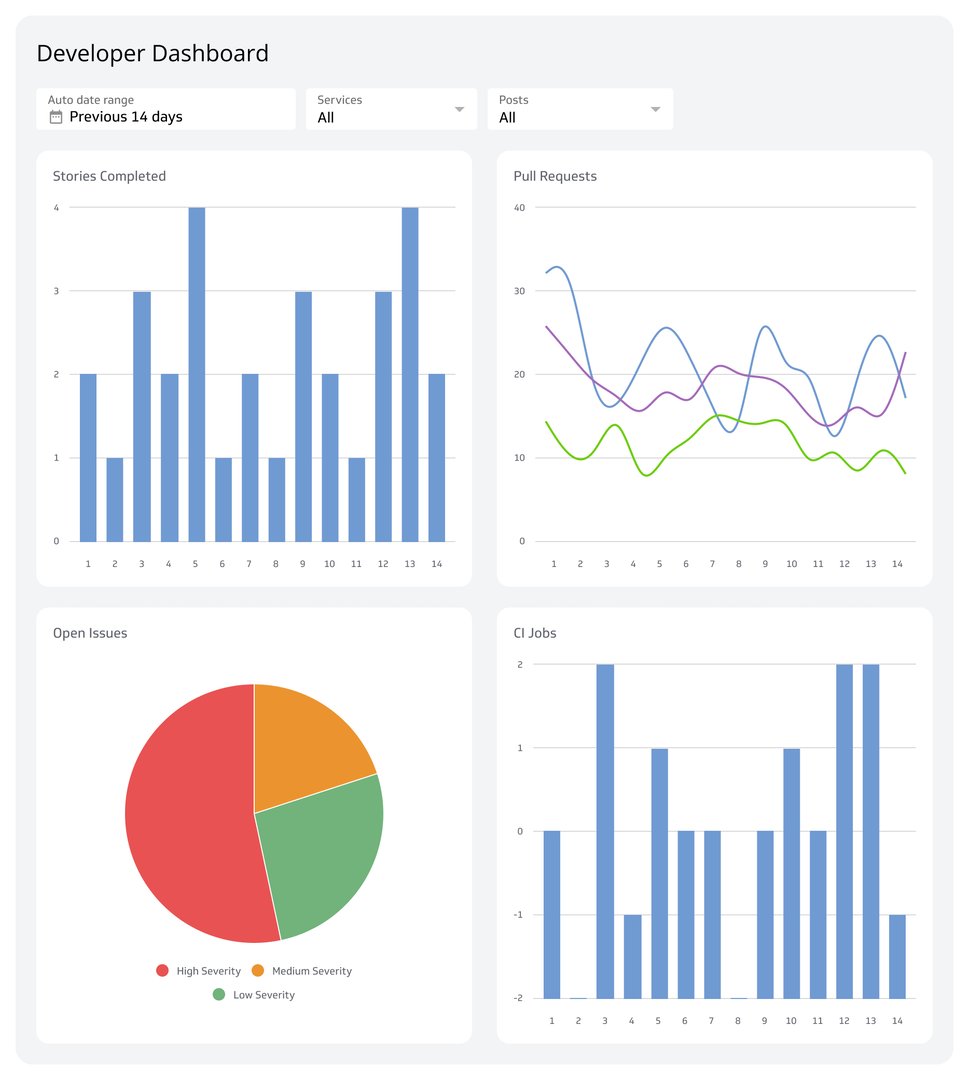
This Developer Dashboard displays a project burndown and release tracker to help keep the DevOps team on the same page.
Developers are the key to website performance and feature development. Keeping track of the investment into bugs and features is critical in running a smooth system. The dashboard also displays Unresolved issues, WIP limits, and feature vs. bug investment to help the team keep the website performing and tackle any issues that come up right away.
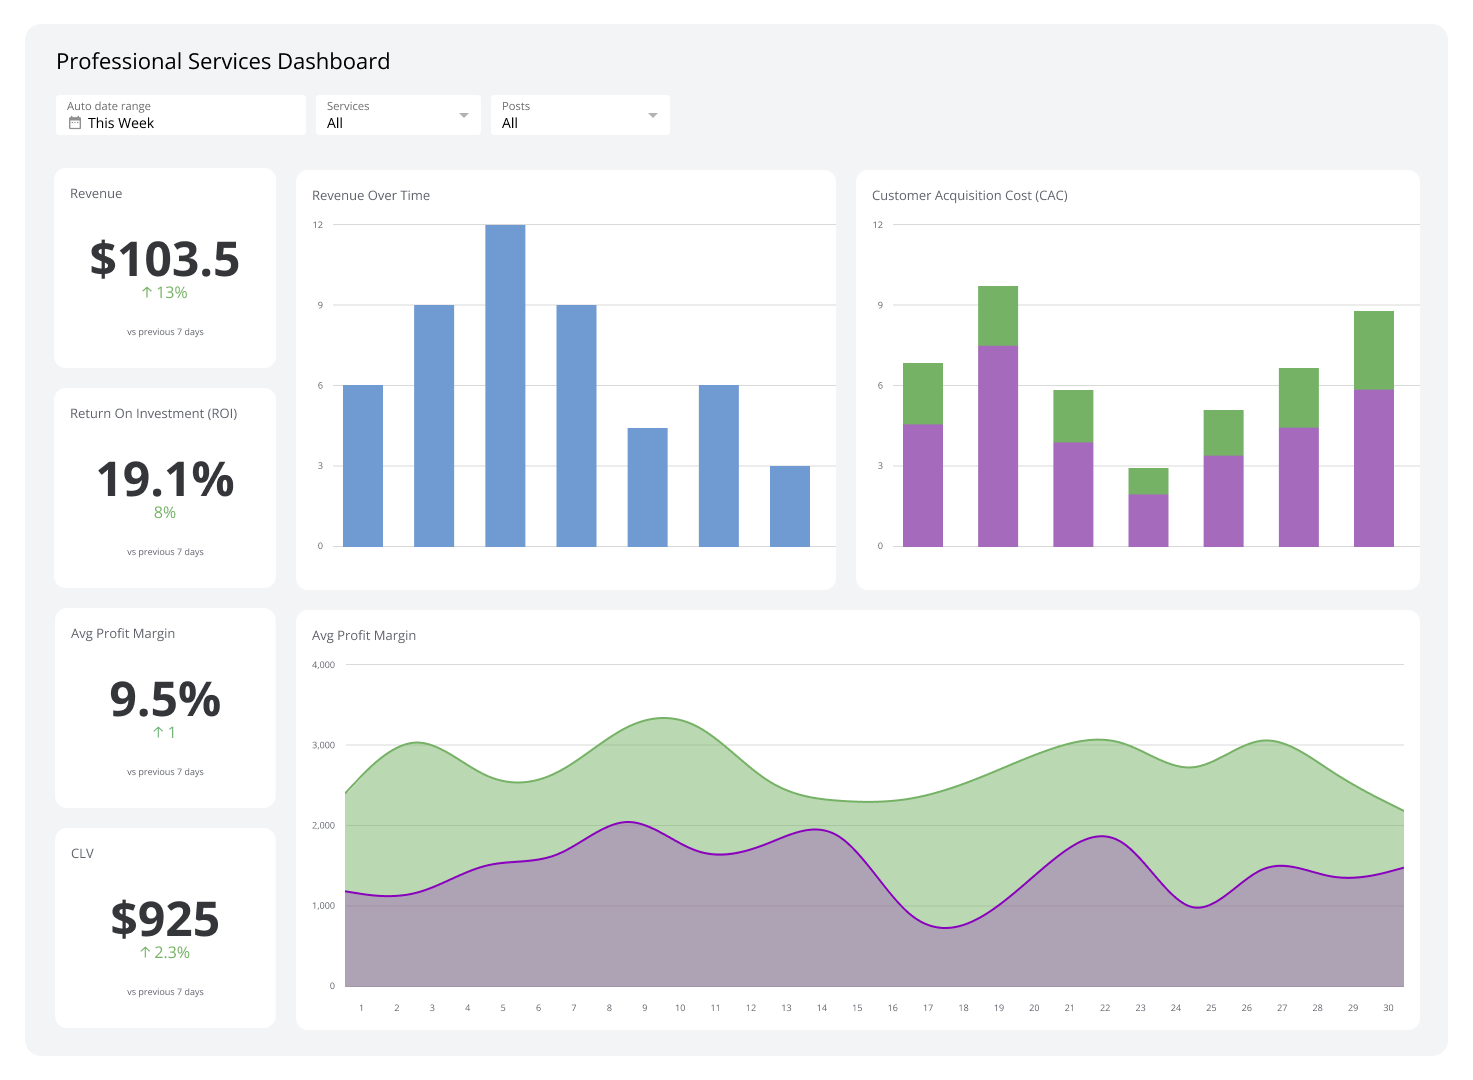
Relevant KPIs and metrics
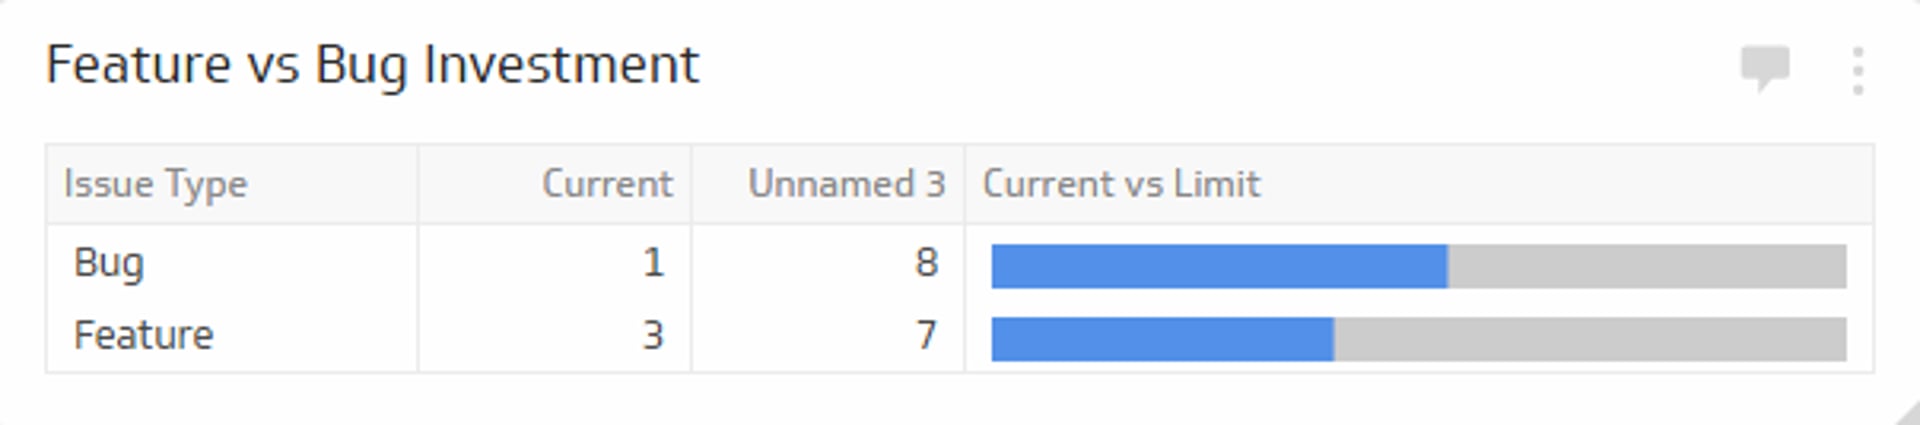
Feature vs. Bug Investment
The Feature vs. Bug Investment metric displays the number of bug issues vs. feature issues your DevOps team has to work on.
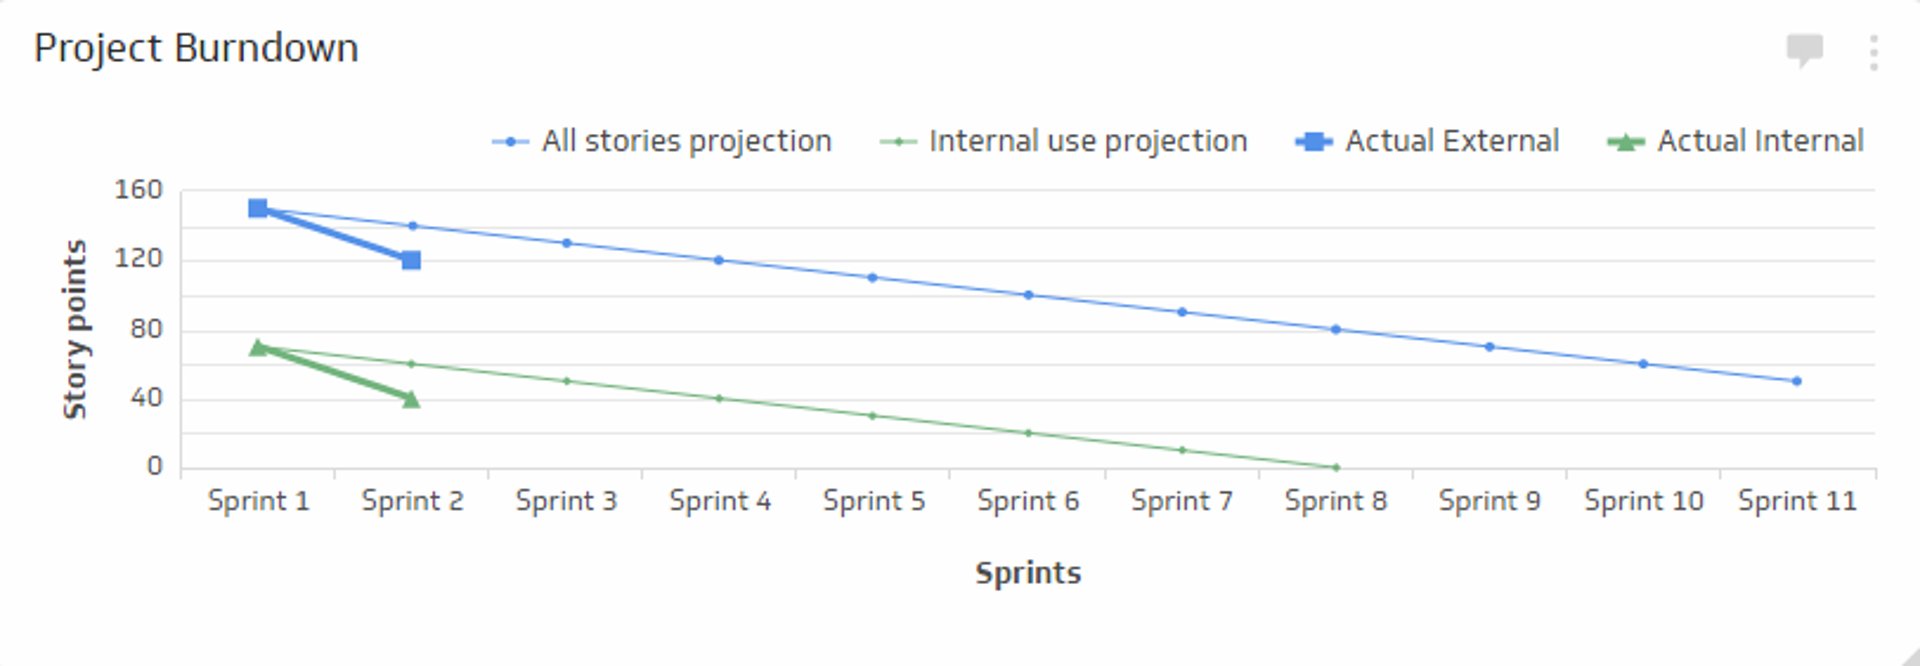
Project Burndown
The Project Burndown metric displays the different project sprint projections vs. actual project sprints.
Release Tracker
The Release Tracker metric displays feature releases that are in the pipeline, under review, and in progress.
Related Dashboards
View all dashboards