6 QuickBooks metrics every small business needs to track on their accounting dashboard

Summary - An accounting dashboard can make insights easier to communicate, transforming you from just the numbers person to a business superhero.
As an accountant, you have your fingers on the financial pulse of the business, which is why you use QuickBooks. That’s why others rely on you to share insights on the company’s historical trends, present state and future financial trajectory. An accounting dashboard can make your insight a whole lot easier to communicate, transforming you from just the numbers person to a business superhero.
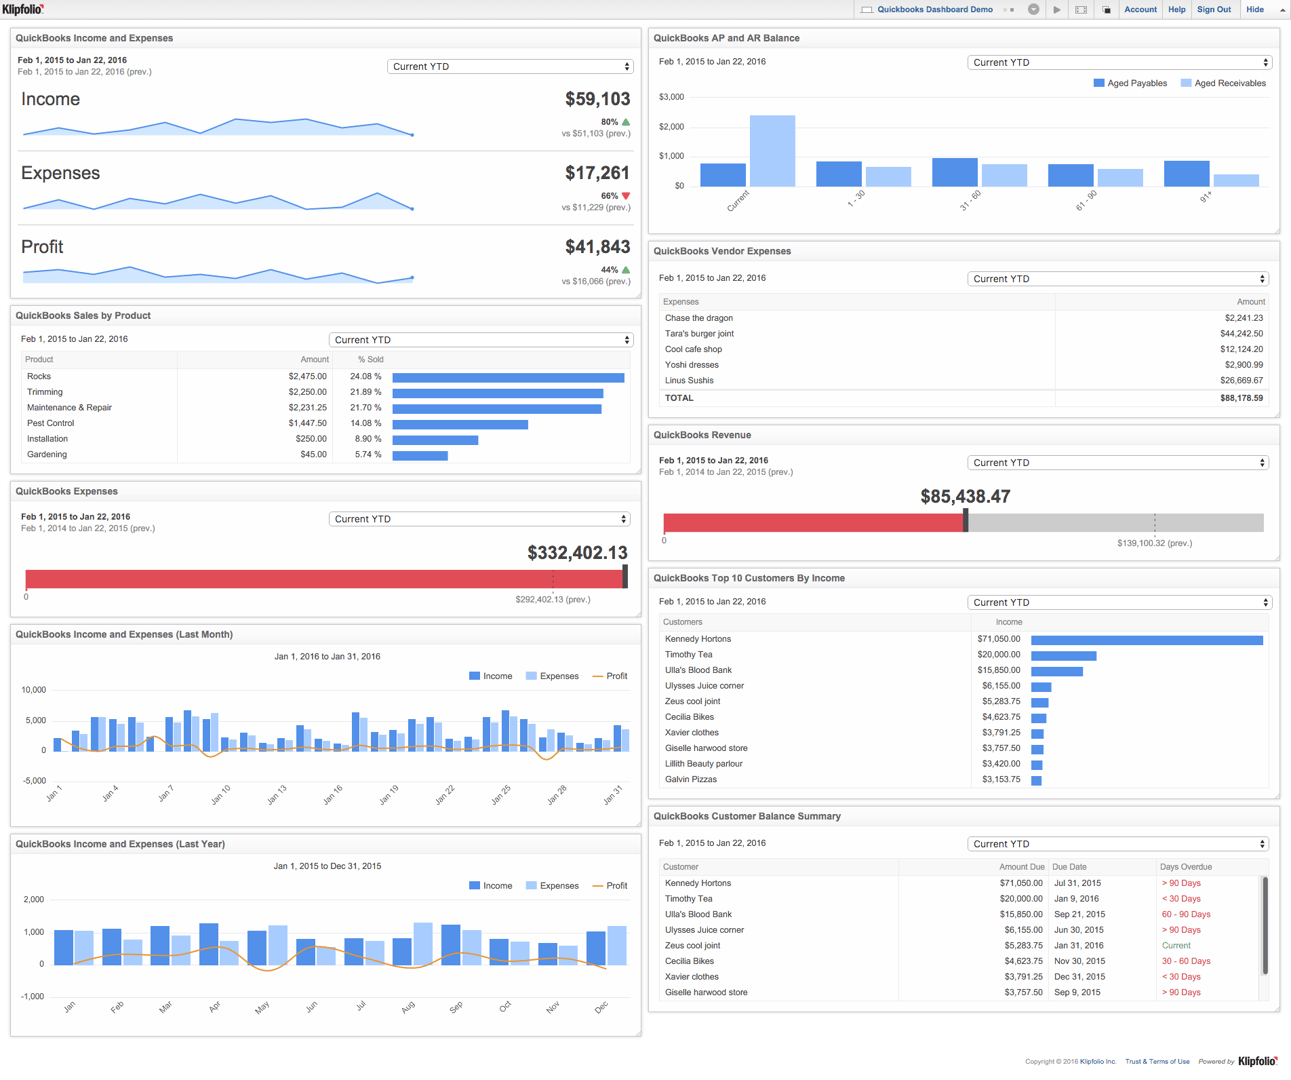
QuickBooks small business accounting dashboard example
One reason why many small businesses fail after only a few years is because owners use “gut feelings” when making important decisions. But when you connect your accounting data to an interactive dashboard, you’ll give your team insight on all aspects of the business: revenue, sales, expenses, historical trends and more. If you let your business reach the next phase of growth armed with a financial dashboard, your team will never have to make decisions in the dark again.
6 QuickBooks metrics for small businesses
Small business owners need to efficiently move down a path of entrepreneurial growth. Define your organization's KPIs and use your dashboard to track real-time metrics on the financial well-being of your business. Here are some pre-built QuickBooks Klips that just waiting for you to add to your dashboard.
Sales by product
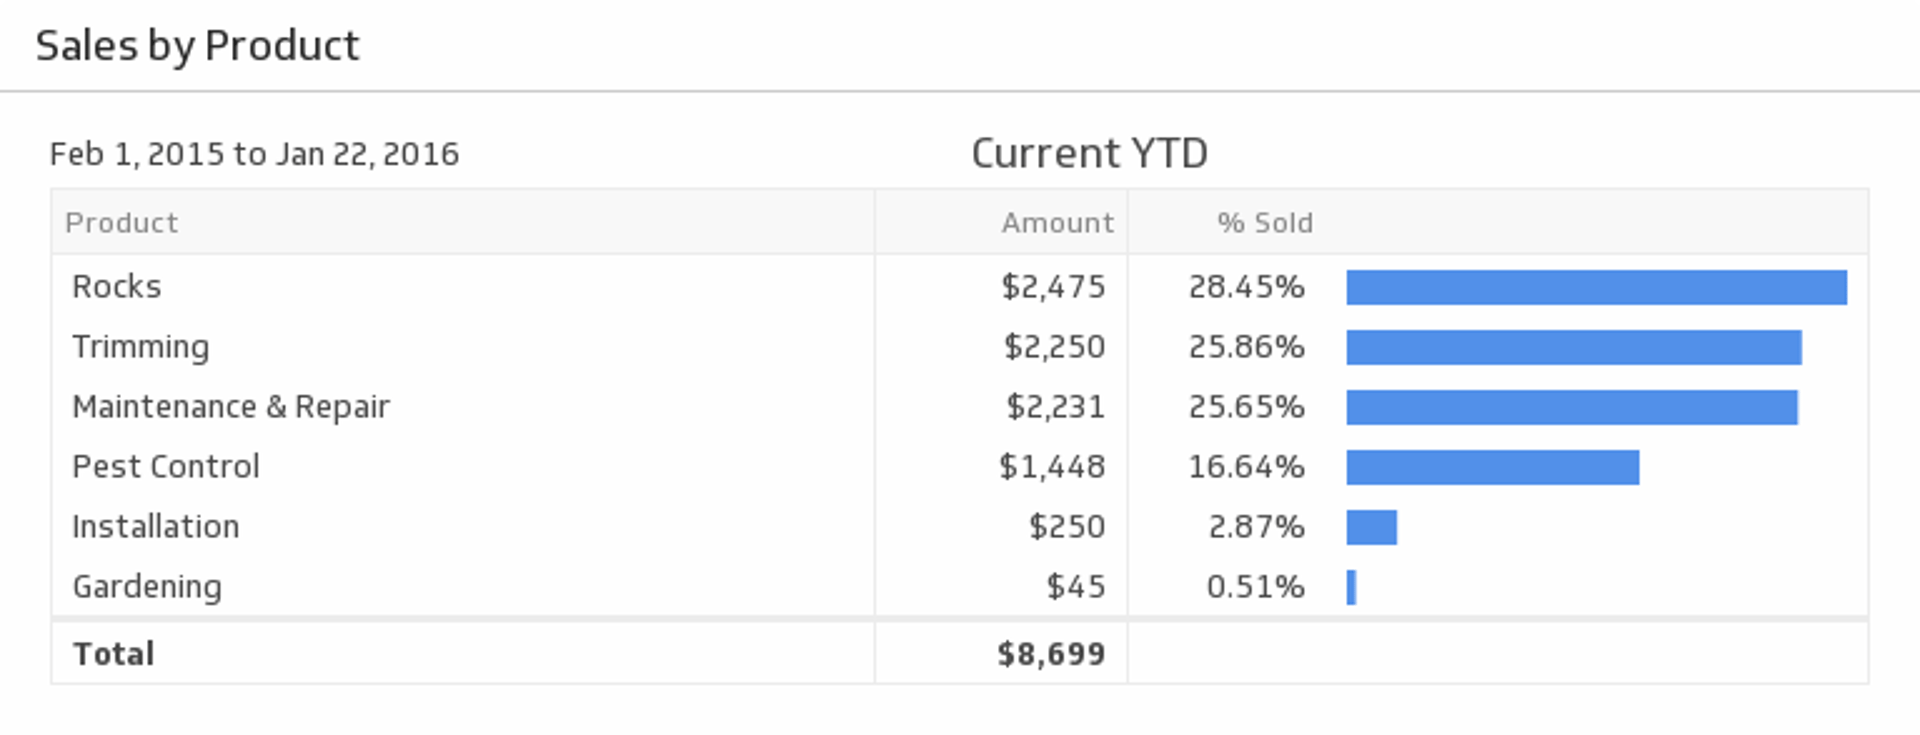
Make sure your products are profitable by monitoring each of their sales metrics. See a ranked list and compare your best-selling products.
Income and Expenses
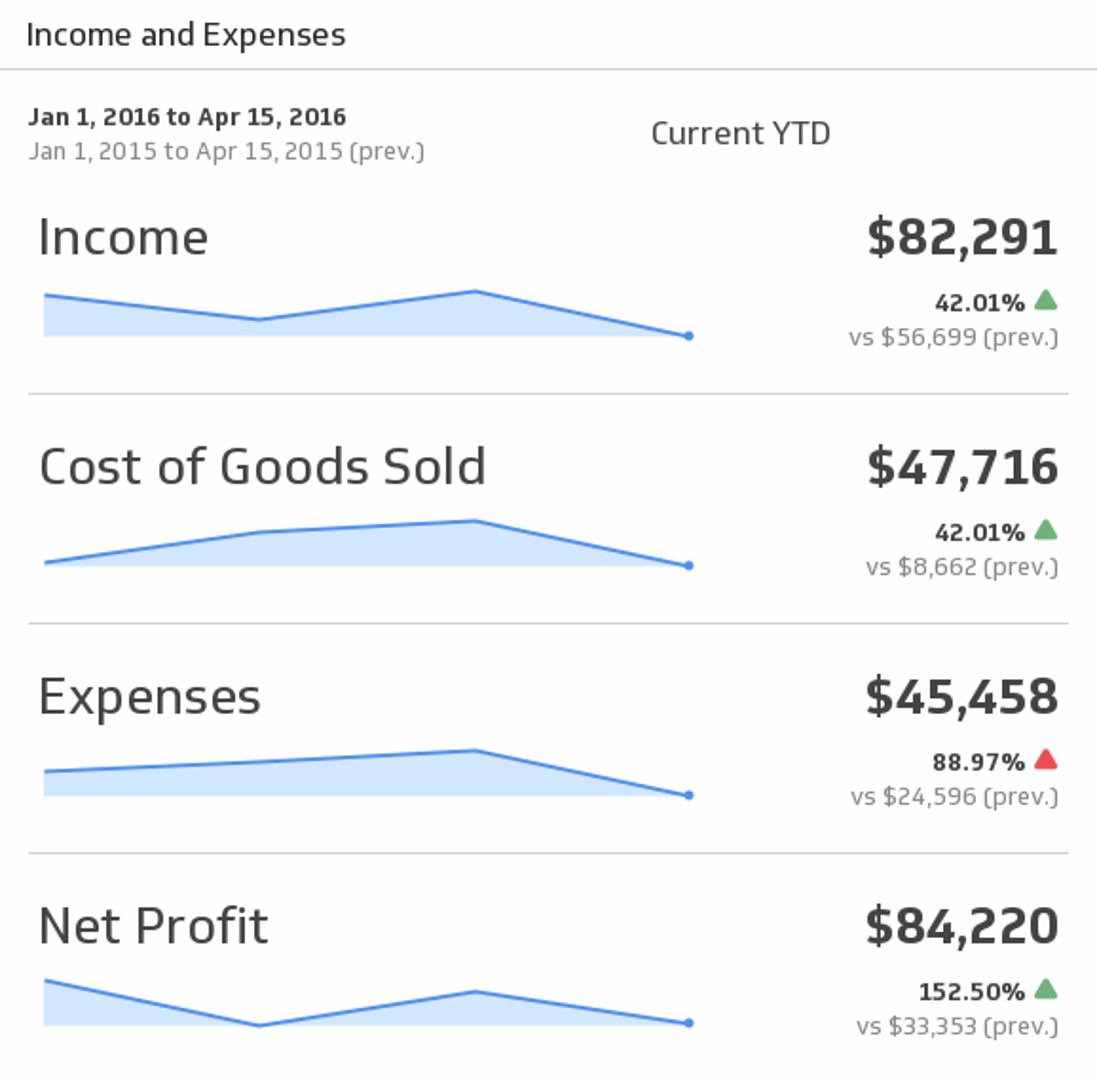
Bring your key accounting puzzle pieces - Income, Expenses, and Profit - together to help you make actionable decisions. Choose the time period of your choice from the drop-down menu, and compare to the previous period.
Revenue
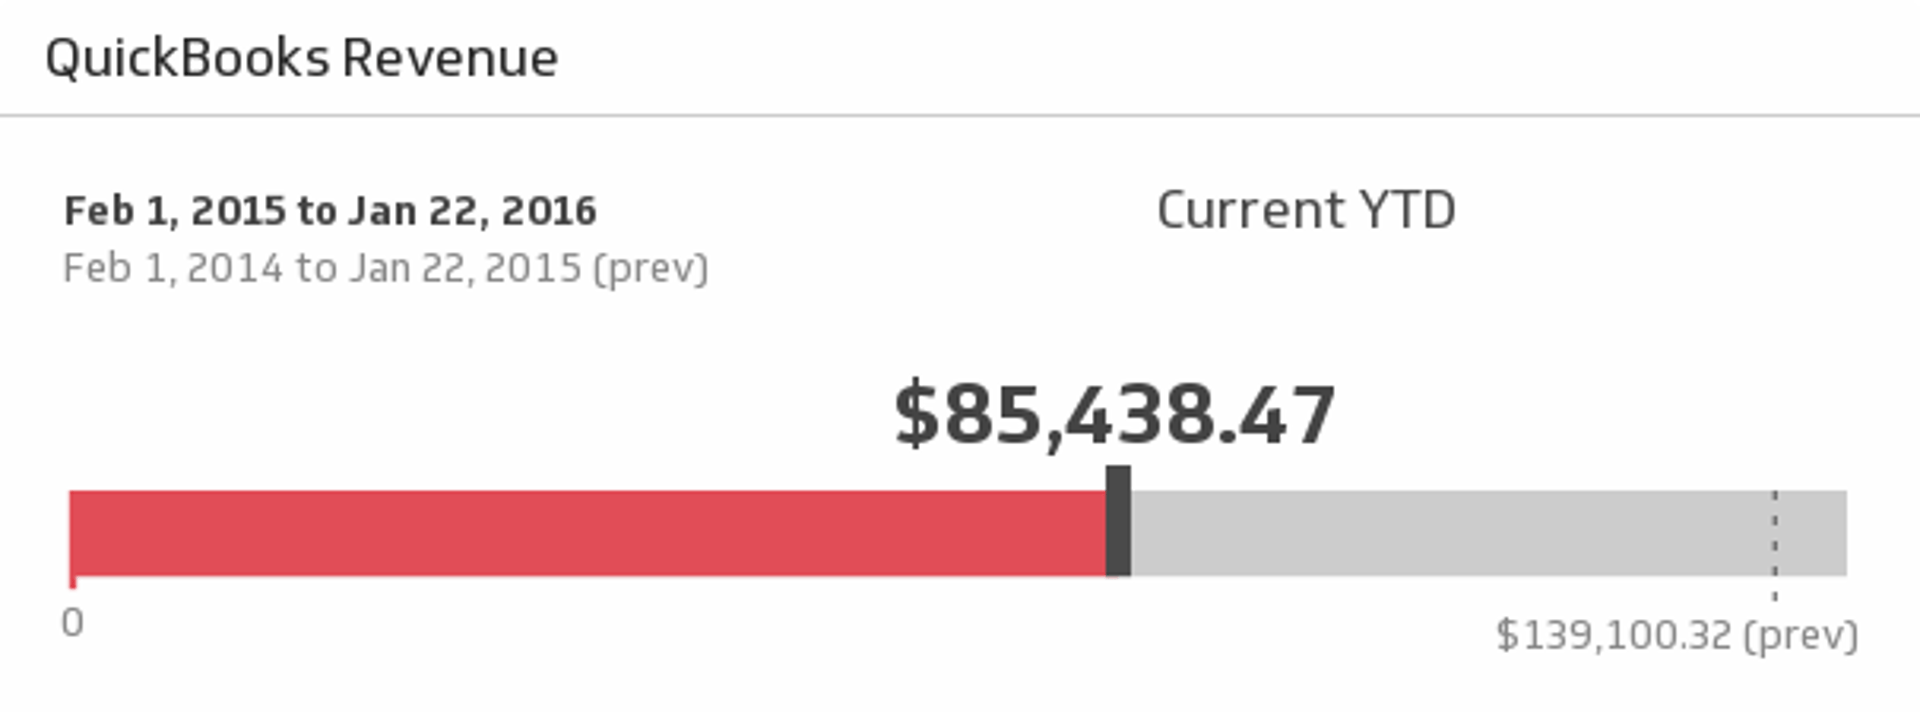
Ensure the financial health of your business is in tip-top shape with this simple, real-time report on revenue for the time period of your choice.
Customer Balance Summary
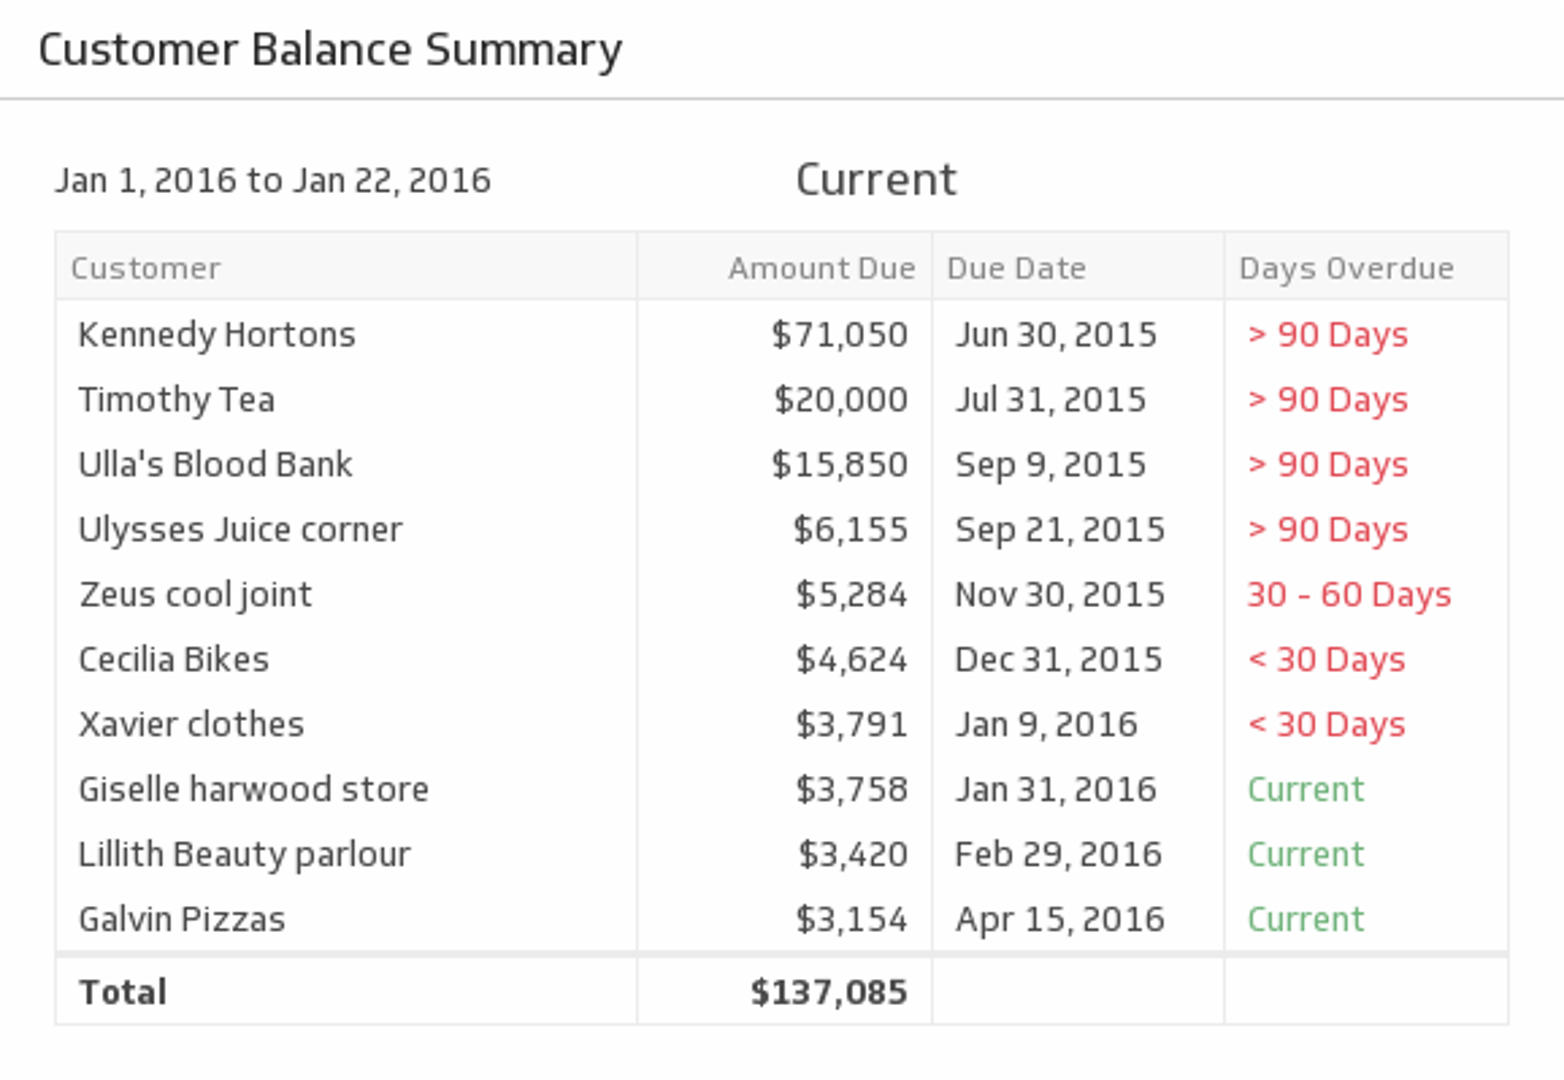
Cash-flow can make or break a venture. Use this simple table to see which customers are current (in green) and which ones are overdue (in red).
Top 10 customers by Income
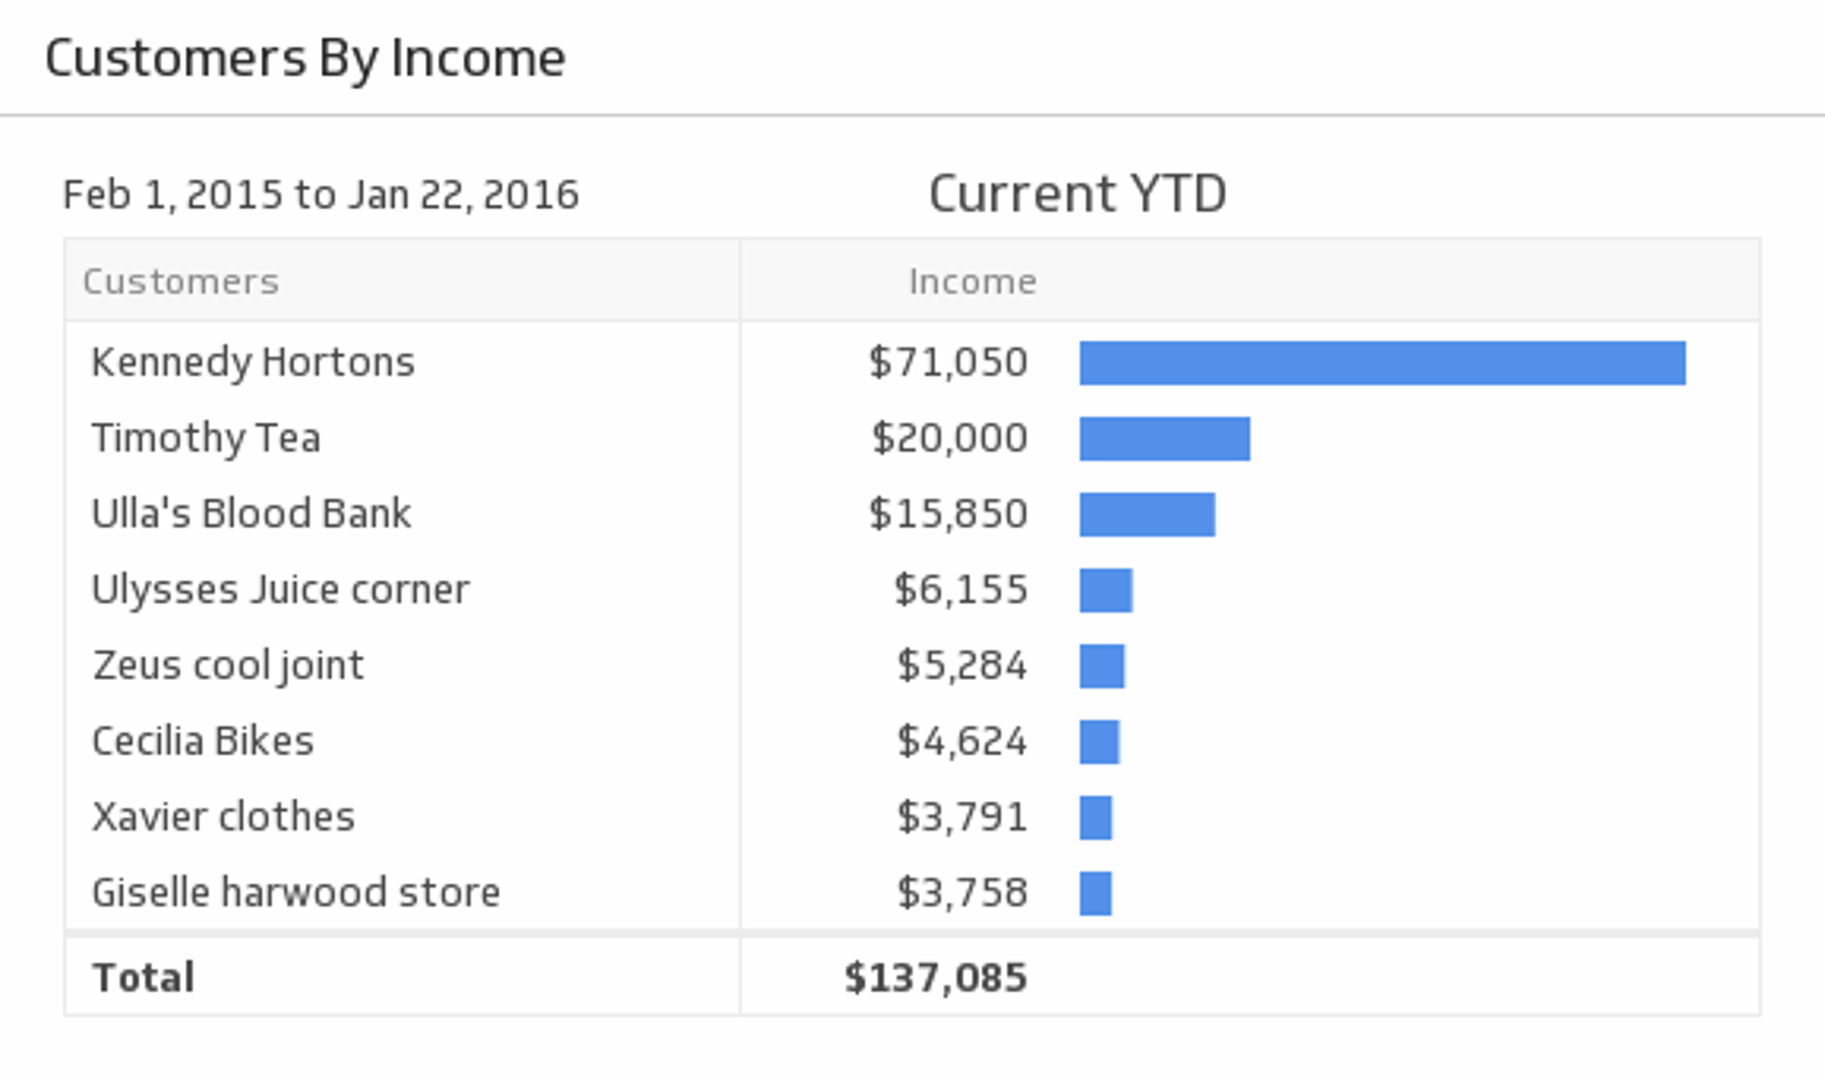
Gain a steady flow of profitable clients by monitoring your top 10 income-earning customers during the time period of your choice.
Vendor Expenses
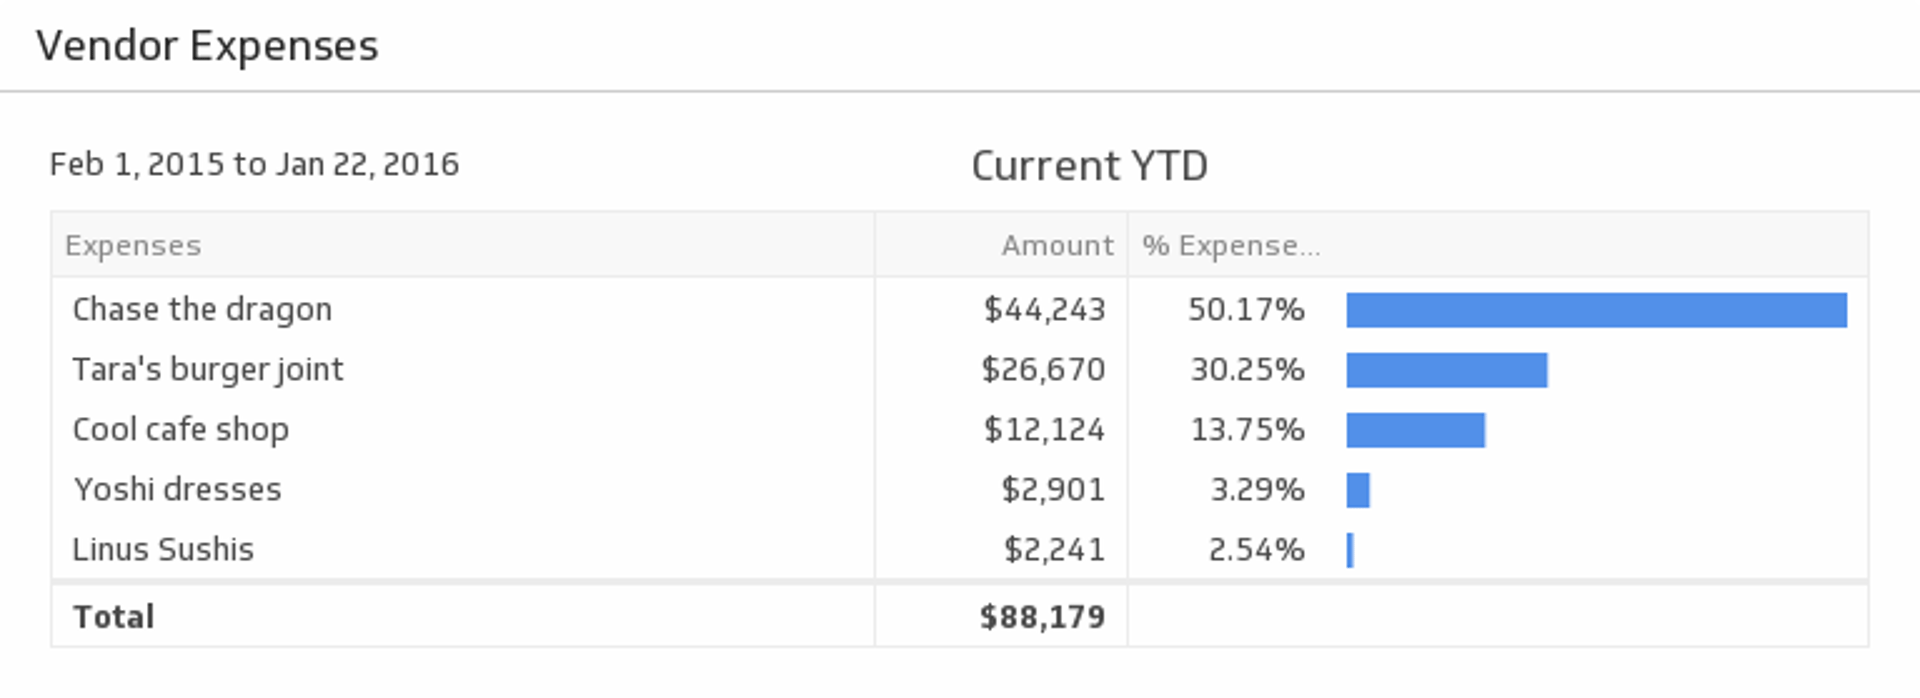
Monitor your vendor expenses on an ongoing basis. Delve into individual vendor expenses and see the sum total.
And that’s not all
Klipfolio integrates with many popular online financial and small business services, including additional QuickBooks visualizations! Check out our Integrations Page for more details.
Related Articles

5 tips to understand (and organize) your restaurant data
By Saleem Khatri — June 9th, 2026
6 dashboards I use daily to run my SaaS company
By Allan Wille, Co-Founder — April 10th, 2026
Business Metrics vs. KPIs: What’s the Difference?
By Jonathan Taylor — March 13th, 2026
