
Summary - Learn everything you need to know about business intelligence (BI) so you can transform the way you approach data-driven decision making.
Working with massive amounts of data can be challenging. If you want to generate actionable insights faster, implementing effective business intelligence strategies is imperative. Through processes like data collection, management, and analysis, business intelligence helps organizations translate their vast collection of data into meaningful insights.
What is business intelligence?
Business intelligence (BI) refers to the set of processes that transform vast amounts of organizational data into workable information. Through data collection, integration, analysis, and visualization, business intelligence gives organizations easy access to all information relevant to their strategic initiatives.
To summarize the processes:
- Data collection extracts data across multiple sources.
- Data integration creates a consistent format for all data and moves it to a unified repository.
- Data analysis examines the data for insights, typically using statistical and computational techniques.
- Data visualization translates datasets into intuitive visual representations, such as tables, charts, graphs, and maps.
Today’s businesses collect their data from a variety of sources, from local operational systems to third-party analytics, to social media services. Because these collections occupy disparate locations, getting a clear view of all business-related data can be difficult. Business intelligence aims to empower faster and smarter data-driven decision-making. It achieves this by making actionable insights readily available and easy to interpret within short timeframes.
The benefits of business intelligence
Business intelligence makes useful data available at the right time. When used correctly, it can help organizations increase operational efficiency, improve competitiveness, and reduce costs,
Efficiency
Without business intelligence, organizations rely on disparate data sources to generate insights. It can be a time-consuming challenge to gather data across multiple silos. Teams must also put in the extra effort to manually pinpoint connections between unintegrated data.
A robust BI framework can remove the tediousness of working with disparate data. Efficient data integration tools merge datasets together in a cohesive format, while data analysis and data visualization tools help generate automated insights. Necessary information is easy to access, empowering faster analysis.
Competitiveness
Business intelligence supports the organization’s objectives by generating usable evidence and insights. With BI insights readily available within reasonable timeframes, organizational leadership can build informed strategies, leveraging data to identify the best ways to maximize operational efficiency. By optimizing workflows, organizations can stay ahead of their competitors.
Cost-effectiveness
Data can help organizations predict outcomes before taking action. It reduces the risk of losing money to uninformed strategies. Historical data also helps organizations predict and prepare for costs before they occur.
The 3 main categories of BI analysis
Type of analytic | Question answered |
Descriptive | What happened? |
Diagnostic | Why did it happen? |
Predictive | What will happen next? |
A core part of business intelligence is using data analysis to generate insights. Analyses fall under three categories: descriptive, diagnostic, and predictive. Understanding the three analysis categories will help you identify what pieces of information you can collect to support your business objectives.
Descriptive
Descriptive analysis is often the first step in examining data. As its name suggests, descriptive analysis uses historical data to describe the organization’s past or current situation.
Common examples of descriptive analysis outputs include monthly business reports, such as sales reports, marketing reports, and financial statements. They help the team assess the health or performance of designated processes, functions, or objectives.
Diagnostic
Diagnostic analysis is the next step after descriptive analytics. The process investigates the relationships between data points in descriptive analysis outputs to pinpoint probable causes of trends, patterns, and anomalies.
Let’s say an eCommerce company sees a sudden spike in sales that is inconsistent with its typical revenue patterns. Through diagnostic analysis, it can identify probable reasons. Perhaps an influencer purchased a product and promoted it on their profile.
Predictive
First, descriptive analysis describes the situation, then diagnostic analysis identifies the cause. The next logical step is to leverage the new understanding of cause-and-effect relationships to estimate the outcome of a chosen course of action. The team might use predictive analysis to see if the trend will continue or determine what will happen after introducing changes in strategy.
The eCommerce company in the above example might use predictive analytics to determine how to maintain the uptick in sales. It might borrow data from other influencers to assess the effect of partnerships on attracting new customers.
The business intelligence framework
The goal of business intelligence is to collect, organize, analyze, and report data. If you need help getting started, here’s a step-by-step guide on what to do.
- The organization defines its objectives. It outlines the core problems in its business processes and describes the data needed to ideate solutions.
- The organization collects data from all relevant sources, such as market research, social media analytics, sales reports, and financial statements.
- Data teams create a cohesive view of business information by integrating data from disparate sources into a unified format.
- Leverage AI, computational queries, or other algorithms to analyze data for patterns, trends, and anomalies.
- The team visualizes data into charts, graphs, or dashboards to make the information easy to communicate and digest.
- The organization uses the data to build evidence-based strategies.
Goal-setting
Before any BI processes can occur, the organization must define its objectives. Having a specific goal gives the team a clear picture of what data it needs to collect and how to present it.
Objectives need to be specific and measurable. When objectives are measurable, it is easier to break them down into smaller metrics, which reveal what descriptive analysis data the team should collect.
The best way to identify the necessary information is to break the objective down into questions that descriptive analysis can answer. For example, let’s say an eCommerce company wants to increase its ROI from digital marketing campaigns. The company can determine how to achieve its goals by asking the following questions:
- What does ROI look like now?
- What activities generate expenses?
- What activities generate revenue?
- What marketing efforts are bringing the biggest contributions to the current revenue?
- Which metrics show the performance of current marketing campaigns?
ROI in marketing comes from successfully converting leads into customers. Therefore, the team should look into the marketing efforts that helped attract leads. It might gather all data related to lead generation, such as:
- Organic traffic per platform
- Top social media platforms
- Sessions and page views per day
- Leads per platform
- Leads per region
Data collection
After the organization sets its objectives, it outlines the sources of information that can provide valuable insights. This can include databases, spreadsheets, APIs, legacy systems, web analytics, social media analytics, surveys, third-party data services, and publicly available research.
In the example above, the company must now identify where to source its data. Information related to sales, leads, traffic, page views, and other related elements might come from the following sources:
- Sales reports
- Social media analytics
- Web analytics
- Email marketing data
Data integration
Data engineers, architects, or developers then move all collected data into a unified repository, such as a data warehouse, data lake, or data lakehouse. They use one of multiple approaches to integrate data. We’ve listed the most common methods below.
ETL
The extract, transform, and load (ETL) pipeline executes data integration through the following steps:
- Extract: The team moves all collected data into a temporary staging area.
- Transform: It then transforms the data into a format that aligns with the organization’s target objective. This process involves removing duplicates and inaccuracies, correcting inconsistencies in currencies and units of measurement, and formatting data points into tables that match the target repository.
- Load: The team loads all transformed data into the target repository.
The ETL pipeline ensures that all data is ready to use immediately after consolidation. However, the process requires significant upfront planning. The team must first plan out the rules for the transformation stage before integration can occur.
ELT
ELT stands for extract, load, and transform. It follows the same steps as the ETL pipeline but in a different order. It skips the staging area and moves raw data collections directly into the target repository, transforming only when necessary. Organizations use the ELT pipeline when they need to move vast amounts of data within a short timeframe.
SDI
Streaming data integration (SDI) extracts, transforms, and loads data into a target repository continuously in real-time. This method is suitable for organizations who need real-time access to data.
Data virtualization
Data virtualization uses a virtual layer to provide a unified view of disparate data collections. Instead of moving or replicating data, it generates virtual representations of the organization’s physical data sources. The process consists of the following steps:
- The team connects the data virtualization tool to relevant data sources.
- The tool generates a virtual model based on the source data.
- The virtual model presents the data in a simple and cohesive format.
With data virtualization, the original data sources remain unchanged. This method is suitable for organizations that need cost-effective access to real-time data.
Data analysis
Once the team compiles the data into an acceptable format, it must extract insights. In this process, known as data analysis, data teams run queries to uncover meaningful patterns, trends, and relationships in data.
One of the most common data analysis processes is data mining. This technique uses statistical and computational techniques that filter, sort, or categorize the contents of datasets to uncover useful information, such as predictions or descriptions.
Examples of data mining techniques include:
- Association: Statistical models examine how often two or more variables in a dataset appear together. Marketers often use this technique in market basket analysis, which analyzes which items customers often buy together.
- Classification: This technique groups data points into predefined categories or classes based on their features or attributes. Spam filters use this technique to identify and block spam.
- Clustering: Similar to classification, clustering groups data points together based on similarities. However, unlike classification, clustering requires no predefined categories. Instead, it will scan for similarities and differences between data points and create groups based on the information it learns. Marketers use clustering to create groups of customers based on their buying behavior.
- Predictive analytics: This technique uses machine-learning algorithms to generate predictions based on historical data. Accountants often use predictive analytics to forecast cash flow.
Data visualization
However, teams should not limit their insights to machine-generated output alone. They can use data visualization technology to simplify the presentation of data and generate insights faster.
Data visualization tools use visual formats, such as tables, charts, graphs, and maps, to make large datasets easy to understand. These representations can communicate the broader data story to users with minimal technical knowledge, helping them intuitively understand the trends, patterns, and relationships found within data.
Examples of data visualizations include:
- Line or area graphs
- Bar graphs
- Pie graphs
- Heat maps
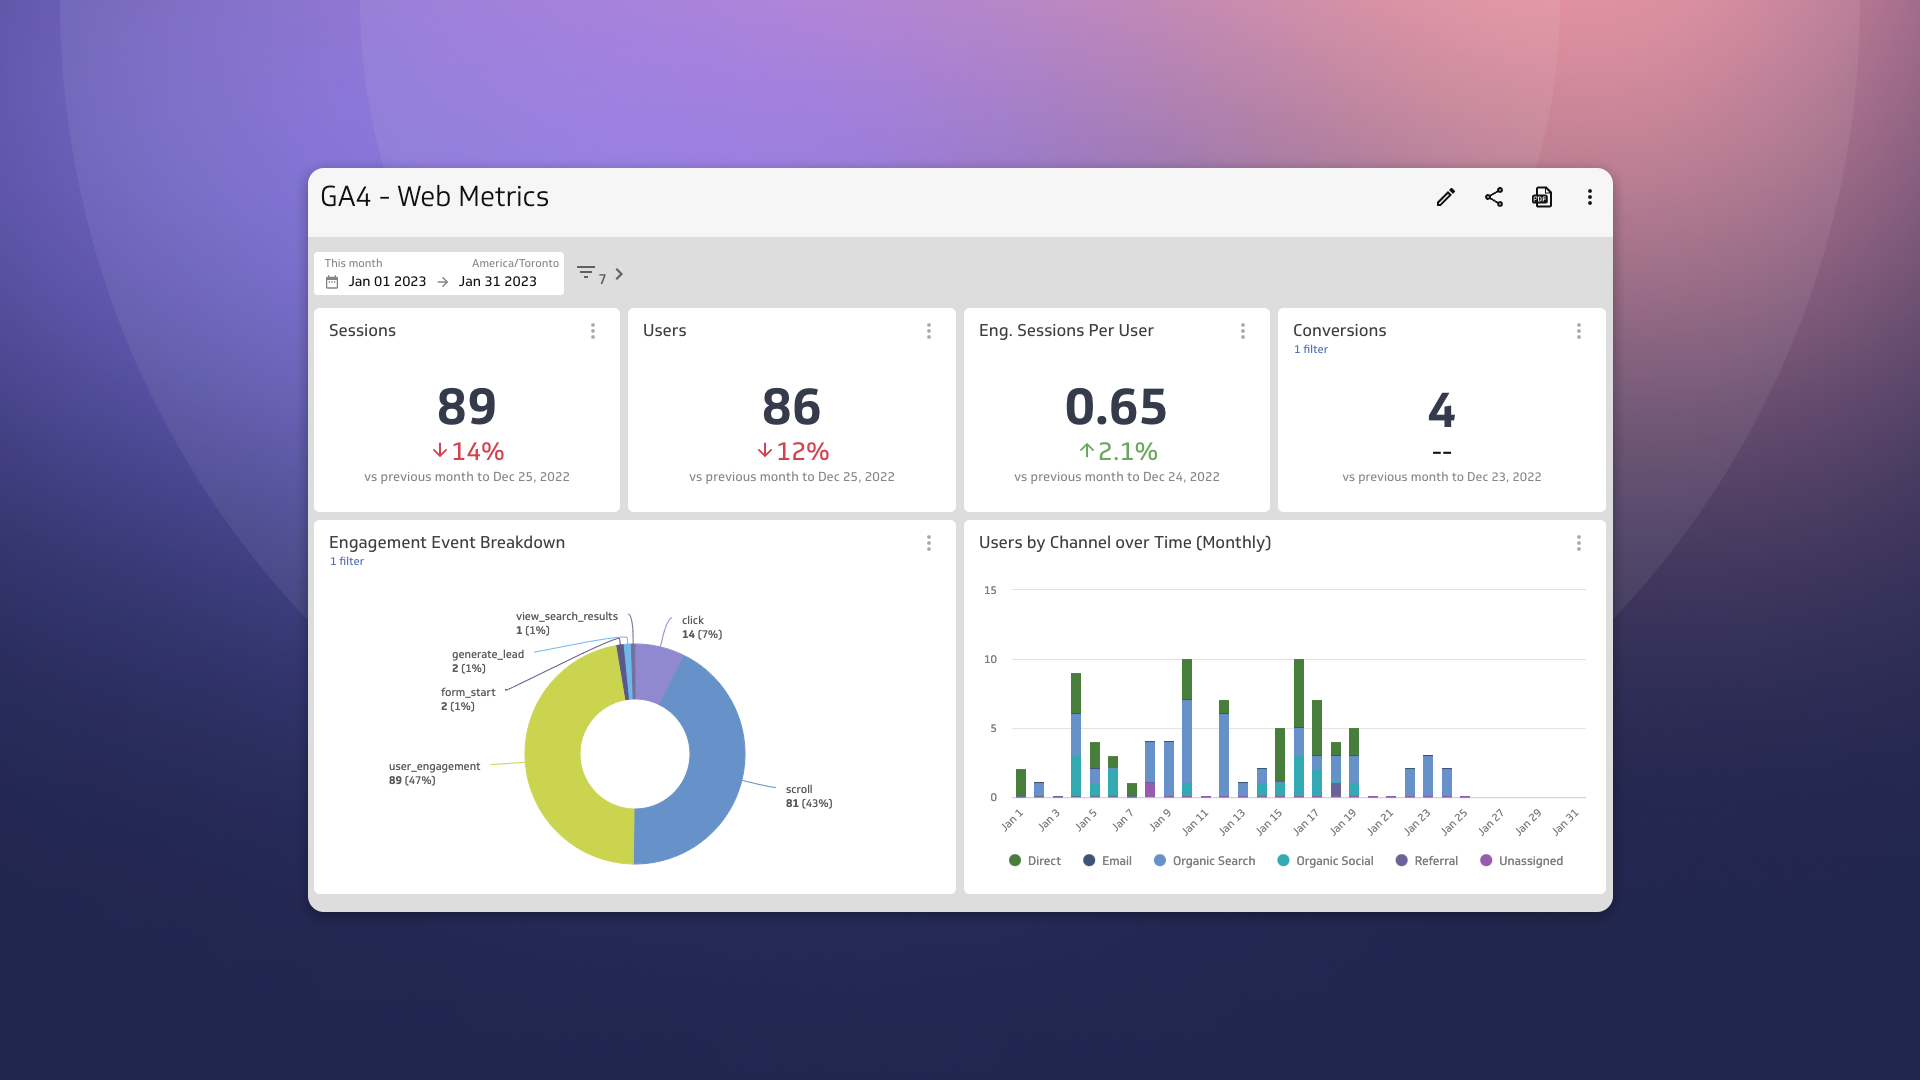
The best way to maximize data visualization is to build dashboards, which are customizable and interactive interfaces that display related groups of data. Dashboards consist of panels, each containing its own data visualization. They give the team a top-level view of all data related to a specific objective.
A company that wants to increase ROI would create a dashboard to organize data visualizations of all relevant digital marketing performance targets. This includes the data it outlined in its objectives: leads per region, leads by program, daily pageviews, organic traffic per source, and daily sessions and pageviews.
Data visualization should use the format that makes the most logical sense for the dataset’s purpose. For example, the leads per region panel uses a geographical heat map to help the user visualize where their leads come from.
Meanwhile, the leads per program panel use a bar graph to compare the performance of discrete categories. Aligning the data visualization with the dataset’s purpose helps viewers intuitively understand the implications of the data.
Data-driven strategy planning
Once the team generates its insights, it must build its strategies. It can create specific tasks for its initial objective by asking questions related to the three data analysis categories.
- Descriptive: Where is the team in relation to its goal? What variables contribute to its current performance?
- Diagnostic: Why do these variables have a particular effect on current performance?
- Predictive: What will happen when the team modifies these variables?
In the example, the team’s objective was to increase monthly ROI. First, it gathers descriptive analytics, which shows the current performance of its digital marketing campaigns. Notable insights include:
- The majority of leads come from the United States and Canada
- Blogs attract the most leads
- Most web traffic comes from paid search
Next, the team must use diagnostic analytics to assess how the descriptive analytics results came to be. If no automated data analysis processes are available, they can make hypotheses based on available data. For example:
- It is possible that the digital marketing campaign performs better in the United States and Canada because paid search campaigns target North America specifically. The paid search ads promote the website’s blog posts, which explains why blogs are the highest-performing category in leads per program.
- On a deeper level, the team should analyze whether the marketing copy resonates with North American audiences. It can also look into its blog posts to determine if more personalization is necessary.
Next, the team should use its previous findings to determine an approach going forward. Again, if no predictive models are available, the team should generate strategies itself. Here’s an example of that:
- Understanding that digital marketing content performs best in North America, the team plans to make their personalization strategies more aggressive. It identifies the regions within North America and Canada that produce the most leads, then customizes its marketing copy according to the values and interests of that demographic.
Once the business starts its new initiative, it can repeat the process to gather more data. It uses descriptive analytics to assess the results of new strategies and confirm the hypotheses produced in diagnostic and predictive analytics. Through iterations, the business generates more data, increasing the accuracy of its predictions.
Examples of BI applications in real-world industries
Companies use BI tools to maximize efficiency across core business processes. Below are a few applications of BI technology in real-world industries.
Sales and Retail
Upper Canada Truck Sales is a retail company specializing in the secondhand sale of late model, high-end, premium quality transport trucks. In its early stages, it had no solid system for monitoring data, which slowed down their ability to generate important reports, analyze performance, and ideate informed strategies. Without data visibility, the company struggled to address major operational issues on time, which resulted in significant financial losses.
BI solutions helped Upper Truck Canada Sales track the most important business metrics, including inventory, sales rep performance, profit and loss by truck and by location, and sales trends. Dashboards gave them more visibility on how their products moved, what they were spending, and which products buyers liked best. Access to historical trends helped them increase workflow efficiency and make informed buying decisions.
Accounting
The Summit CPA accounting firm provides standard accounting services, such as cash flow management, tax planning, and forecasting. It leverages BI technology to generate financial reports and insights faster. Before implementing BI processes, the team relied on spreadsheets to collect and communicate data, which limited their capacity to streamline reports and deliver information in real-time.
BI technology helped them quickly connect to their clients’ financial databases and software tools, process datasets, and generate up-to-date reports. Using real-time dashboards, they provide visibility to each client’s cash position, performance, and overall profitability. Clients can also use Summit CPA’s dashboards to evaluate their data against industry benchmarks.
Customer Service
The chat support company Equinox uses BI technology to give employees and clients real-time access to performance metrics, such as chats handled, average speed of answer, service level agreement, and customer satisfaction score. It uses Klipfolio’s dashboard tools to display daily, weekly, monthly, and quarterly team performance stats on workspace TV screens.
Making performance metrics available in real time optimizes workflow efficiency. Employees gain a clear picture of where the team is in relation to its goals and how to progress. Equinox also uses BI tools to deliver progress reports to clients, increasing transparency and trust.
Conclusion
Business intelligence is a highly valuable tool in any organization’s arsenal. By building a robust data intelligence infrastructure, companies receive easy access to usable information, gaining the power to make faster and smarter decisions.
Leverage business intelligence with Klips. Our customizable data visualization dashboards provide real-time access to all data relevant to your business functions, including finance, marketing, sales, and support. With a wide range of connectors and intuitive visualizations, Klips makes business intelligence easy.
FAQs
What is the difference between business intelligence and data analysis?
Business intelligence is an umbrella term that encompasses all processes related to transforming organizational data for actionable insights. Aside from goal-setting and strategic decision-making, business intelligence also includes data collection, integration, analysis, and visualization.
Data analysis is a process within business intelligence that scans datasets for trends, patterns, and relationships. It typically uses statistical and computational techniques to extract insights automatically.
However, data analysis can also refer to the general practice of examining data for insights. It can also be used outside business, such as climate science, healthcare, genomics, and astronomy.
What is the difference between business intelligence and data science?
Data science is a multidisciplinary area encompassing mathematics, statistics, computer science, and software engineering. It focuses on ideating and programming statistical models, algorithms, frameworks, and other techniques that automate data-related work, such as data integration, data mining, and data visualization.
In short, data science is about building and refining the tools used in business intelligence and data analysis.
What is the difference between data visualization and data modeling?
In business intelligence, data visualization refers to the practice of representing datasets using visual formats like tables, maps, charts, and graphs. Data visualization helps non-technical users intuitively understand the broader data story and its implications. It makes trends, patterns, and anomalies visible at a glance.
Meanwhile, data modeling creates visual representations of an entire data system. Rather than visualizing the relationships between unique data points, it instead illustrates the relationships between the types of data and datasets within a system. It also shows attributes, conditions, and constraints per type of data. Data models typically use flowcharts.
For example, a database for an eCommerce website might collect data for customers, orders, and items. A data model will show how these data types interact: customers place orders, which contain items. Meanwhile, data visualization will visualize actual data collected, such as the total number of customers or orders per month.
Related Articles
Promoting data literacy with metrichq.org and the power of AI
By Allan Wille, Co-Founder — October 12th, 2023
Secure and accessible dashboards for your extended team
By David Mennie — April 25th, 2023
Unlock Data-Driven Decisions with ChatGPT & MetricHQ
By Nicolas Venne — April 3rd, 2023