
Summary - Learn how to integrate Vega, a D3-based visualization grammar, into Klipfolio's HTML Template to build fully custom, data-driven Klips. A step-by-step guide for power users comfortable with JavaScript and HTML.
Klipfolio is designed with power users in mind. Its HTML Template feature gives visualization experts a way to go beyond built-in chart types and build fully custom Klips using JavaScript libraries. This post walks through how to integrate Vega into Klipfolio's HTML template to create a custom, data-driven visualization.
This guide targets power users who are comfortable with JavaScript and HTML, and who are already familiar with Klipfolio.
What is Vega?
Vega is a visualization grammar: a declarative, JSON-based format for creating, saving, and sharing interactive visualization designs. It is built on D3 and was named by Fast Company as one of the five best libraries for building data visualizations. You can read more about Vega on their web site.
Why combine Vega with Klipfolio?
Klipfolio's HTML Template lets power users build custom Klips with JavaScript on top of a robust data platform. Pairing a visualization library like Vega with the HTML Template means you can focus on the visualization itself — Klipfolio handles data retrieval from your cloud sources.
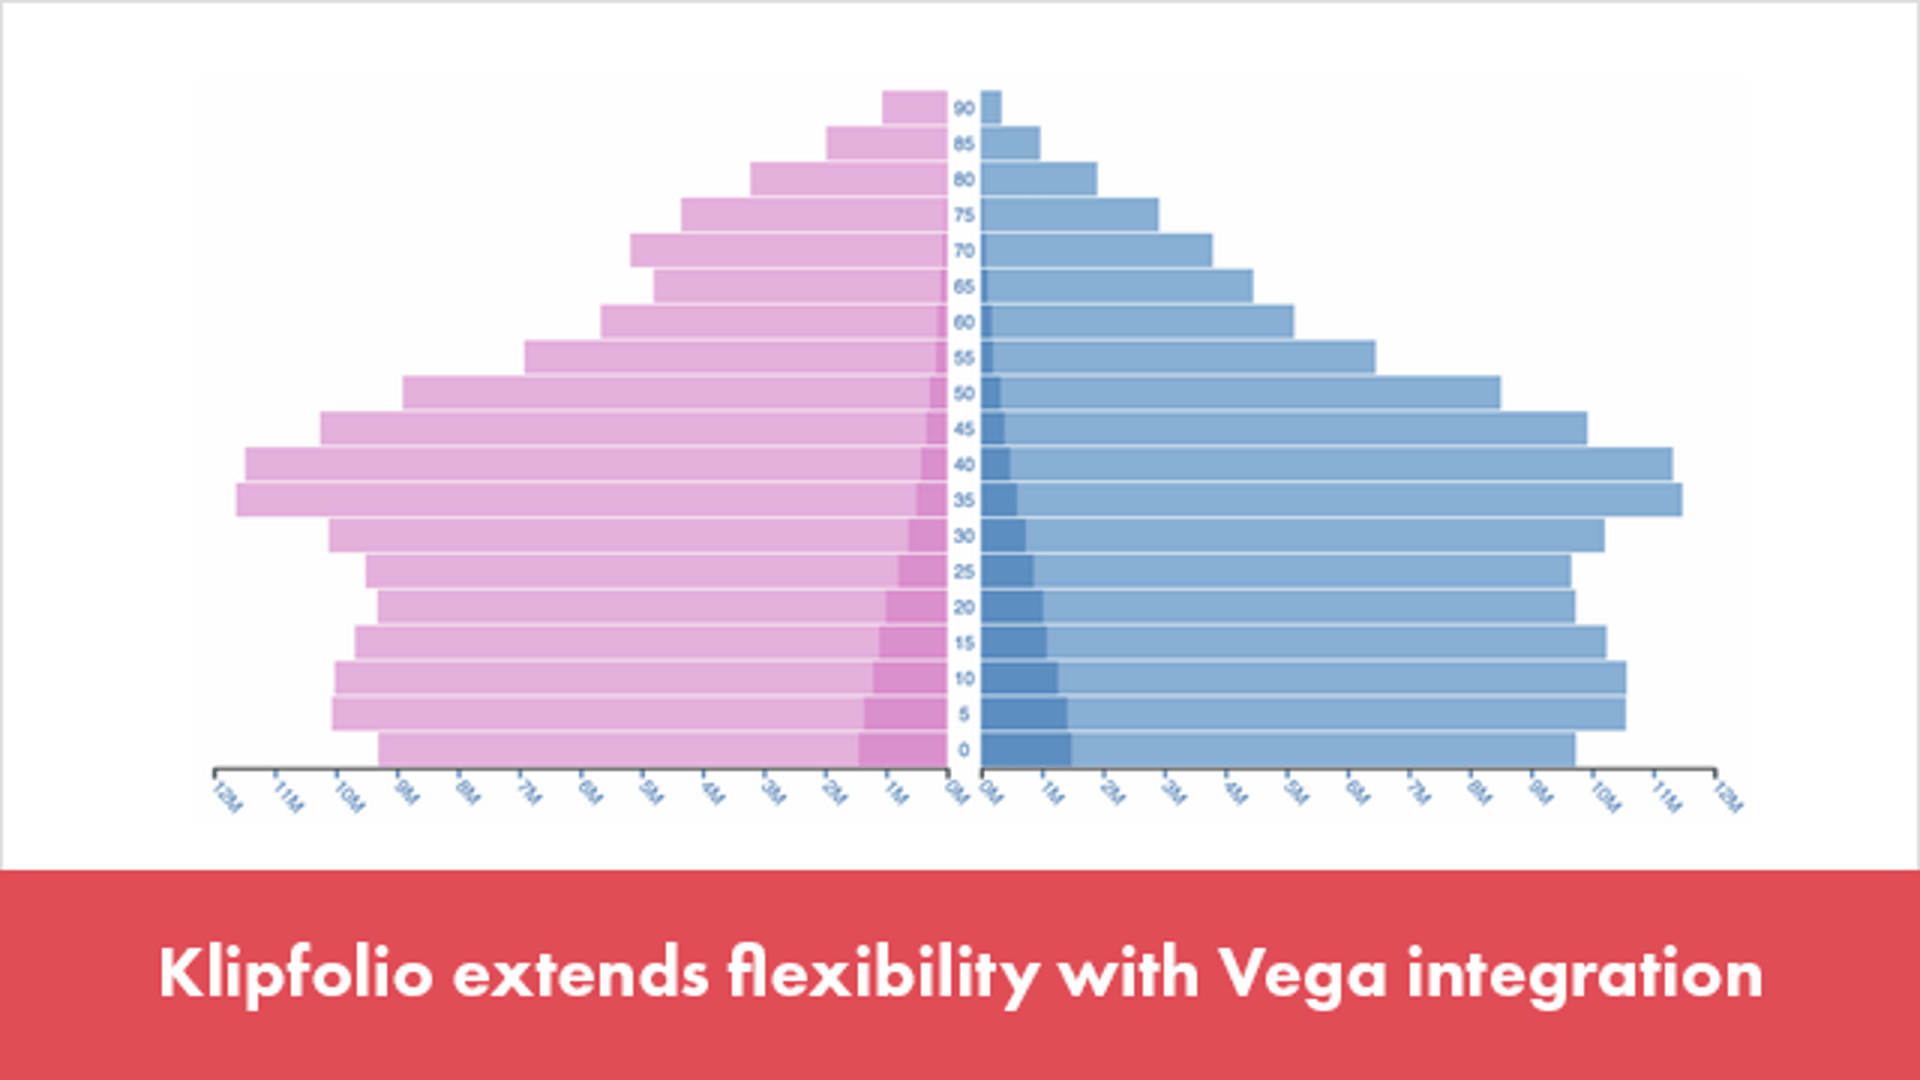
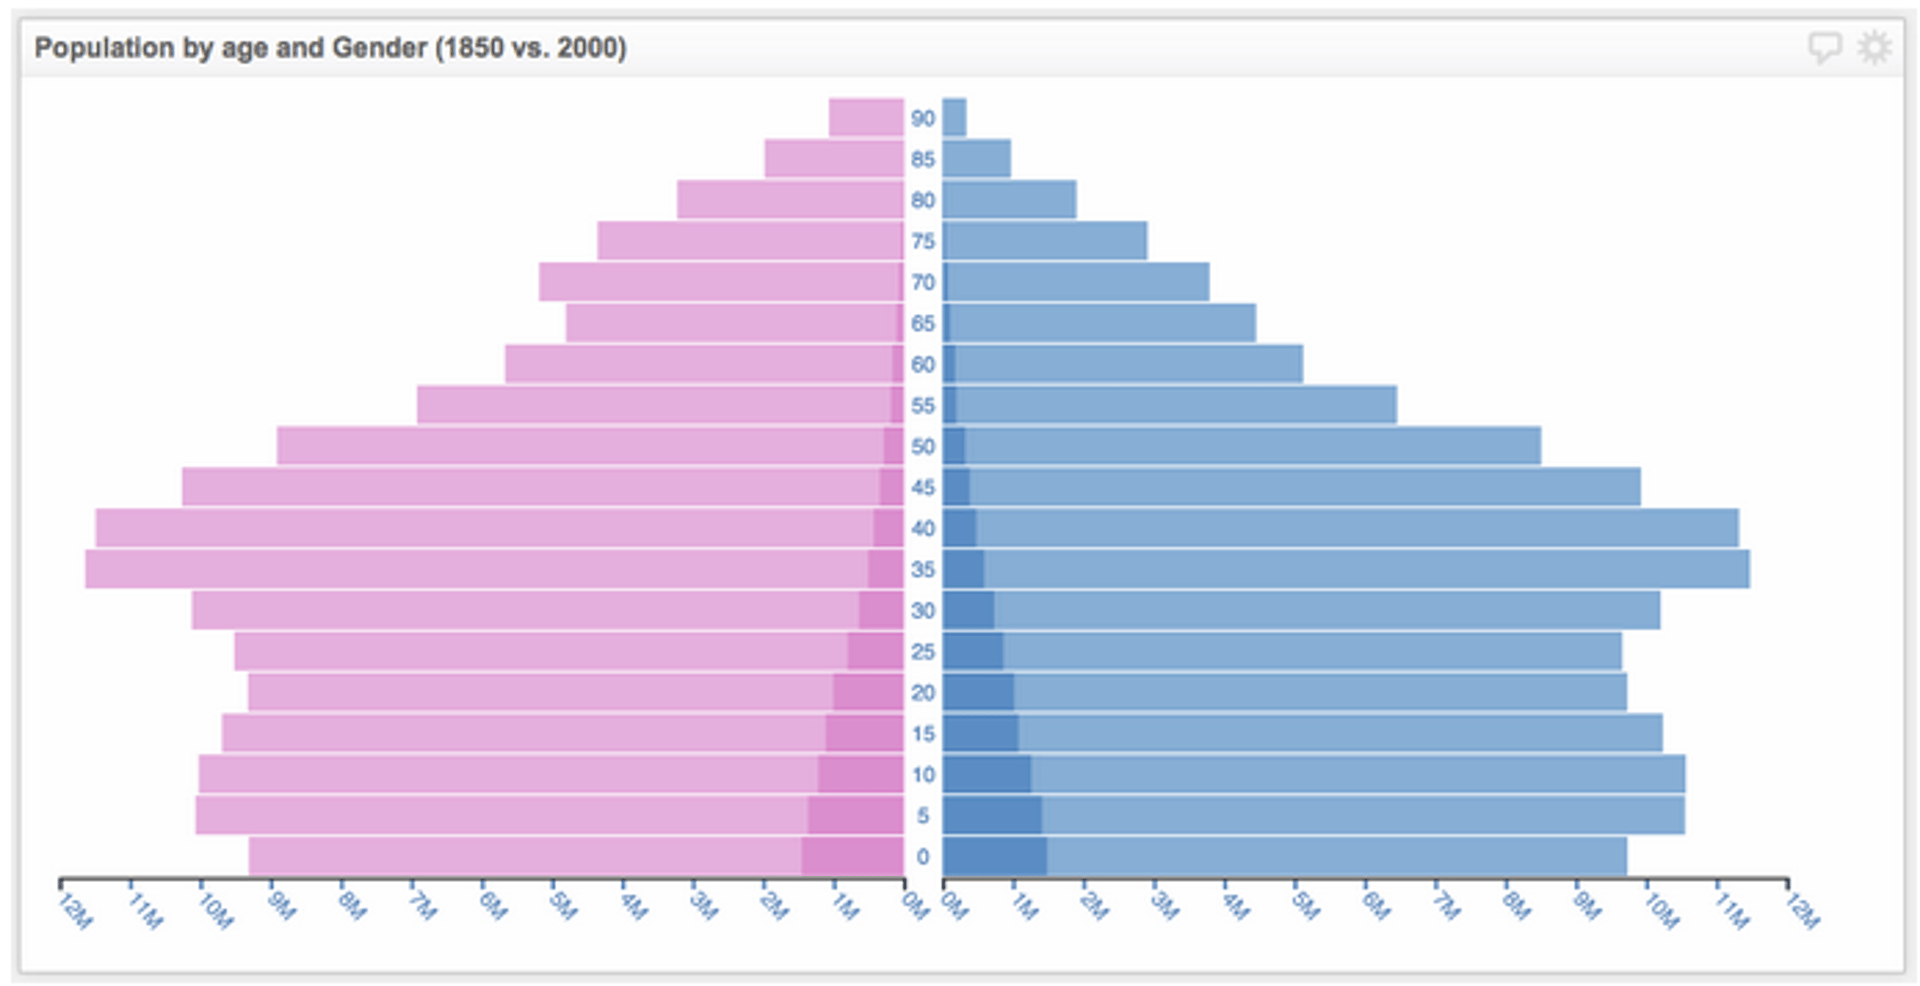
By the end of this walkthrough, you will be able to build the following Klip and add it to your dashboard:
Step 1: Create a data source
In this example, we use the population data source from the Vega editor. To create the data source in Klipfolio, go to the Data Sources tab under Library and click Create a New Data Source. Select Web Accessible Resource as the data source type and point to the following sample data URL:
http://trifacta.github.io/vega/data/population.json
Tip: To learn more about web accessible resources, see this knowledge base article.
Step 2: Build a new Klip
To create a new HTML Template Klip, click Build a New Klip under the Klips tab in the Library. Choose HTML template, then select an existing data source and pick the one you just created.
Step 3: Create the data series
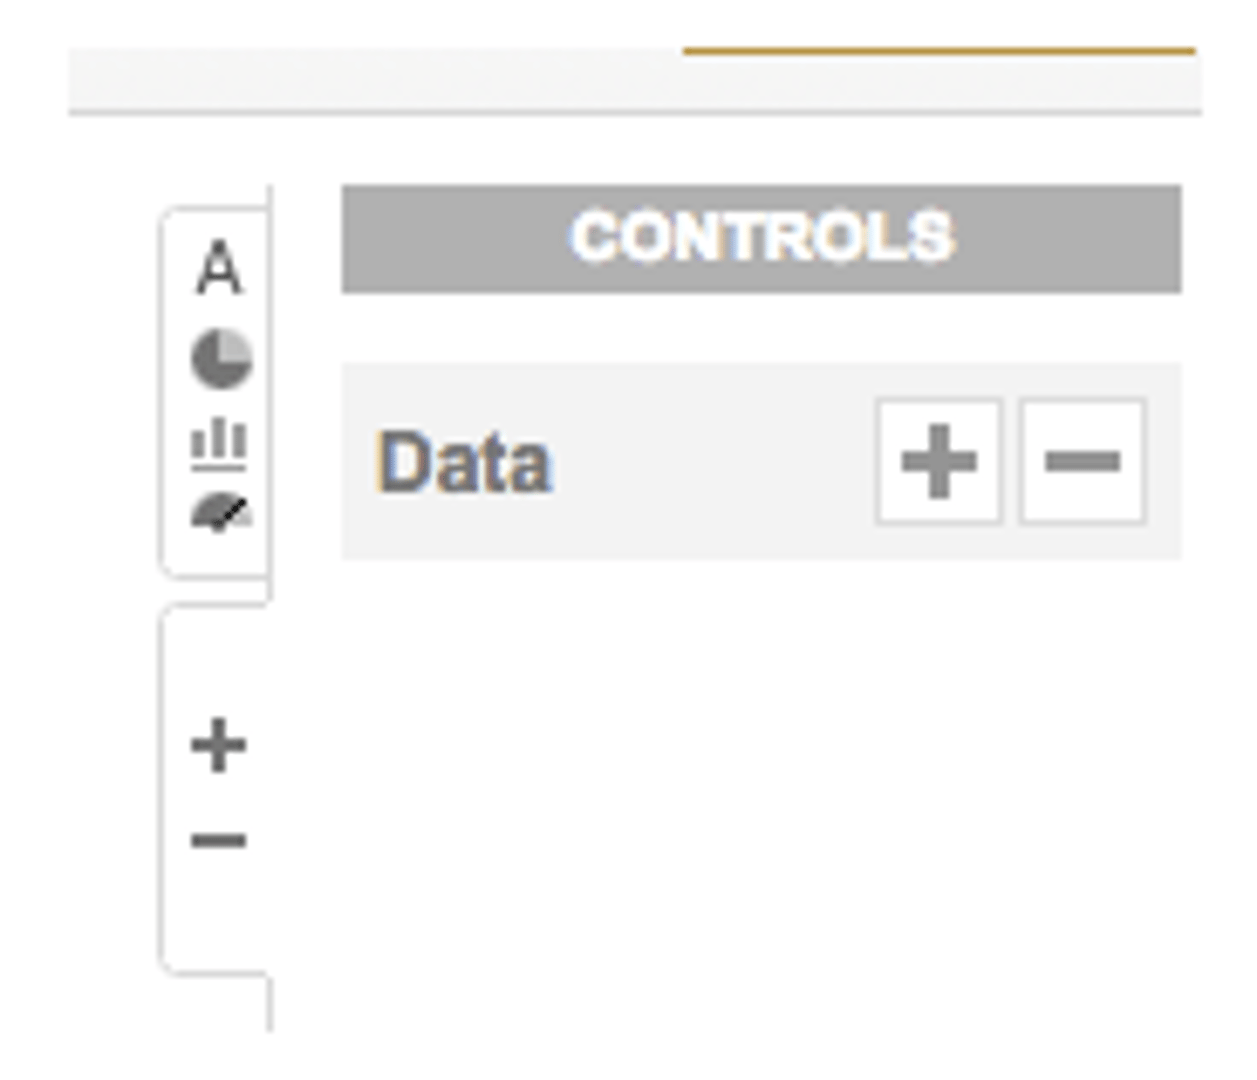
The data source is a JSON file with four fields: year, age, sex, and people. You need to create a data series for each field. The HTML Template includes one data series by default. To add more, click the + icon in the controls panel on the right side of the page.
After creating all four data series:
Select the first data series.
Go to the data panel at the bottom of the page.
Expand the JSON object hierarchy until you reach the first object in the array, then assign the first field in the data source to the selected data series by clicking on the field (e.g. year).
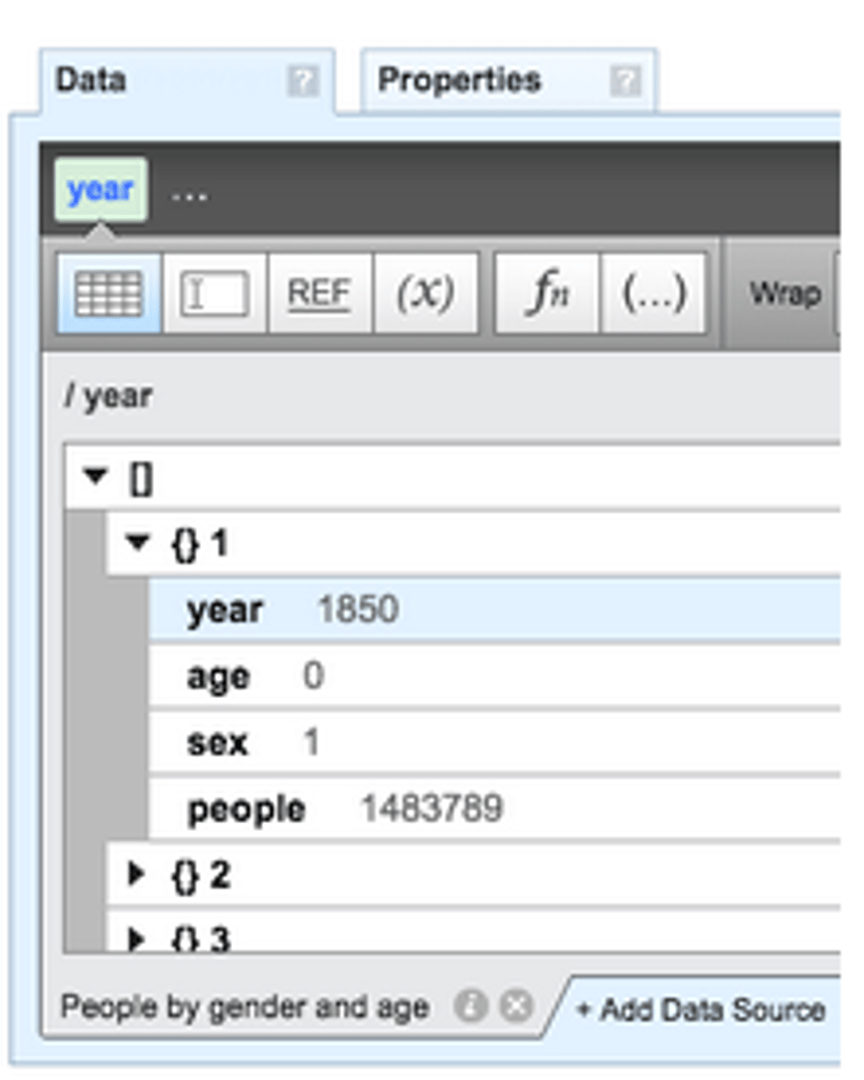
Switch to the properties pane and change the data series Data ID to match the field name in the data source (e.g. year).
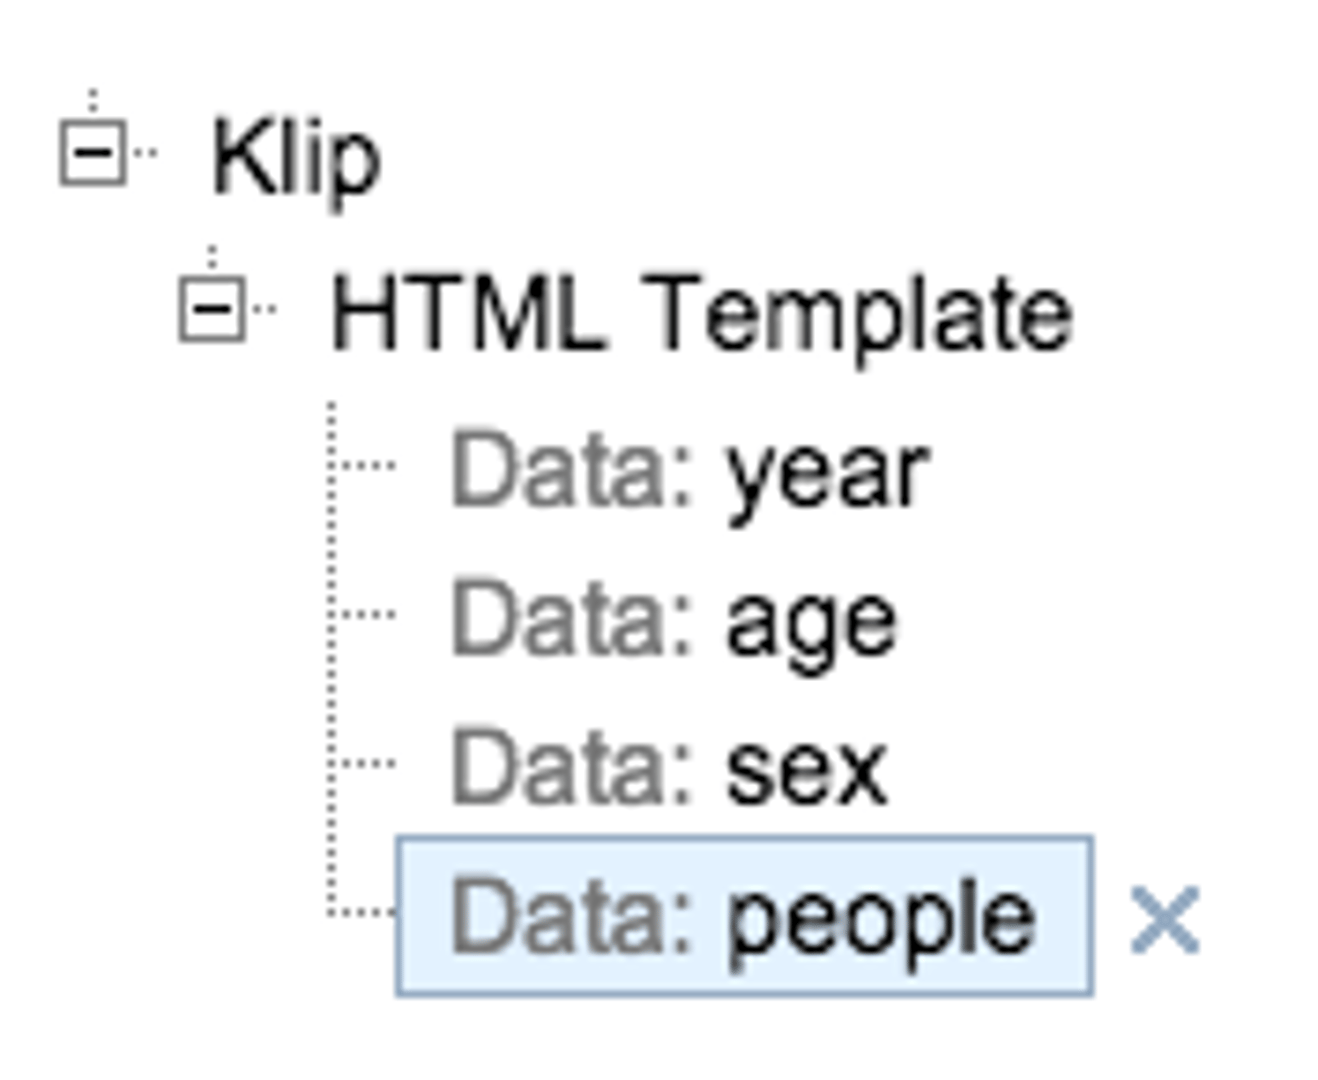
Repeat for all fields and data series. When finished, you should see the following in the Klip editor component tree.
Step 4: Add JavaScript and HTML scaffolding
In this step, insert the JavaScript required to load the libraries: D3, topojson (used by Vega), and Vega. Copy and paste the following code into the Script section of the HTML Template. To expose the Script section, click on HTML Template in the component tree, then click Use JavaScript with this HTML Template in the properties pane.
Note: If you are already familiar with the HTML Template and want to skip straight to the final code, jump to Step 6.
//Define the path configurations to the JS modules that you want to load //In this example we are loading D3, topojson (used by Vega) and Vega //Note: URLs have to be HTTPS due to browser security restrictions var vizmodules = { d3:'https://cdnjs.cloudflare.com/ajax/libs/d3/3.5.5/d3.min.js?noext', topojson:'https://cdnjs.cloudflare.com/ajax/libs/topojson/1.6.19/topojson.min.js?noext', vega:'https://cdnjs.cloudflare.com/ajax/libs/vega/1.5.0/vega.min.js?noext' };
//Pass in the configurations to requirejs
requirejs.config({
paths: vizmodules
});//Create a reference to the component
var _component = this;
//Create a reference to the data model
var _dataModel = this.dataModel;//Load the libraries
require([vizmodules.vega],
function(vg) {
//Your custom Klip code goes here.
console.log(_dataModel);
console.log(d3);
console.log(vg);
});
Tip 1: Use this approach to load other JavaScript libraries and build your own custom Klips.
Tip 2: Changes to the HTML Template property in the properties pane re-render the Klip. Add and remove a space to force a re-render during debugging.
When the Klip renders, you should see the data, Vega, and D3 objects in the browser console (e.g. Chrome DevTools). This confirms you have access to both the data and the visualization libraries.
You also need to add the following to the HTML section of your HTML Template Klip to give Vega a target element to render into:
<div id="vis"></div>
Tip: If you have more than one custom visualization on your dashboard, use a unique ID for each HTML element. Duplicate IDs will cause conflicts and prevent visualizations from rendering correctly.
Step 5: Modify the data model
The data model can be used in two formats: Object model or Array model. Read more about these formats here. Use the format that best fits your scenario.
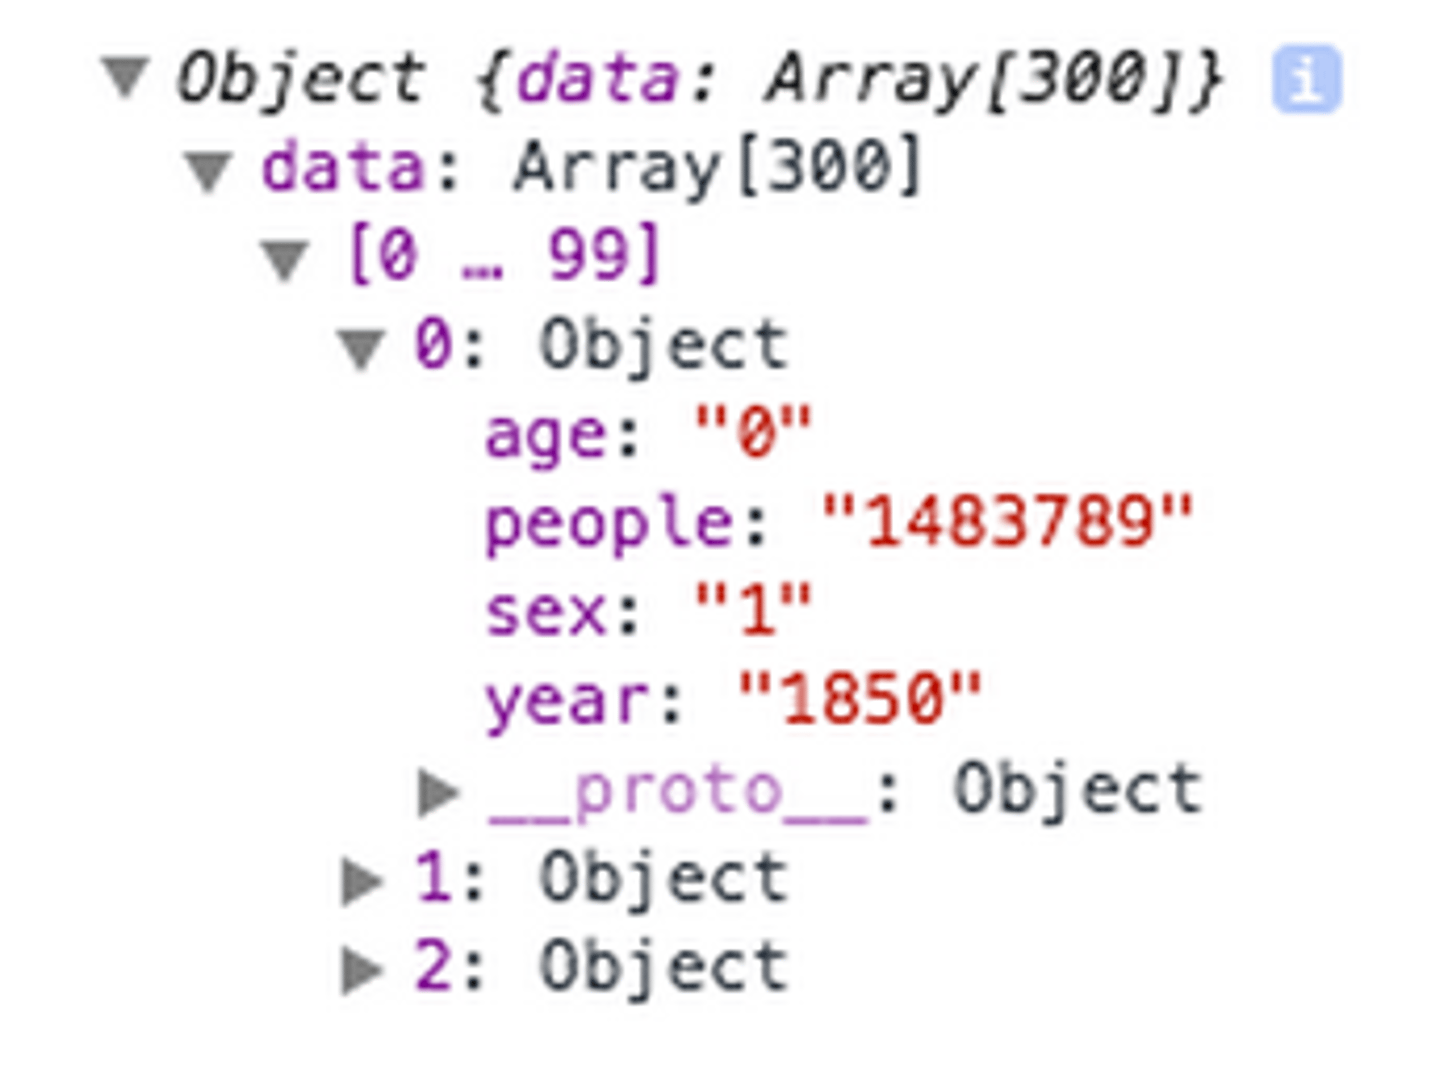
In this example, data values come back as strings. Before feeding the data into the visualization spec, convert those strings to numbers. The following code uses underscore to loop through the data model and push converted values into a new array. Underscore is available in the runtime and works well for data transformation.
var _data = [];

_.each(_dataModel.data, function(element){
    _data.push({year: Number(element.year), age: Number(element.age), sex: Number(element.sex), people: Number(element.people)});
});
Tip: For performance reasons, the data model in the Klip Editor may not contain the full dataset from your data source. The complete data will be available once you add the Klip to your dashboard.
Step 6: Get the component width and render the visualization
To make the visualization resize dynamically — the same way native Klipfolio visualizations do — reference the HTML Template component dimensions. Component width updates automatically as the dashboard or browser window resizes.
//Get the component width
var _width = _component.dimensions.w;

//Set the properties that need to change as the width changes
var _scales_range1 = _width / 2 - 10;
var _marks_properties_x =  _width / 2 - 20;
var _marks_properties_width = _width / 2 - 40;
Note: The specific properties that need updating will vary depending on your visualization and specification.
Vega uses a visualization specification to render data. Pass the array you created above into the spec's data section as shown below. Read more about Vega data here.
"data": [
    {
      "name": "pop",
      "values": _data,
      "transform": [
        {"type": "filter", "test": "d.data.year == 1850 || d.data.year == 2000"}
      ]
    }
  ]
Tip: Vega supports transformation of data before rendering. In the example above, a filter transformation limits the data to years 1850 and 2000.
For this example, the visualization spec is based on the population sample in the Vega editor. Explore the Vega documentation to learn more about building your own specs.
Here is the complete code for the HTML Template and Script sections:
HTML Template:
<div id="vis"></div>
Script:
//Define the path configurations to the JS modules that you want to load //In this example we are loading D3, topojson (used by Vega) and Vega //Note: URLs have to be HTTPS due to browser security restrictions
var vizmodules = {
d3 : 'https://cdnjs.cloudflare.com/ajax/libs/d3/3.5.5/d3.min.js?noext',
topojson : 'https://cdnjs.cloudflare.com/ajax/libs/topojson/1.6.19/topojson.min.js?noext',
vega : 'https://cdnjs.cloudflare.com/ajax/libs/vega/1.5.0/vega.min.js?noext'
};//Pass in the configurations to requirejs
requirejs.config({
paths: vizmodules
});//Create a reference to the component
var _component = this;//Create a reference to the data model
var _dataModel = this.dataModel;//Load the libraries
require([vizmodules.vega],
function(vg) { // the callback function that is called after the libraries are loadedvar _data = [];
// use the dataModel and convert the string to numbers
_.each(_dataModel.data, function(element){
_data.push({year: Number(element.year), age: Number(element.age), sex: Number(element.sex), people: Number(element.people)});
});//Get the component width
var _width = _component.dimensions.w;//Set the properties that need to be updated as the width is updated
var _scales_range1 = _width / 2 - 10;
var _marks_properties_x = _width / 2 - 20;
var _marks_properties_width = _width / 2 - 40;var spec = {
"width": _width, //reference the component width in the spec
"height": 400,
"data": [
{
"name": "pop",
values: _data, // add the data to the spec
"transform": [
{"type": "filter", "test": "d.data.year == 1850 || d.data.year == 2000"}
]
}
],
"scales": [
{
"name": "g",
"domain": [0, 1],
"range": [_scales_range1, 10]
},
{
"name": "y",
"type": "ordinal",
"range": "height",
"reverse": true,
"domain": {"data": "pop", "field": "data.age"}
},
{
"name": "c",
"type": "ordinal",
"domain": [1, 2],
"range": ["#1f77b4", "#e377c2"]
}
],
"marks": [
{
"type": "text",
"interactive": false,
"from": {
"data": "pop",
"transform": [{"type":"unique", "field":"data.age", "as":"age"}]
},
"properties": {
"enter": {
"x": {"value": _marks_properties_x},
"y": {"scale": "y", "field": "age", "offset": 11},
"text": {"field": "age"},
"baseline": {"value": "middle"},
"align": {"value": "center"},
"fill": {"value": "steelblue"}
}
}
},
{
"type": "group",
"from": {
"data": "pop",
"transform": [
{"type":"facet", "keys":["data.sex"]}
]
},
"properties": {
"update": {
"x": {"scale": "g", "field": "index"},
"y": {"value": 0},
"width": {"value": _marks_properties_width},
"height": {"group": "height"}
}
},
"scales": [
{
"name": "x",
"type": "linear",
"range": "width",
"reverse": {"field": "index"},
"nice": true,
"domain": {"data": "pop", "field": "data.people"}
}
],
"axes": [
{
"type": "x",
"scale": "x",
"format": "s",
"properties": {
"ticks": {
"stroke": {"value": "steelblue"}
},
"majorTicks": {
"strokeWidth": {"value": 2}
},
"labels": {
"fill": {"value": "steelblue"},
"angle": {"value": 50},
"align": {"value": "left"},
"baseline": {"value": "middle"},
},
"title": {
"fontSize": {"value": 16}
},
"axis": {
"stroke": {"value": "#333"},
"strokeWidth": {"value": 1.5}
}
}
}
],
"marks": [
{
"type": "rect",
"properties": {
"enter": {
"x": {"scale": "x", "field": "data.people"},
"x2": {"scale": "x", "value": 0},
"y": {"scale": "y", "field": "data.age"},
"height": {"scale": "y", "band": true, "offset": -1},
"fillOpacity": {"value": 0.6},
"fill": {"scale": "c", "field": "data.sex"}
}
}
}
]
}
]
};// pass in the spec to Vega to render
vg.parse.spec(spec, function(chart) { chart({el:"#vis"}).update(); });});
Once the code is in place, the visualization should render in the editor. If it does not, make a minor change to the HTML code (e.g. add and then delete a space) to trigger a re-render.
Save your Klip and add it to your dashboard.
!vega integration
What this integration shows
This walkthrough used Vega, a powerful visualization library built on D3, to extend Klipfolio's built-in visualization capabilities with a fully custom chart. The result demonstrates the flexibility and extensibility of the Klips platform.
Visualization experts can use Klipfolio as a data platform — connecting to any number of cloud sources — and bring their own JavaScript libraries to render the custom visualizations and controls they want in their Klips.
Note: All Vega visualization library specs, code, and samples are subject to the Vega licence: https://github.com/vega/vega/blob/master/LICENSE
Related Articles

10 Cloud BI Dashboard Tools for Small Businesses in 2026

6 dashboards I use daily to run my SaaS company
By Allan Wille, Co-Founder — April 10th, 2026
Klipfolio Partner How-To #1: Duplicating dashboards across client accounts
By Stef Reid — November 27th, 2025
