Metric-centric analytics - What it is and why it matters

Published 2023-07-12, updated 2023-11-27
Summary - The metric-centric analytics approach provides a massive opportunity to bridge the current gaps between the needs of data and business teams when working with data. The baked-in metrics layer provides a trusted, clean, and governed single source of truth for all metrics in the organization. Business and data teams work in the same environment, encouraging collaboration and a mutual understanding of and investment in the company’s metrics. A purpose-built, no-code visualization layer enables a true self-serve analytics and BI experience.
In a traditional business intelligence (BI) and analytics approach, data is accessed directly from a data warehouse. Whereas metric-centric analytics adds a metrics definition layer that sits between the data warehouse and the visualization components. The metrics layer (sometimes called a semantic layer) is a relatively new concept in the modern data stack. A metric-centric BI approach includes a baked-in metrics layer where semantic meaning and metadata live alongside dashboards, reports, and data exploration. By recognizing the importance of metric visualization, metric-centric analytics takes the concept of a metrics layer to the next level, achieving its full potential. The addition of a metrics layer enables data teams to quickly debug and edit metrics and data consumers to explore and visualize those metrics – all in the same environment. Not only does this make collaboration between teams easier, it will also reduce costs. This article describes the fundamental components of metric-centric analytics and the benefits to both data and business teams.
What is a metrics layer?
The metrics layer is a central location for an organization’s metrics. It’s where business logic and semantic meaning is applied to data to create metrics. It’s also an organization’s single source of truth, where important metrics are defined, calculated, and stored. As such, it should be governed by the company’s data experts. Once the metrics are defined, they’re ready to be used for analysis.
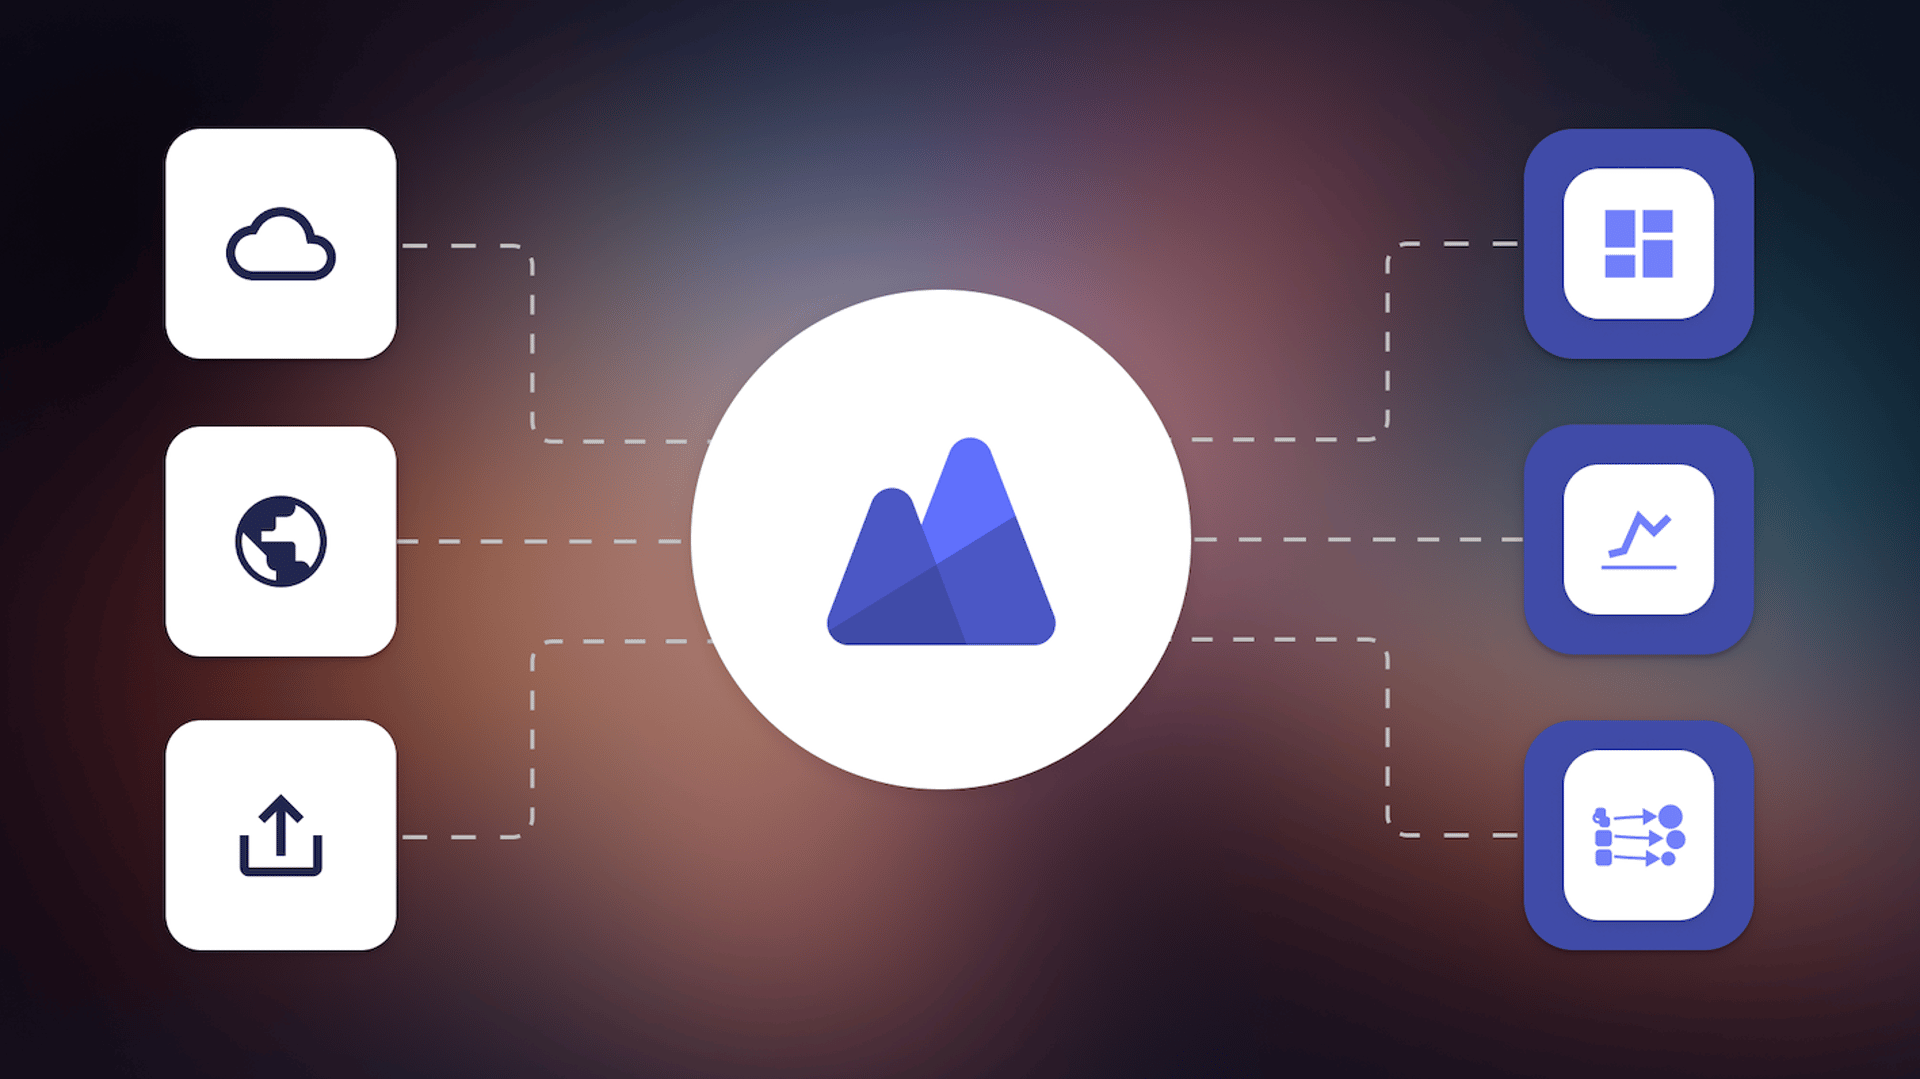
A metrics layer is a separate but integrated layer within the modern data stack:
The benefits of a metrics layer
A metrics layer modernizes your data stack and helps solve the challenges experienced by organizations of a certain size and data maturity. Most of us would agree that teams make the best decisions when everyone has access to the same information. But, when it comes to data-driven decision making, individuals and teams often use different data sources and tools, depending on their access to data and their technical expertise. A metrics layer aims to solve this problem by using consistent, agreed-upon metric definitions. By doing so, it bridges the gap between data and business teams and ensures everyone’s speaking the same data language.
Metrics are the language of data
Working together, business and data teams create meaningful definitions and calculations for their most important metrics. These will be centrally applied in the metrics layer. Once created, data engineers manage these metrics and the business teams never need to worry again about numbers not being correct. The source data is modeled and trusted, the measure and time grain are properly defined, and the definition spells out, in plain language, what the metric means. Once everything has been defined, business teams can focus on what they’re good at – using trusted, clean, and up-to-date metrics for decision making.
Single Source of Truth
With metrics being defined and stored in a single central location, from which they can be shared for dashboard building or further analysis, duplication of metrics is discouraged. Adding a verification process would further ensure everyone is using the proper metrics. This infrastructure gives the data team peace of mind, knowing that all business users are accessing the same, correct data. Also, business teams can use and analyze the data safely, knowing everybody is using the same trusted and always up-to-date data.
Transparency
With metrics stored and accessed from a data catalog, it’s easy for everyone to understand how they’re defined and calculated. The catalog also allows users to see who owns or has modified the metric, how many colleagues are using it, and where its source data comes from. A transparent system, where everyone can see how metrics are defined and sourced, encourages trust in the data and promotes data literacy across the organization. A metrics layer ensures the data lineage is never obscured and users can feel confident that they’re using reliable data.
Consistency
Once a metric is defined, calculated, and stored in the metrics layer, it can be used across an almost endless number of consumption end-points (aka headless BI). Since it’s being managed and stored in a single location, a metrics layer ensures 100% consistency. This centralized model ensures that everyone, regardless of which department they work in, uses the same data, resulting in more effective decision-making.
Flexibility and continuity
Metrics can be updated as the business evolves and needs change. Definitions and calculations can be as business specific as they need to be or globally applicable in the case of industry-agreed upon metrics, such as in banking and finance. The flexibility doesn’t stop there. A metrics layer allows the underlying data to be updated, replaced, repaired, or augmented without having to publish a new metric. While all this happens in the background, managed by the data-team, business users aren’t disrupted and can keep working with the metric and trust it will continue to operate and stay up-to-date.
Scalability
Over time, as an organization grows and matures, teams will likely need to track more metrics. A metrics catalog that promotes use and re-use of metrics makes it easy to add new ones, or build calculated metrics using existing metrics. All without disrupting current end-user dashboards and reports. In addition, metrics only use the data that’s needed for their calculations. This means organizations won’t run into scalability issues with large amounts of data. Metrics within a metrics layer only use the necessary data points, discouraging mass replication and providing single-source-of-truth authenticity and security.
Why metric-centric analytics is better than adding analytics on top of a metrics layer
Now that you know the benefits of including a metrics layer in your data stack, let’s look at the concept and benefits of metric-centric BI. Organizations can simply add both a metrics layer and a BI layer (like a dashboarding solution) on top of their data stack. While this will help them see the value of a metrics layer, they’ll miss out on the efficiency and elegance that comes with a metric-centric BI design.
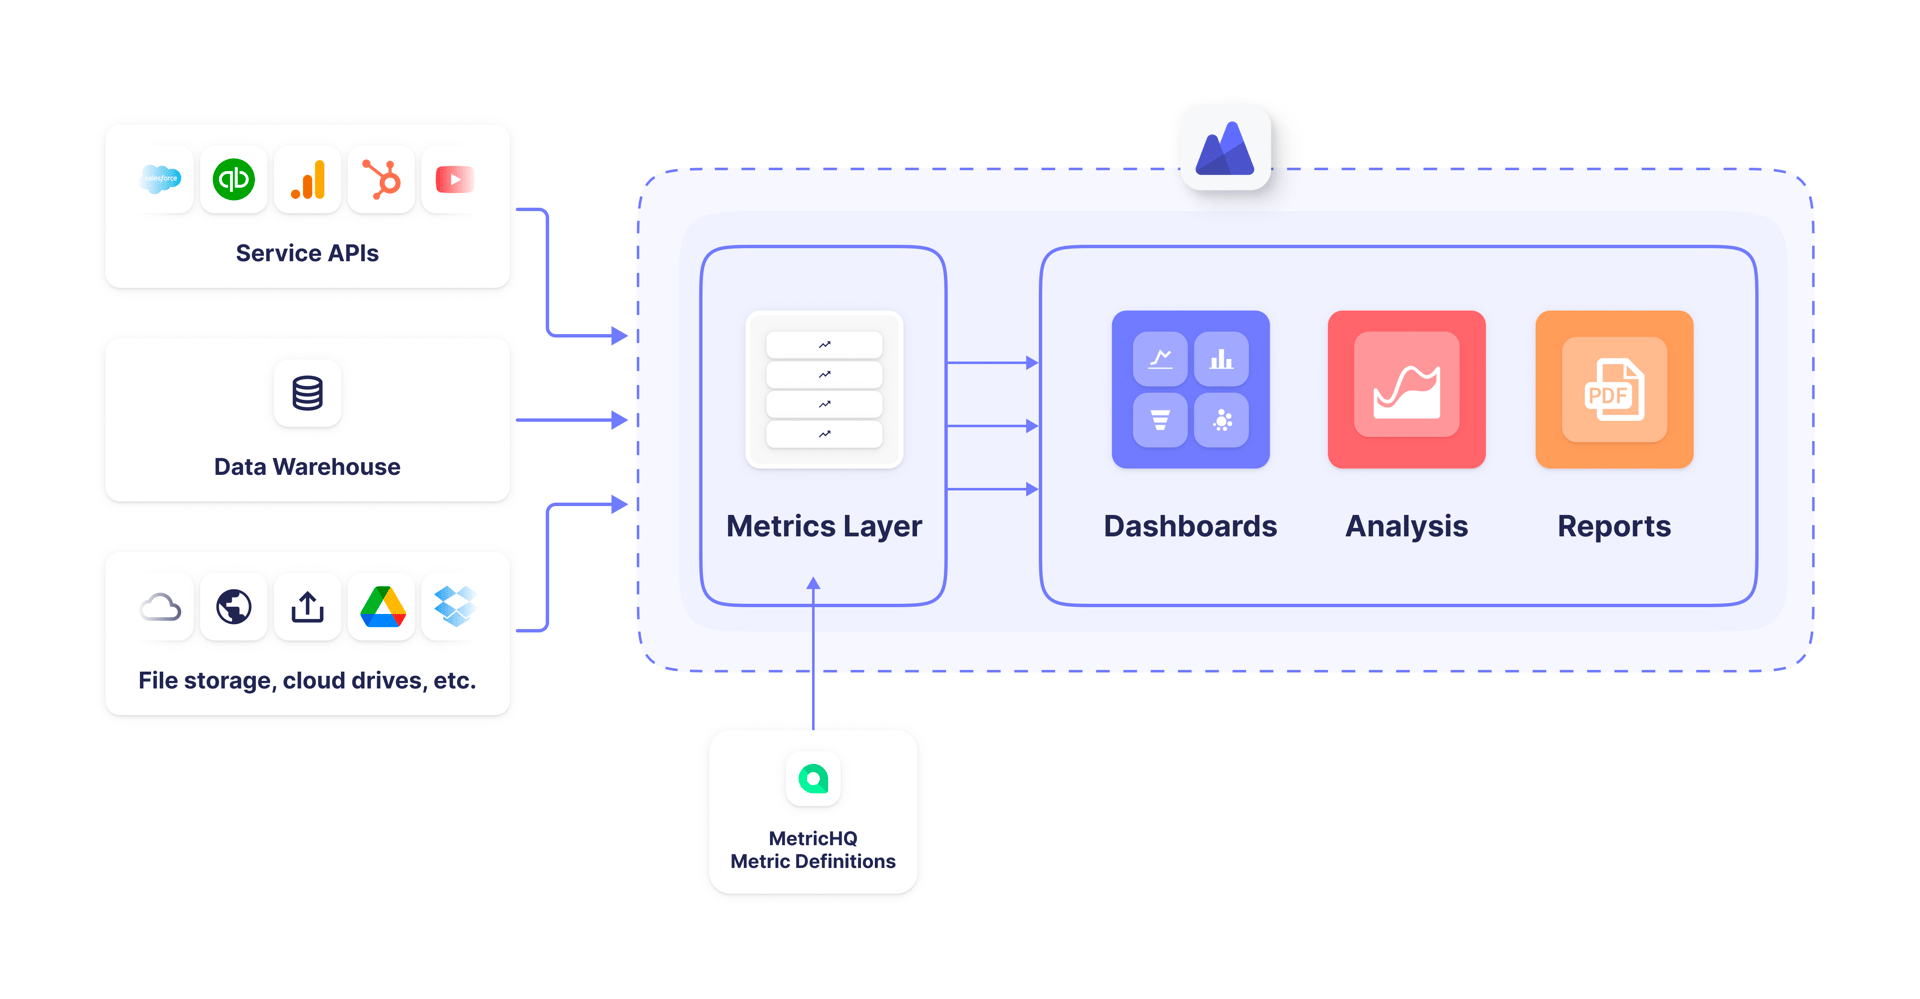
The metric-centric architecture of PowerMetrics:
WYSIWYG metrics
Working with data can be difficult. For most of us, it’s easier to make sense of a metric when it’s visually represented. Being able to quickly change the chart type, edit the date range, segment and apply filters, means a metric can be more easily understood and tested. Even data developers and analysts, who understand the underlying data infrastructure and tables, need visualization to make sure the metric they created satisfies the business needs. Visualizations are also key to validating the requirements of the stakeholders (the ones who asked for the metric in the first place). Being able to see the impact of your choices as you create a metric is a powerful feature and one that’s included in PowerMetrics. Live-preview not only makes the building process faster, interactive, and more enjoyable, it also guarantees you get the right metric the first time, reducing feedback loops with stakeholders. This no-code environment enables non-developers, like analysts, data stewards or business users, to fine tune metric definitions and see the impact in real time. A metric-centric analytics solution like PowerMetrics offers a broad range of data analysis and exploration features, like the Explorer and Metric Homepages. Not only can these be used by business teams to analyze data, they’re also effective tools for data developers to test and debug a metric before it gets shared with others. A truly headless BI solution may have its charm to a lot of people, but understanding data can never be “headless”.
Granular levels of governance
Metric-centric analytics enables business and data teams to work in the same environment. Although business users could analyze and visualize metrics in their customary BI tool, and avoid having to learn a new application, there are benefits to working in a shared system. With metric-centric analytics, business users can be granted access to view or edit selected metrics and contribute to the catalog. Through their interactions with the data, they can gain an in-depth understanding of the business logic behind the metrics they use every day. The data team, usually the primary owner of the metrics layer, can define the level of access for each user. From shielding the complexity of data connections and the underlying data feeds from users, to granting access rights to view and explore a metric or dashboard, everything can be defined appropriately.
True self-serve BI
The above-mentioned exploration and analysis features are a great way for non-technical business users to explore data, change visualizations within seconds, and share insights with others, without worrying about affecting the underlying metric or writing a single line of code. Being able to see and use the same metric visualizations as the data team, business users aren’t only enabled, they’re more likely to understand and trust the data. Metrics-centric analytics can lead to a higher adoption rate (which is typically low with BI tools) and, therefore, better ROI than a visualization-only layer in the data stack. Most importantly, building dashboards and reports using any existing metric within PowerMetrics is incredibly easy. Data teams will never, ever have to build a single dashboard again.
Building better dashboards with metric-centric analytics
The demand for dashboards and reports won’t go away any time soon. It can’t, because they’re the best and most familiar way to make sense of data for effective decision making. While it’s possible to analyze each metric by itself, dashboards are ideally suited to tell a data story. With its innovative architecture, PowerMetrics is the only metric-centric analytics solution in the market designed around a metrics layer, with all the added benefits of a full stack BI tool. Metric-centric analytics is the key to data consistency, transparency, and a single source of truth for an organization’s most important metrics – true self-serve analytics. It’s also a better way to build dashboards and reports. It allows everyone to do what they’re best at: Data teams manage the data, business teams get the reports they need and both sides finally get to speak the same language: Metrics.
Related Articles
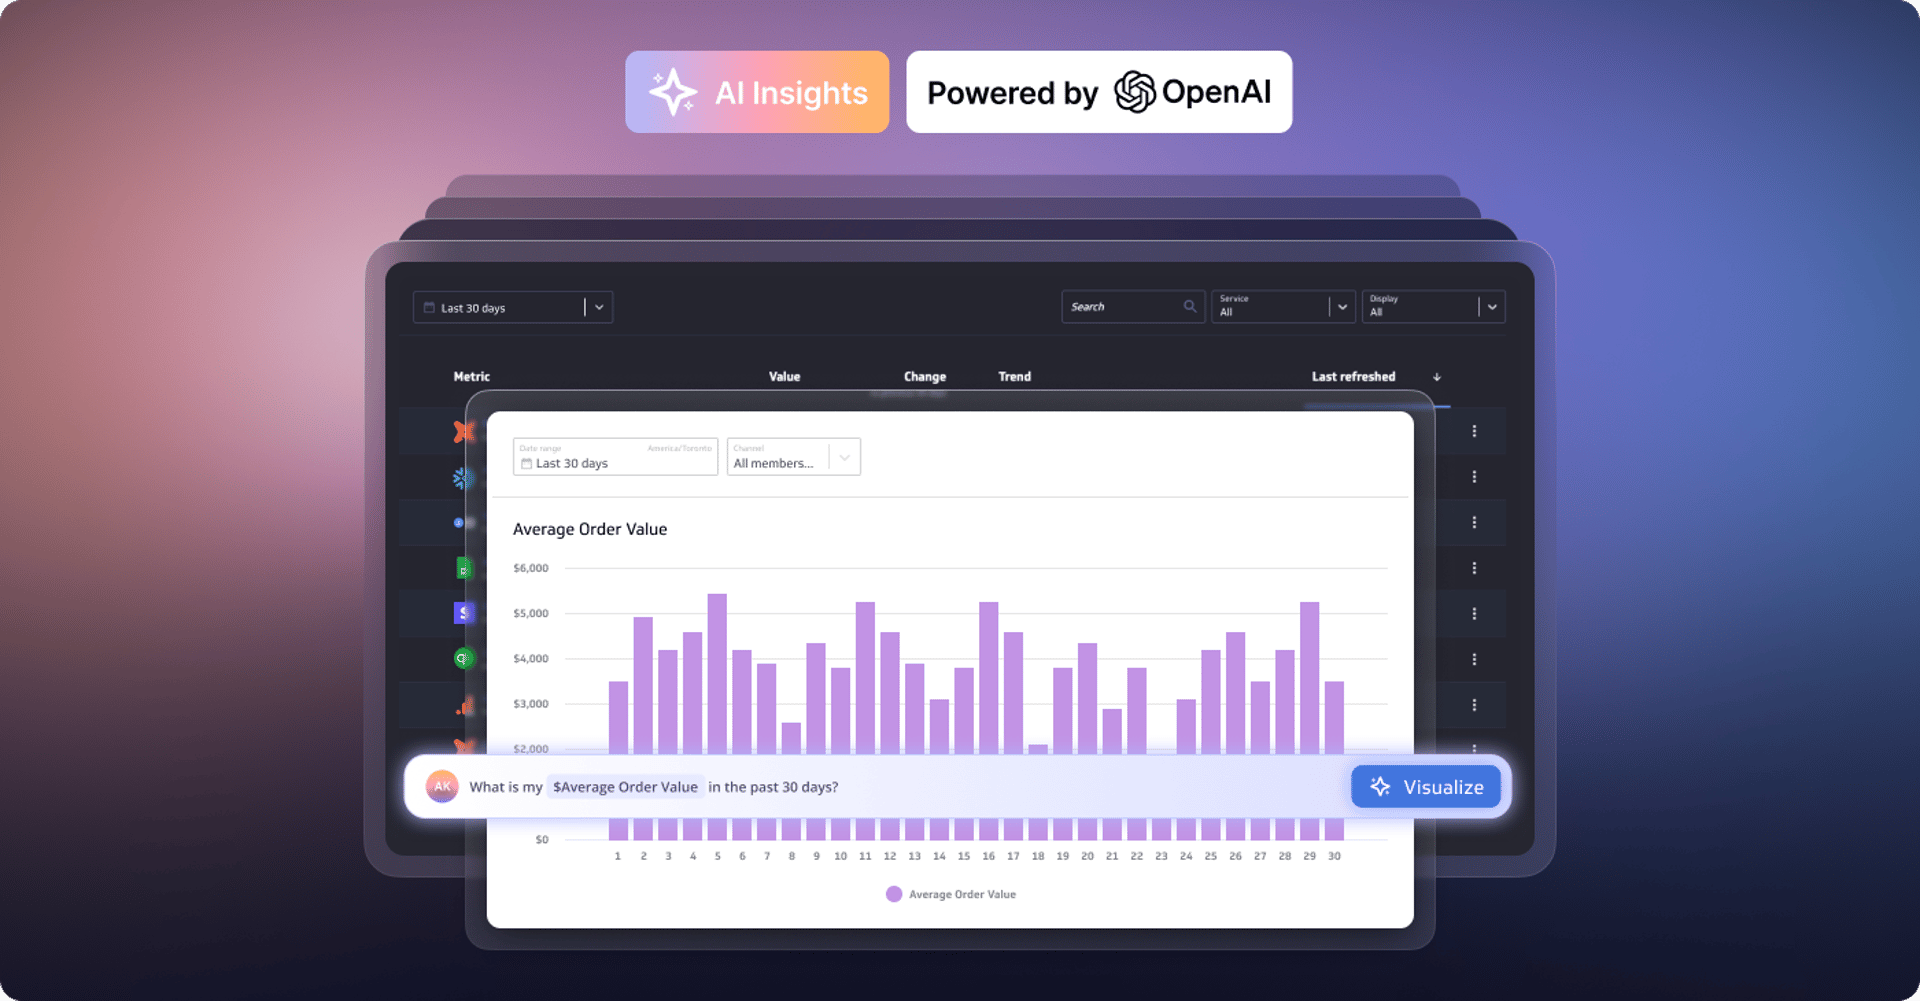
Metrics provide rich context for better AI: Introducing the new PowerMetrics AI experience
By David Mennie — June 21st, 2024
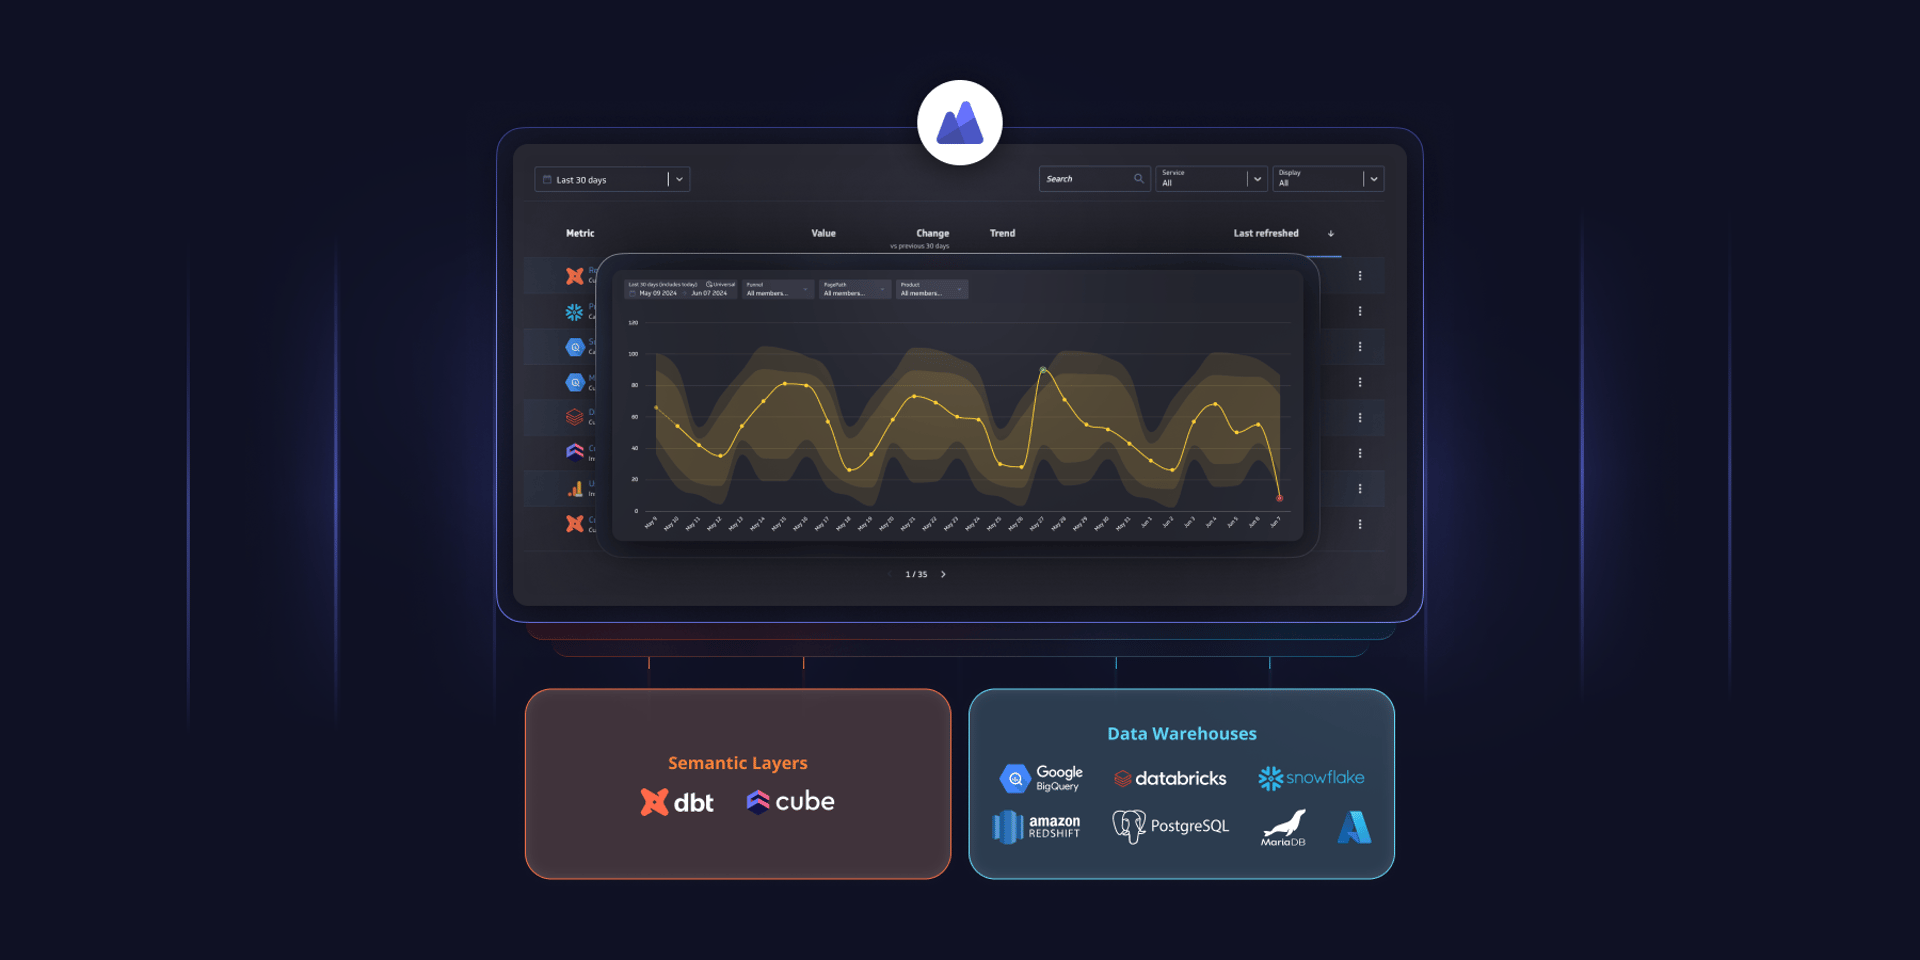
PowerMetrics - New data warehouse integrations and Cube semantic layer support
By David Mennie — June 14th, 2024
Partner Case Study: Eyeful
By Cathrin Schneider — May 21st, 2024

Partner Case Study: The Project Booth
By Cathrin Schneider — April 11th, 2024