Monthly Recurring Revenue Expansion Rate
The ultimate guide to understanding, calculating, and improving the metric that fuels sustainable SaaS growth.
MRR Expansion Rate
Measure revenue growth from existing customers with MRR Expansion Rate
For subscription businesses, growing revenue from customers you already have is one of the clearest signs of a healthy model. MRR Expansion Rate measures exactly that: the percentage increase in monthly recurring revenue generated from your existing customer base, without counting a single new customer.
When this number is strong, it tells you something important. Customers are finding more value in your product over time, not less.
What is MRR Expansion Rate?
MRR Expansion Rate is the percentage increase in monthly recurring revenue from existing customers, month over month, through upgrades, add-ons, or seat expansions.
It excludes revenue from newly acquired customers entirely. That focus is what makes it valuable: a rising MRR Expansion Rate means your current customers are choosing to pay you more, which is a direct signal of satisfaction and product value.
How do you calculate MRR Expansion Rate?
You need two numbers: the Expansion MRR for the month and the total MRR at the start of that month.
The components:
- Expansion MRR: Additional monthly recurring revenue from existing customers through upgrades, cross-sells, and add-ons in a given month.
- MRR at Start of Period: Total monthly recurring revenue from all customers at the beginning of the same month.
The formula:
(Expansion MRR / Total MRR at Start of Period) × 100
Example: If your Expansion MRR is $10,000 and your total MRR at the start of the month was $200,000:
($10,000 / $200,000) × 100 = 5%
Your MRR Expansion Rate for that month is 5%.
Why is MRR Expansion Rate important?
This metric tells you whether your existing customers are growing in value, not just whether you are adding new ones. For any subscription business, that distinction matters.
- Capital-efficient growth: Generating revenue from existing customers costs far less than acquiring new ones. A strong MRR Expansion Rate means your growth engine is not entirely dependent on new sales.
- A signal of real satisfaction: When customers upgrade or buy more, they are voting with their budget. That is a more reliable signal than a survey score.
- The path to negative churn: If your MRR Expansion Rate exceeds your churn rate, your business grows even without adding a single new customer. That is one of the most durable positions a SaaS company can reach.
- Predictable revenue: Expansion revenue makes financial forecasting more reliable and demonstrates a compounding, scalable model to investors and leadership.
Without tracking MRR Expansion Rate, you might see healthy top-line MRR growth while missing the fact that it is entirely driven by new acquisition. That is a fragile position. This metric surfaces the difference.
What is a good MRR Expansion Rate benchmark?
Benchmarks vary by company size and stage, but a working framework for SaaS businesses looks like this:
| Performance level | Monthly MRR Expansion Rate |
|---|---|
| Healthy | 10% to 15% |
| Strong | 16% to 20% |
| World-class | Above 20% |
Earlier-stage companies often see higher rates because there is more room to grow within the initial customer base. The threshold that matters most: your MRR Expansion Rate should consistently outpace your revenue churn rate. When it does, you have net negative churn, and the business compounds on its own.
How to improve your MRR Expansion Rate
More expansion revenue comes from creating more value for existing customers and making it straightforward for them to access it.
- Use tiered pricing: Structure plans so customers can move up to access more features or higher usage limits without friction.
- Offer meaningful add-ons: Build optional features or services that solve specific customer problems. Customers who can customize their subscription stay longer and spend more.
- Equip your customer success team: The people closest to your customers are best positioned to spot expansion opportunities. Give them the data and mandate to act on what they see.
- Show customers what they are missing: In-app messages, email campaigns, and usage-based nudges that highlight underused features or the benefits of upgrading convert well when they are relevant and timely.
The common thread: expansion happens when customers see a clear connection between paying more and getting more of what they already value.
Create custom dashboards for you and your team.
Get started with KlipsHow to track MRR Expansion Rate
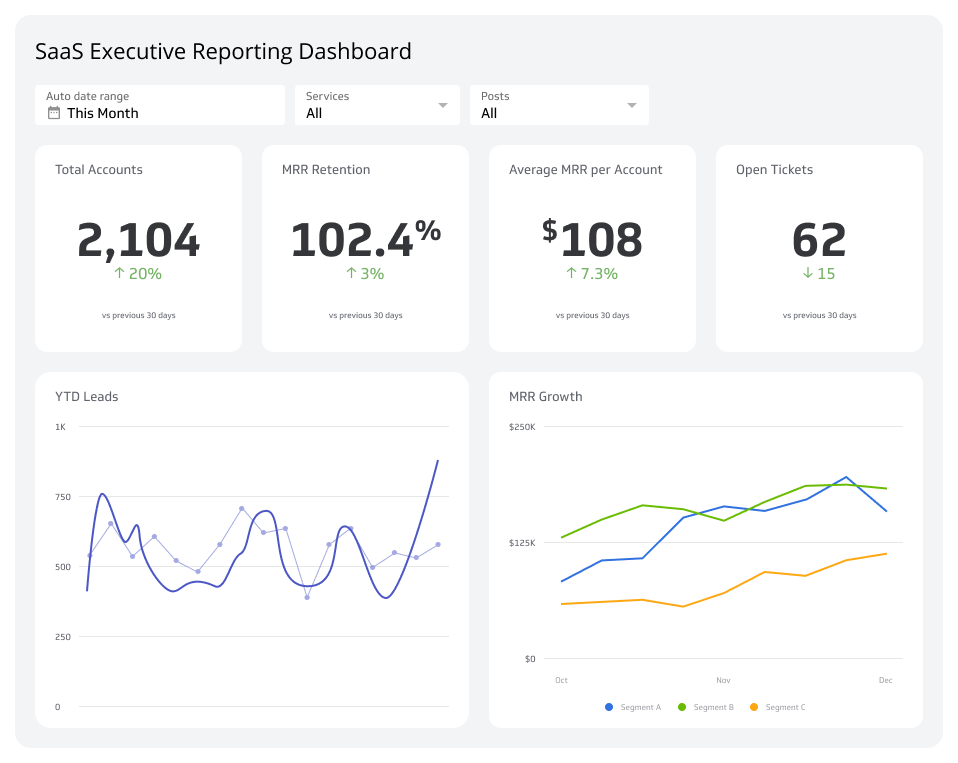
MRR Expansion Rate is most useful when you see it alongside the metrics it connects to: Customer Churn Rate, Customer Lifetime Value, and Customer Acquisition Cost. Together, these tell you whether growth is healthy and where the risks are.
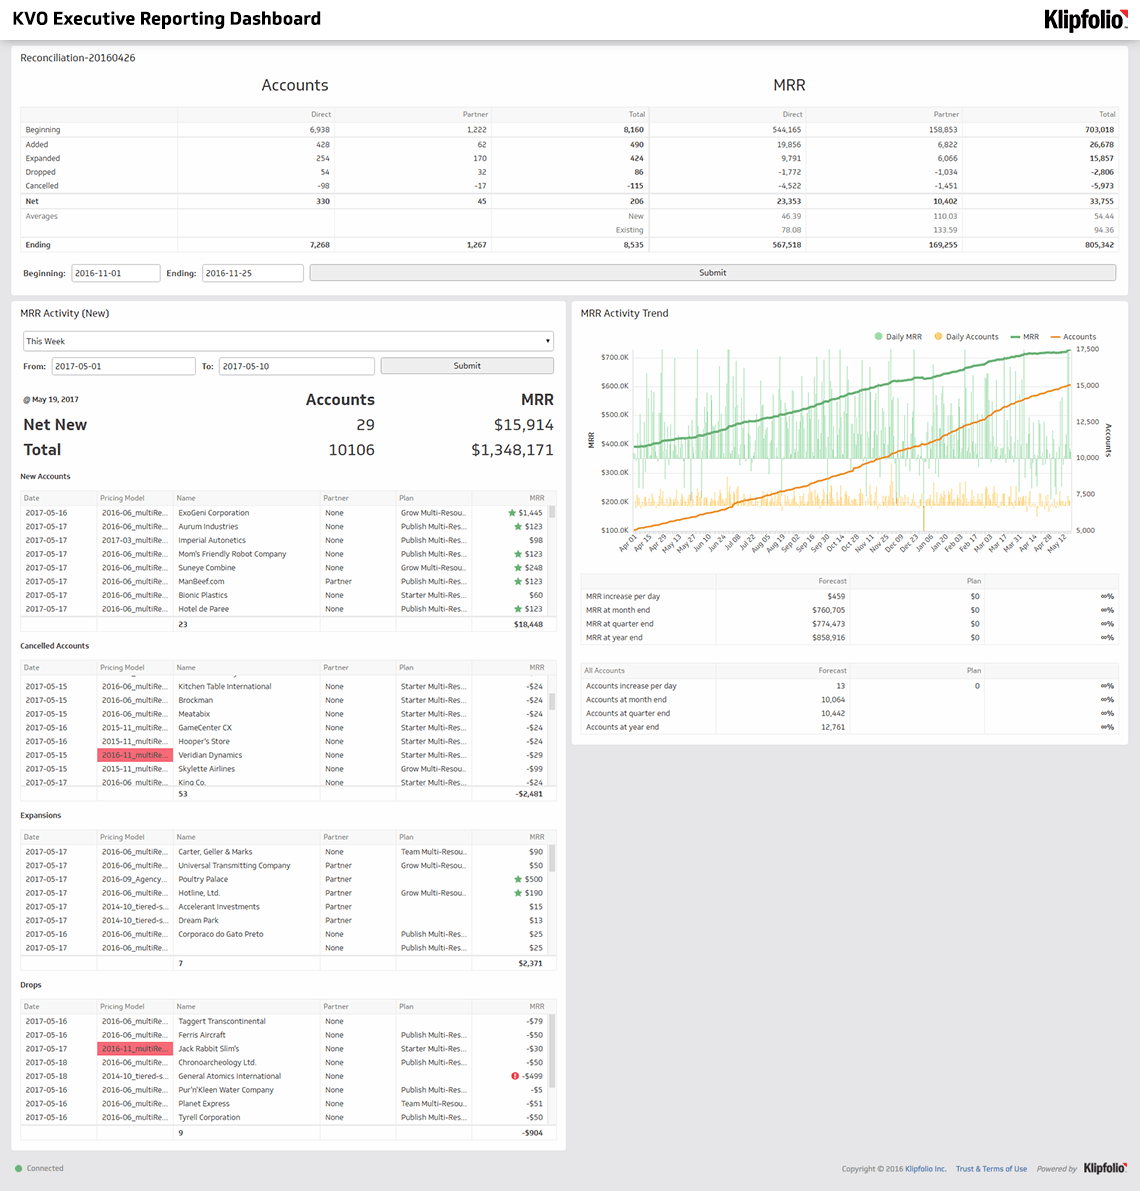
Checking these numbers separately, across different tools or spreadsheets, means someone always has to pull a report before a decision can happen. A centralized dashboard puts the right numbers in front of the right people automatically, so you know where things stand without having to ask.
Klipfolio Klips connects to your data sources and keeps your SaaS metrics current, so your team is always working from the same picture.