Net Monthly Recurring Revenue
Net Monthly Recurring Revenue (Net MRR) is the net change in recurring revenue within a month, calculated by adding new and expansion revenue, then subtracting reduction and cancellation revenue.
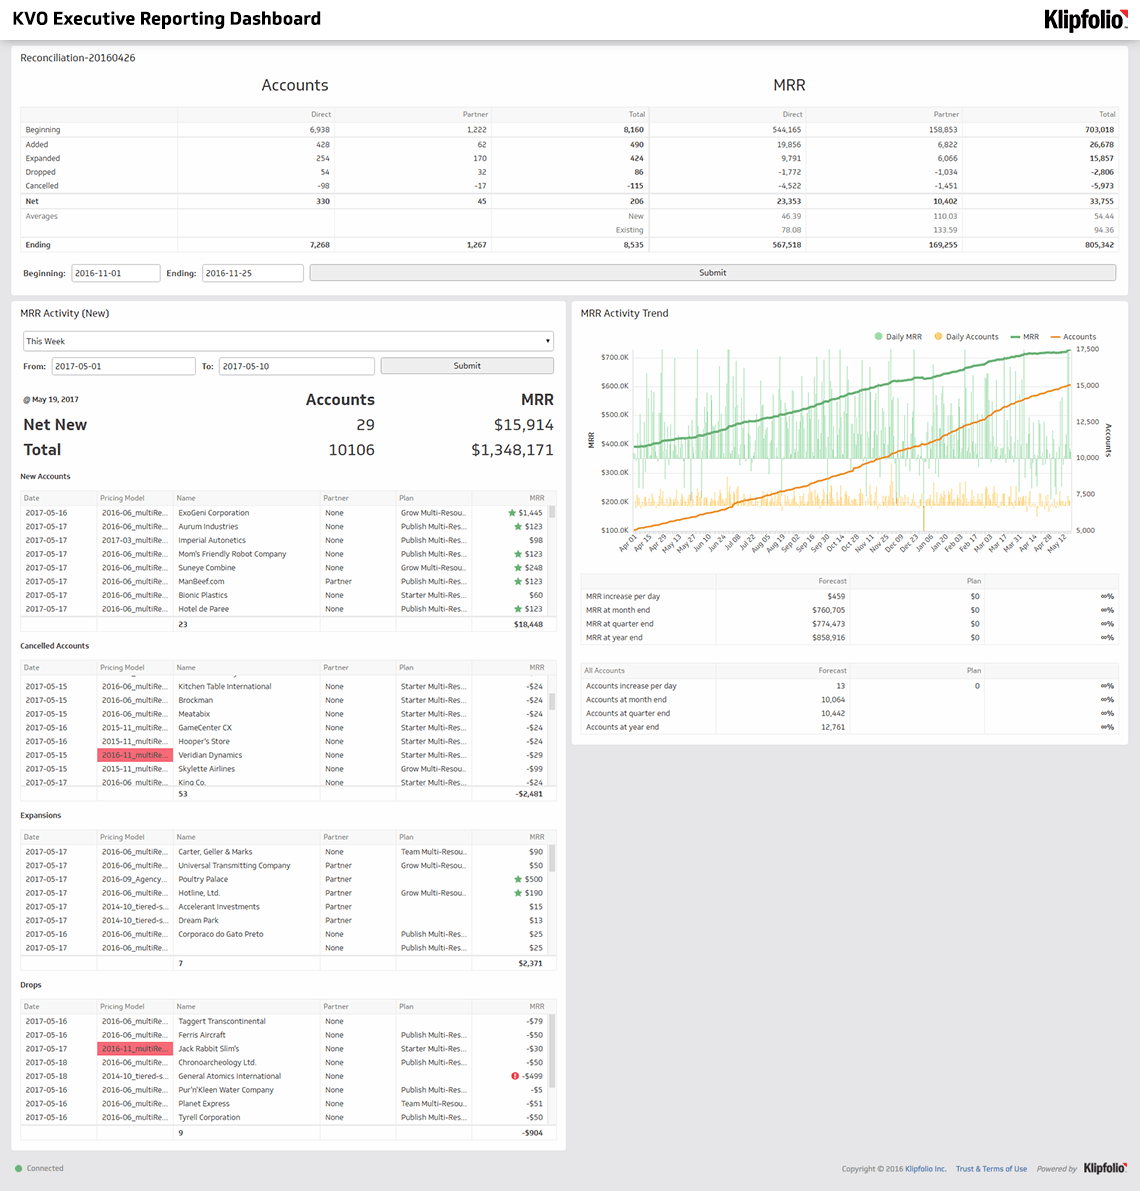
Net MRR Movement
What is Net Monthly Recurring Revenue?
Net Monthly Recurring Revenue (Net MRR) is the net change in recurring revenue within a month, calculated by adding new and expansion revenue, then subtracting reduction and cancellation revenue.
It tells you, at a glance, whether your subscription revenue base is growing, shrinking, or holding steady.
Why Net MRR matters
Every SaaS business loses some accounts every month. Customers downgrade. Others cancel. What Net MRR shows you is whether the revenue you are adding from new accounts and expansions outpaces what you are losing. That ratio is one of the clearest signals of business health available to a SaaS leader.
Tracking Net MRR means you are not waiting until the end of the quarter to find out the revenue picture has shifted. You know now, and you can act on it.
A related metric worth tracking alongside Net MRR is Net Dollar Retention, which shows how much revenue you retain and expand from your existing customer base over a given period. Strong Net Dollar Retention comes from reducing churn and closing expansion deals.
The four components of Net MRR
Net MRR is built from four inputs. Each one tells you something different about where revenue is moving.
New MRR
New MRR is the total recurring value added from accounts that became customers within the month. Every new subscription contributes its expected monthly value to this figure.
New MRR (A) = Value of new account 1 + Value of new account 2 + … + Value of new account N
Expansion MRR
Expansion MRR captures the additional recurring value when existing customers upgrade or increase their account size. This often happens as a customer's team grows, or once they have experienced enough of the product to justify expanding usage.
Expansion MRR (B) = Value added to existing account 1 + Value added to existing account 2 + … + Value added to existing account N
Reduction MRR
Reduction MRR records the recurring value lost when existing customers downgrade. A customer may reduce their account because their team has shrunk, their budget has tightened, or they are using fewer features than they once did. Tracking this separately from cancellations helps you see where accounts are at risk before they churn entirely.
Reduction MRR (C) = Value lost from existing account 1 + Value lost from existing account 2 + … + Value lost from existing account N
Loss MRR
Loss MRR is the recurring value lost from accounts that cancelled within the month. Each cancelled subscription contributes its full monthly value to this figure.
Loss MRR (D) = Value of cancelled account 1 + Value of cancelled account 2 + … + Value of cancelled account N
How to calculate Net MRR
Net MRR = New MRR (A) + Expansion MRR (B) - Reduction MRR (C) - Loss MRR (D)
A positive result means your revenue base grew. A negative result means losses outpaced gains. Watching this number month over month tells you whether the trajectory is improving or deteriorating, and which component is driving the change.
If Net MRR is negative, the question is whether it is a churn problem (Loss MRR is high), a downgrade problem (Reduction MRR is rising), or a pipeline problem (New MRR is not keeping pace). Each diagnosis points to a different fix.
What's the difference between MRR and ARR?
Monthly Recurring Revenue (MRR) measures recurring revenue normalized to a single month. Annual Recurring Revenue (ARR) projects that figure across a full year. Net MRR focuses specifically on the month-over-month change, making it the more actionable number for teams monitoring revenue momentum in real time.
Create custom dashboards for you and your team.
Get started with KlipsTracking Net MRR on a dashboard
Pasting your MRR components into a spreadsheet or asking a tool to calculate them from scratch each month adds unnecessary friction. A connected dashboard pulls the numbers from your billing system automatically, keeps every component visible in one place, and surfaces changes without anyone having to go looking.
When the right people can see Net MRR, Expansion MRR, and Loss MRR together, the conversation shifts from "what happened?" to "what do we do about it?"