LinkedIn Analytics
Grow your audience and monitor your post performance with a LinkedIn Analytics dashboard.
What is a LinkedIn Analytics?
A LinkedIn Pages dashboard displays the metrics and KPIs for your organic social media marketing. Creating a LinkedIn dashboard lets you easily understand how your content performs, if you’re reaching your target audience, and the level of engagement with your LinkedIn content.
A LinkedIn dashboard will help you answer important questions like:
- How many people are seeing my content?
- How does my audience engage with my content? Are they actively engaging (leaving comments) or passively engaging (liking content)?
- What type of content performs best?
A LinkedIn dashboard gives you the insight you need to shape LinkedIn as part of your organic social media marketing strategy.
What metrics should you include on a LinkedIn dashboard?
.png)
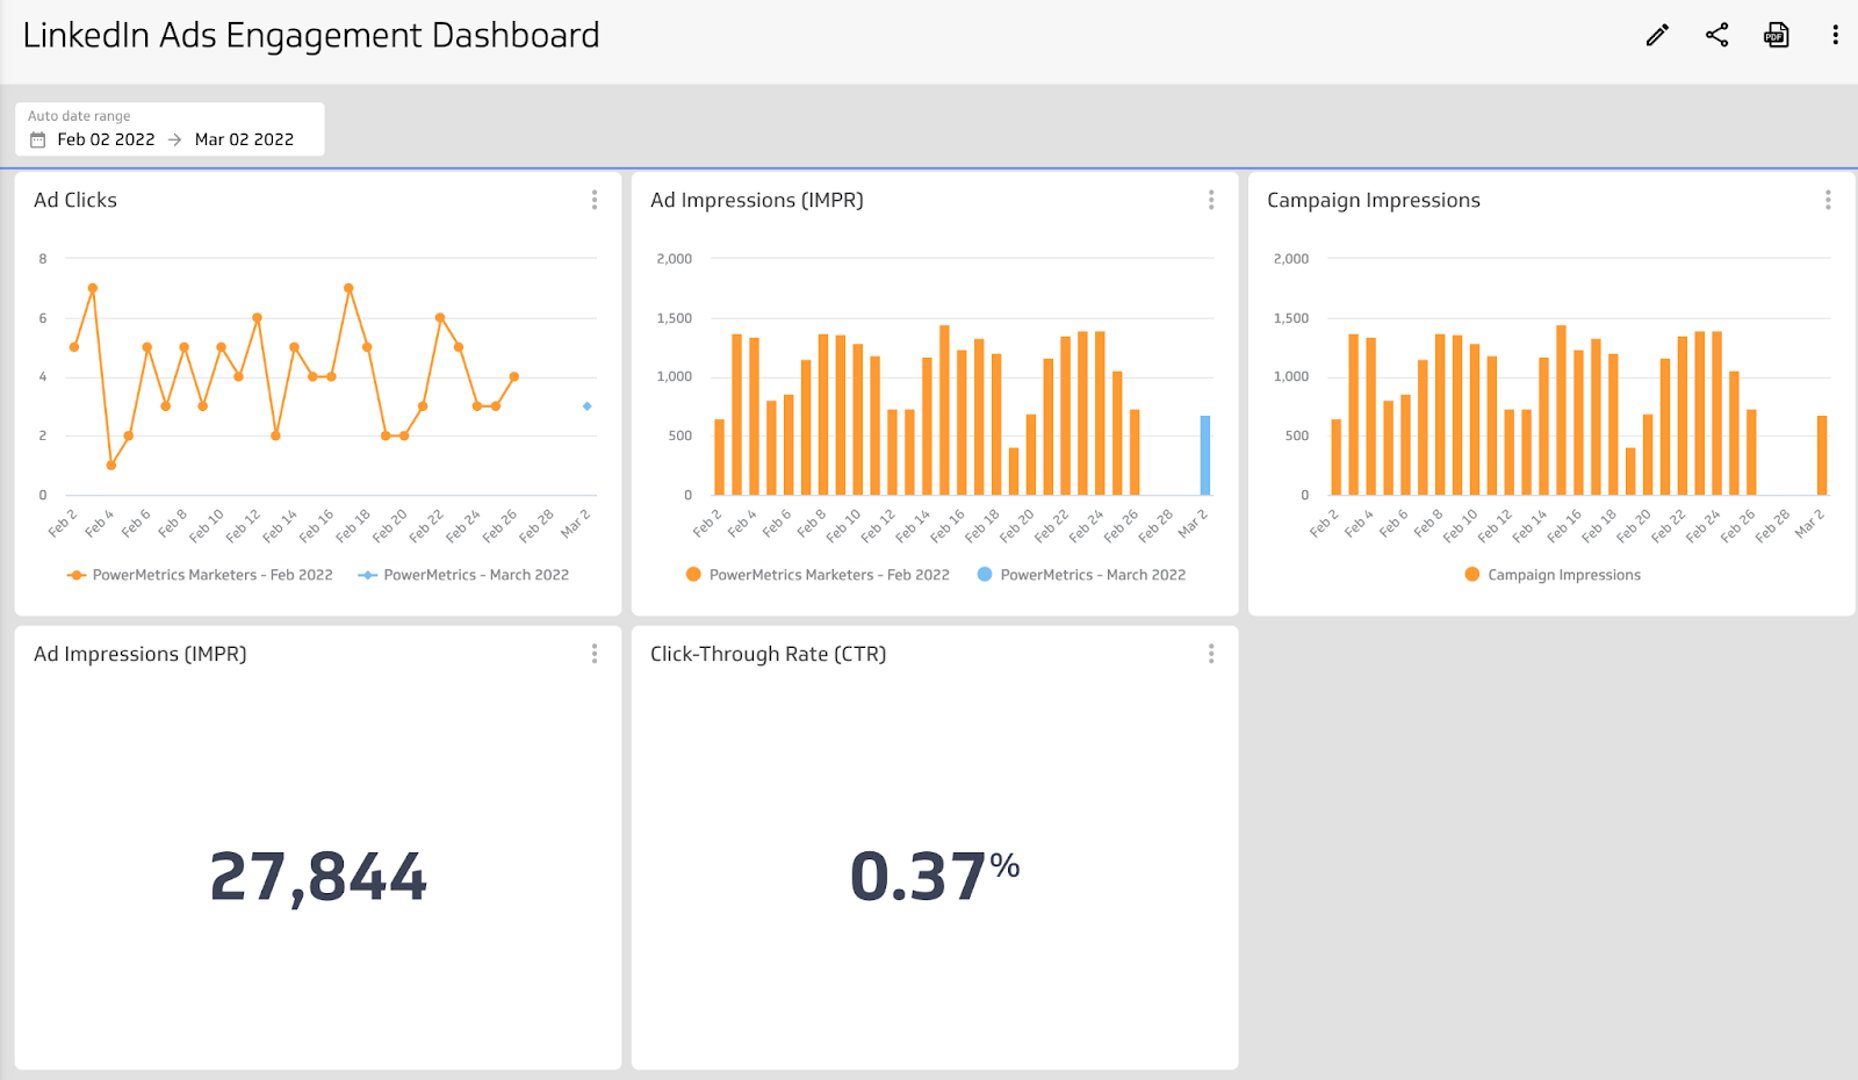
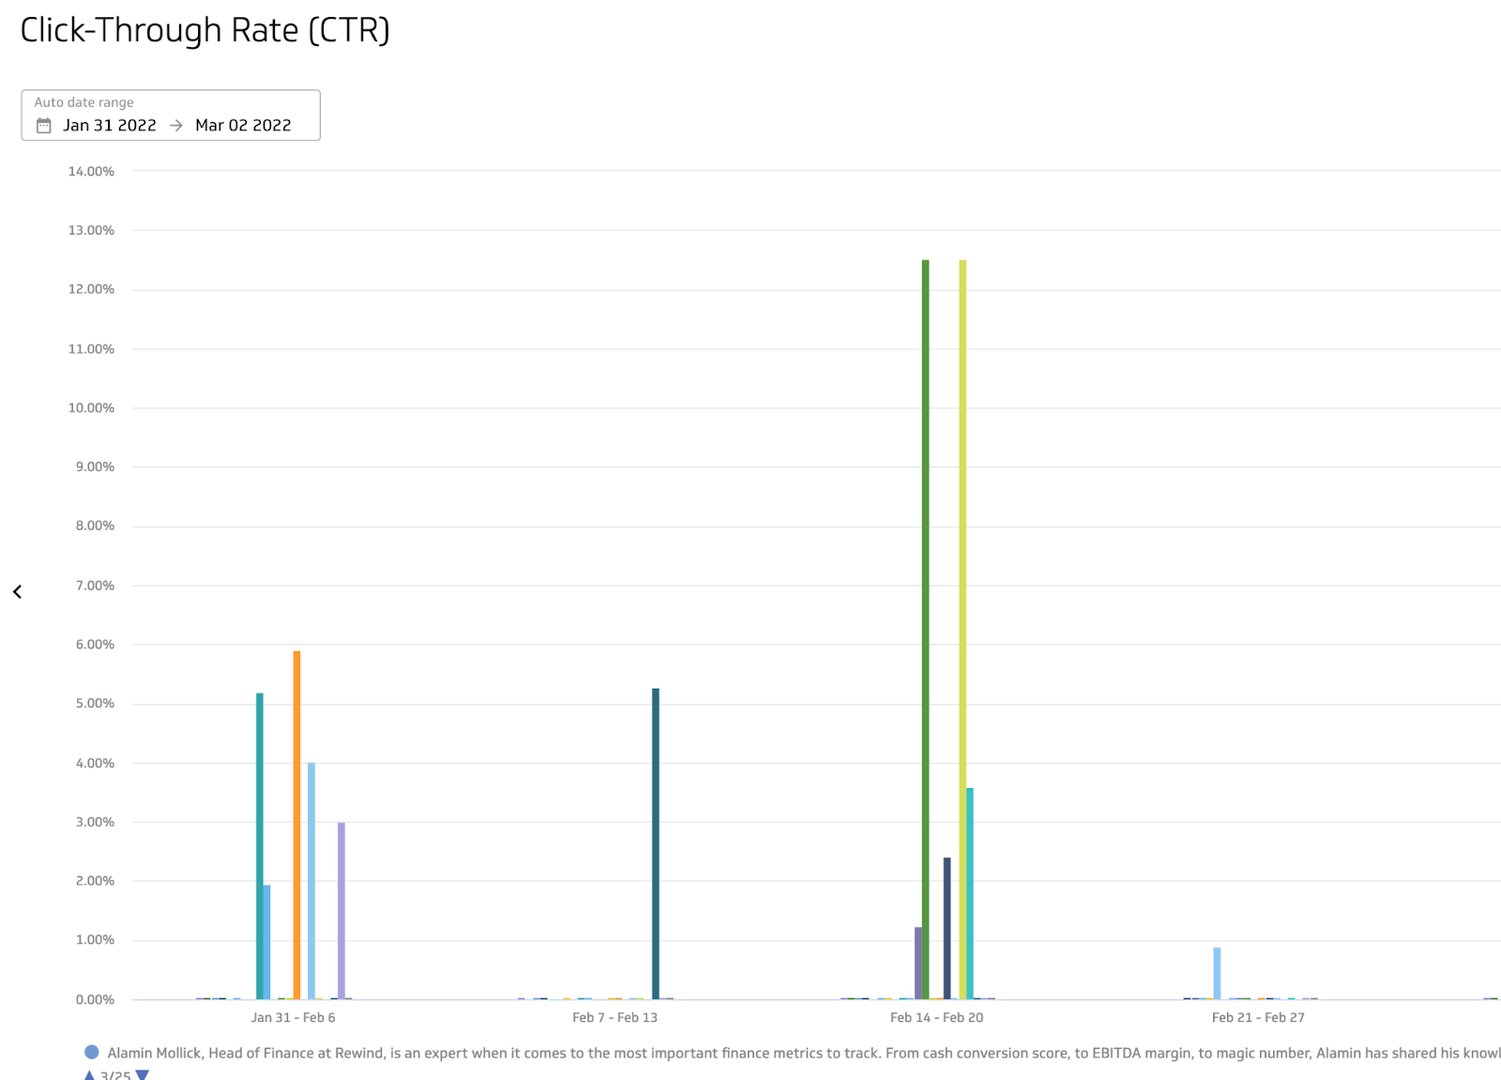
Click-Through Rate (CTR)
Click-Through Rate (CTR) is the percentage of clicks on your link that generate impressions.
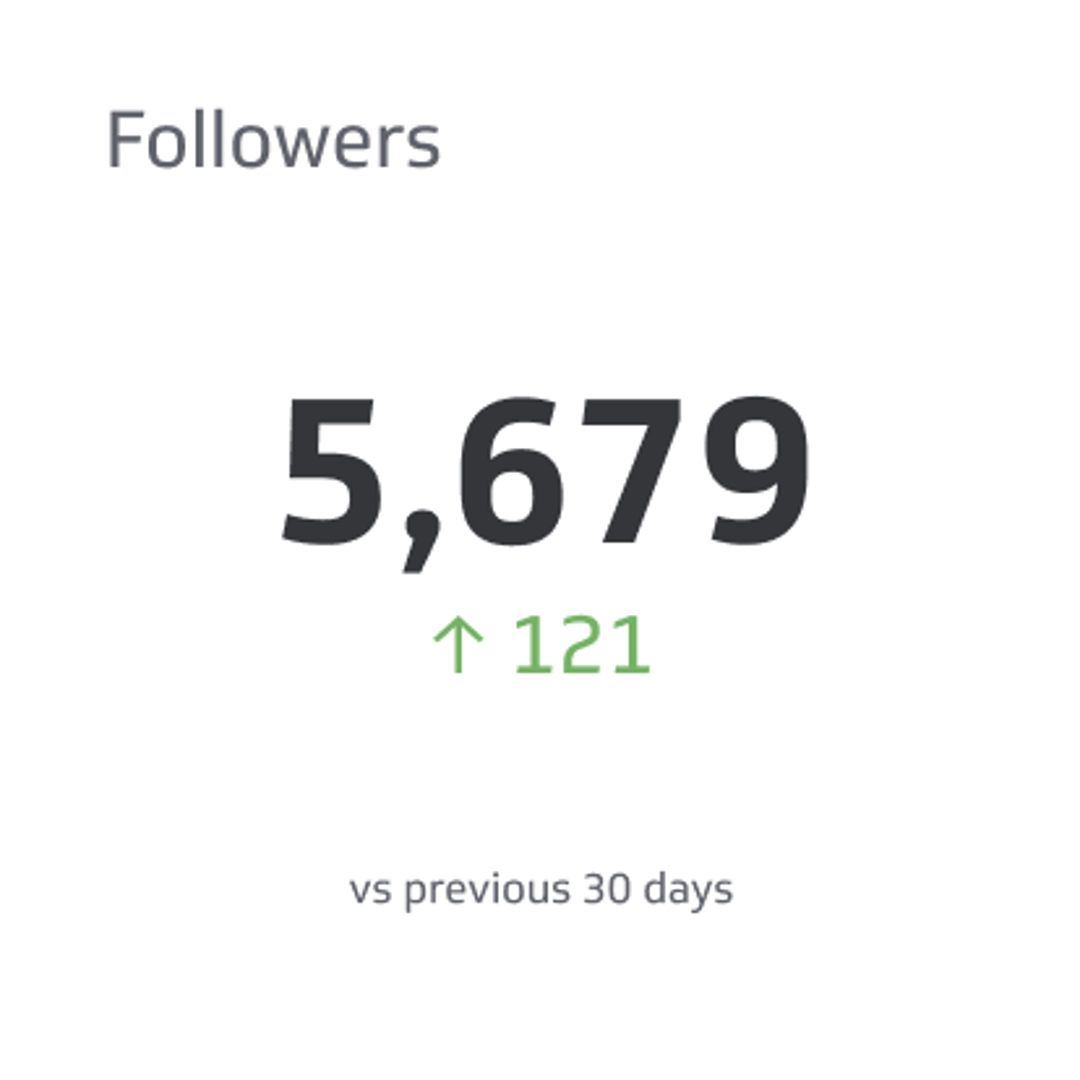
Followers
Followers is the number of users who have chosen to follow another user’s or company’s posts.
Website Clicks
Website Clicks counts the number of times people clicked on the link to your website on your social media profile page.
Page Likes
Page Likes counts the number of unique visitors who have liked your page.
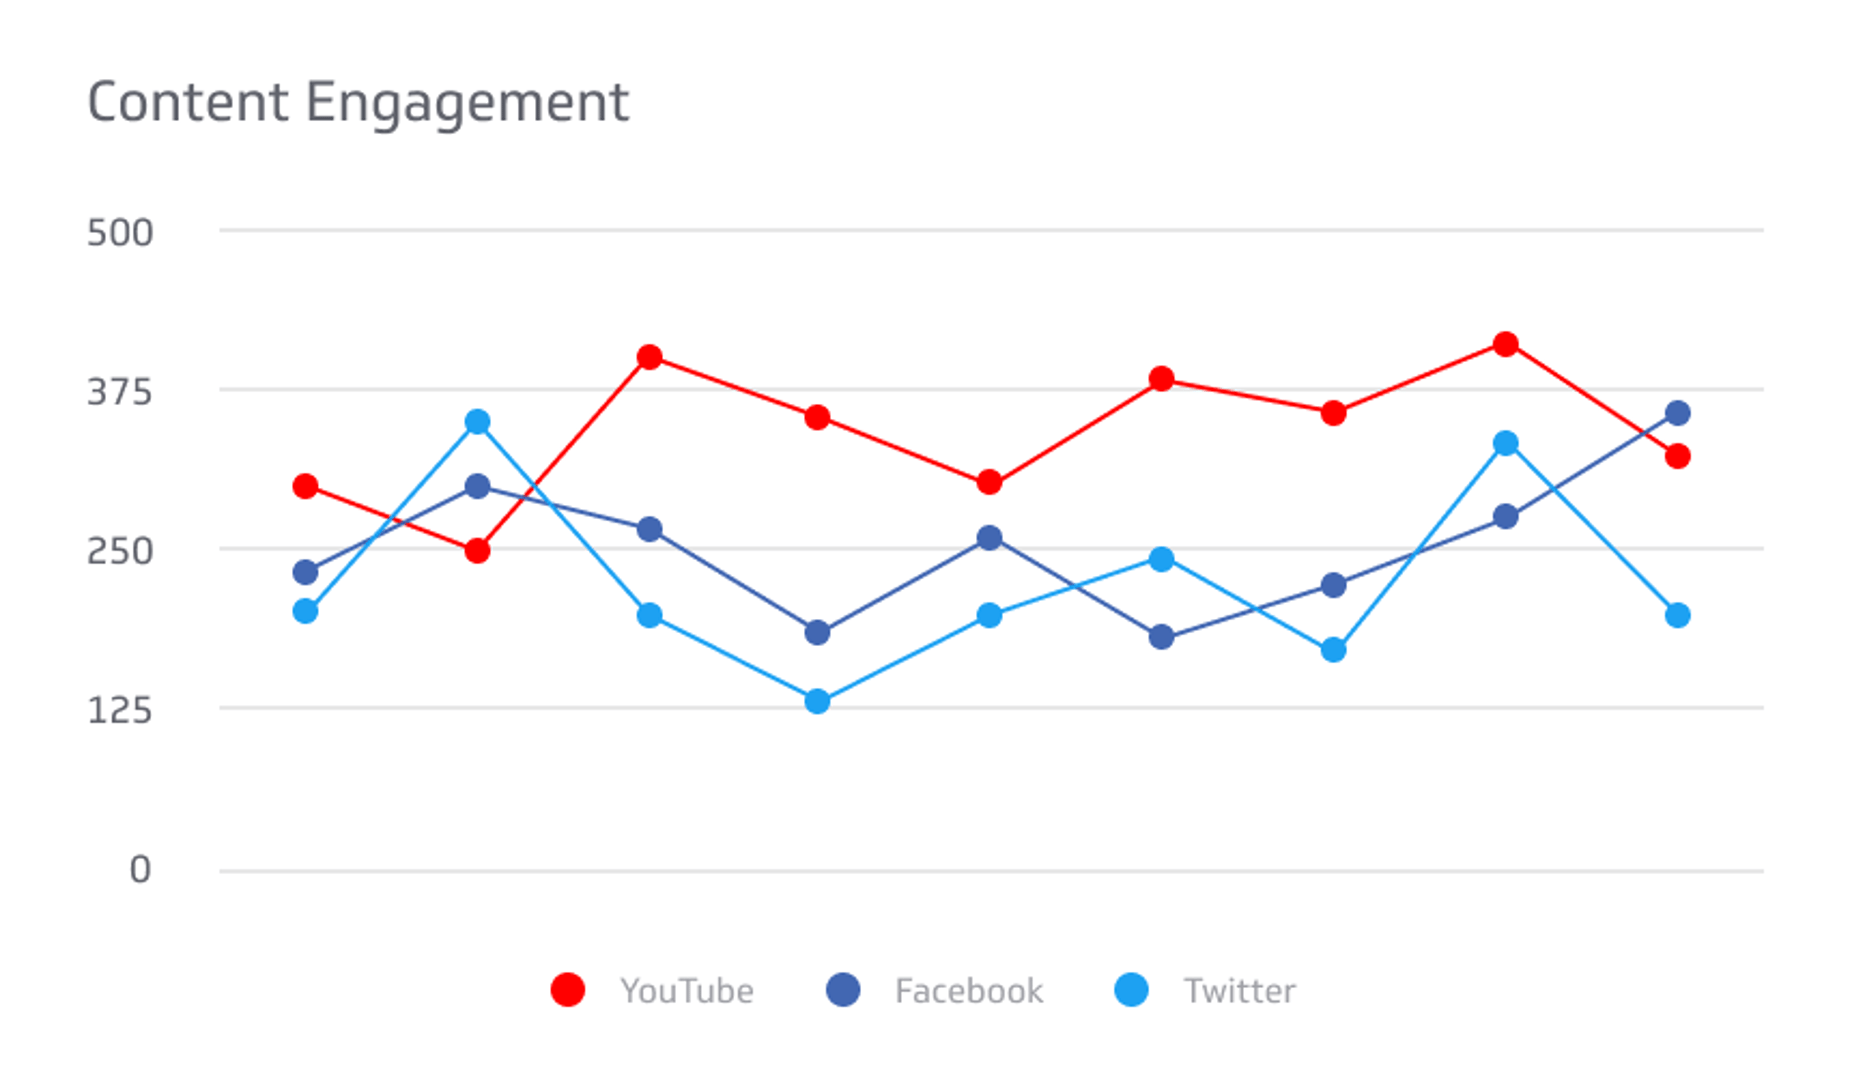
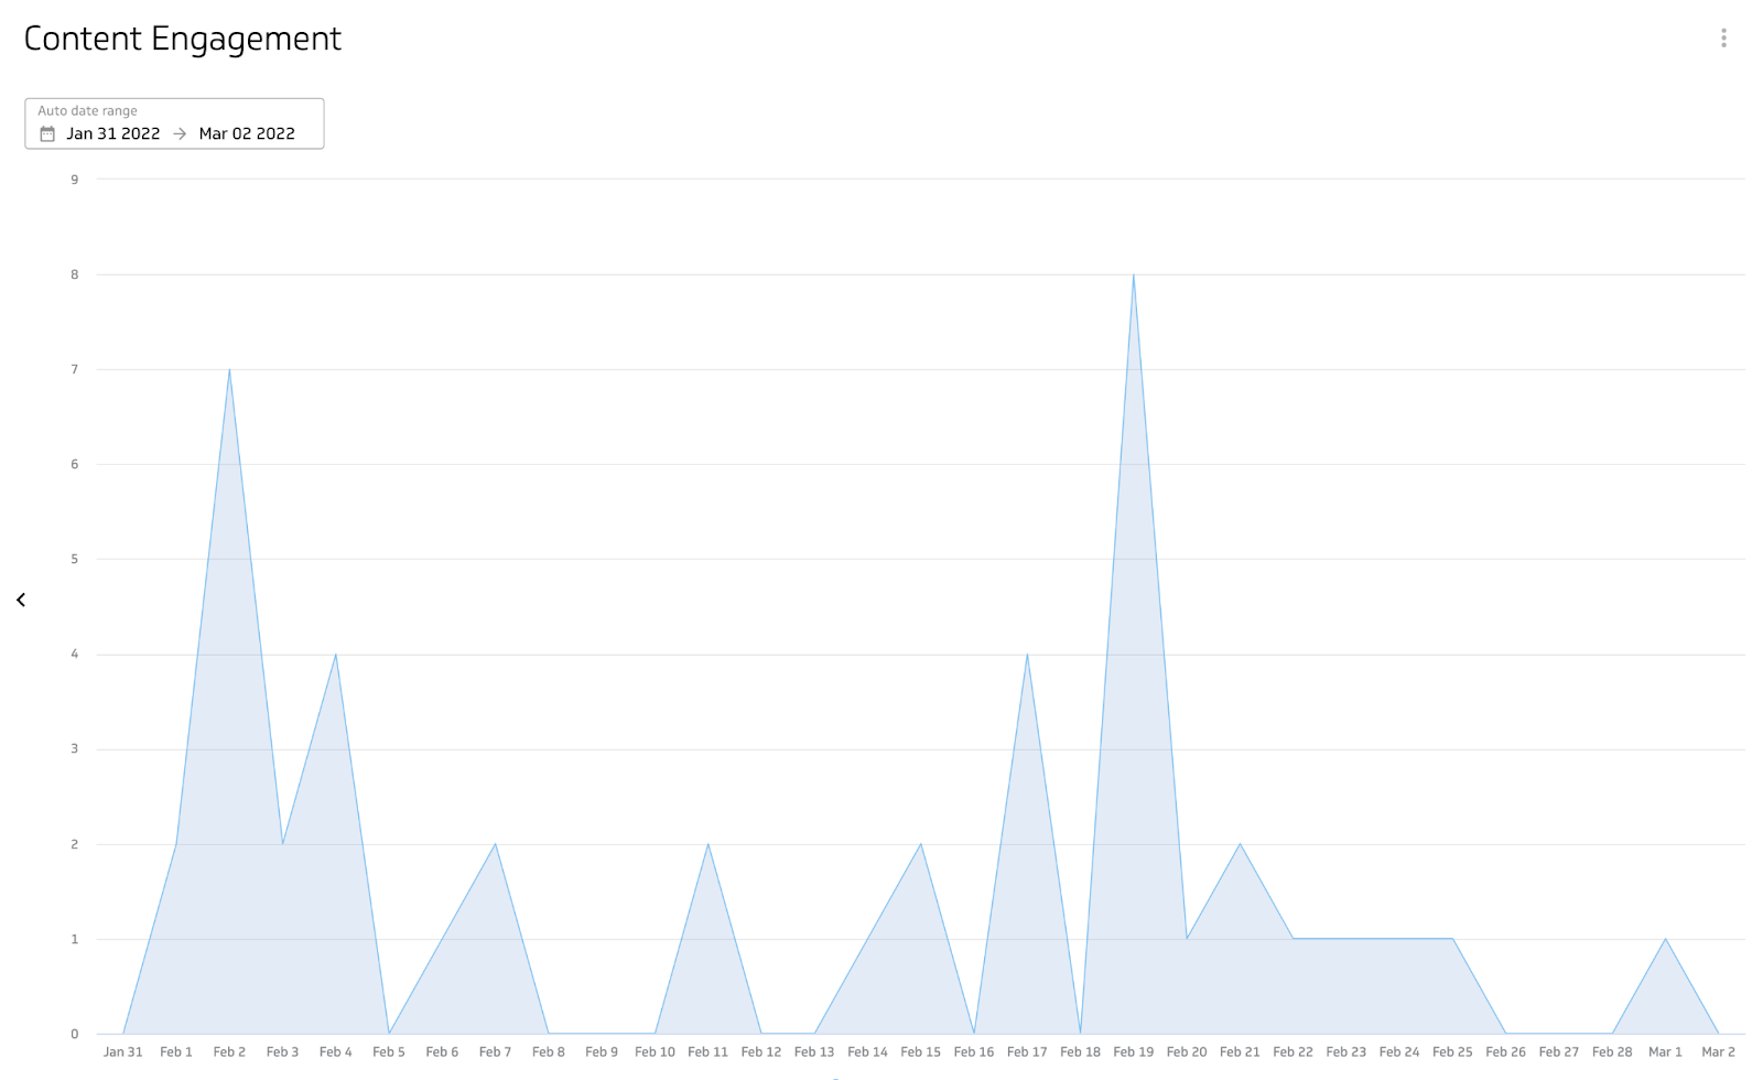
Content Engagement
Content Engagement measures all engagements resulting from content generated in a social media account.
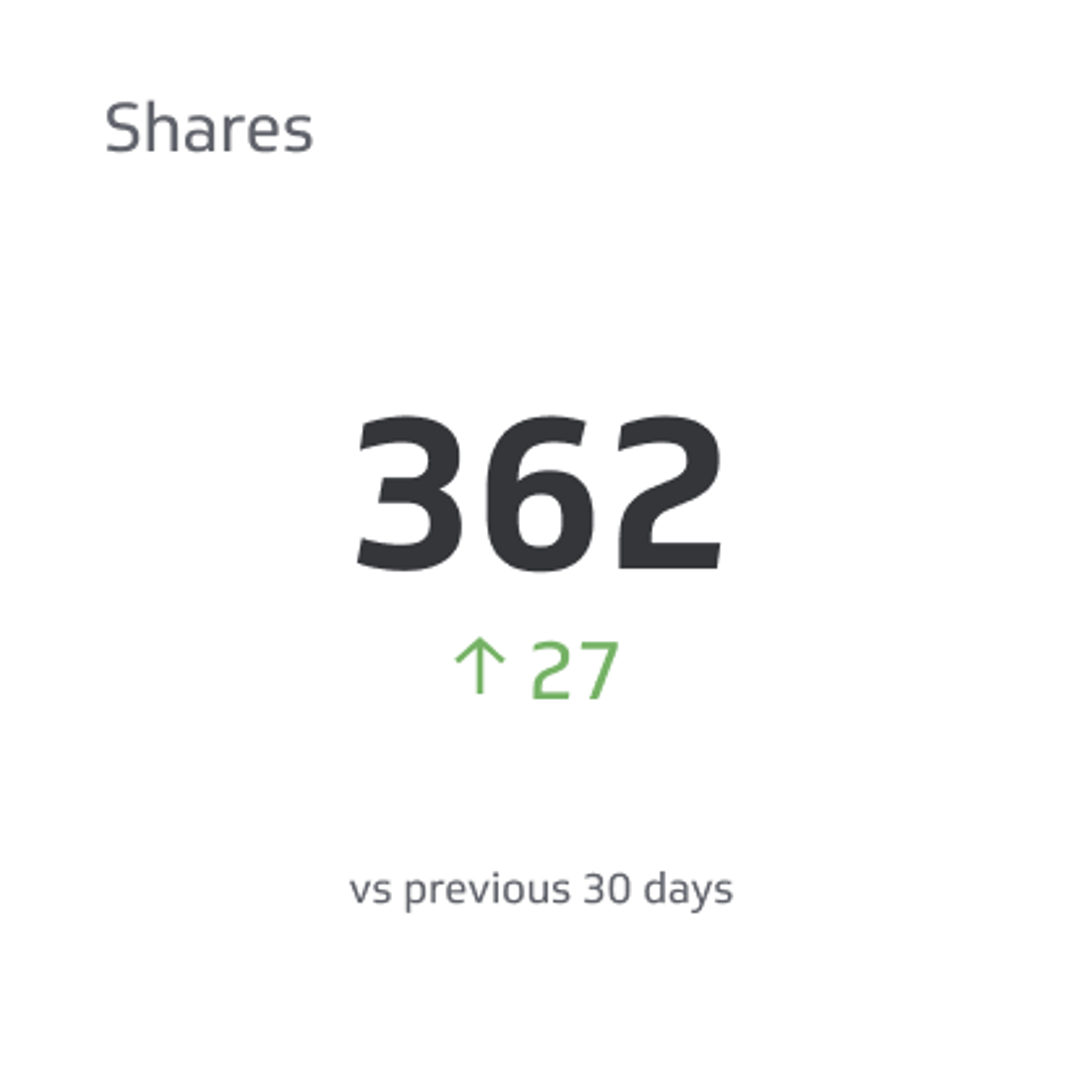
Shares
Shares are the total number of times a post was shared on social media platforms.
What type of visualizations work best on a LinkedIn dashboard?
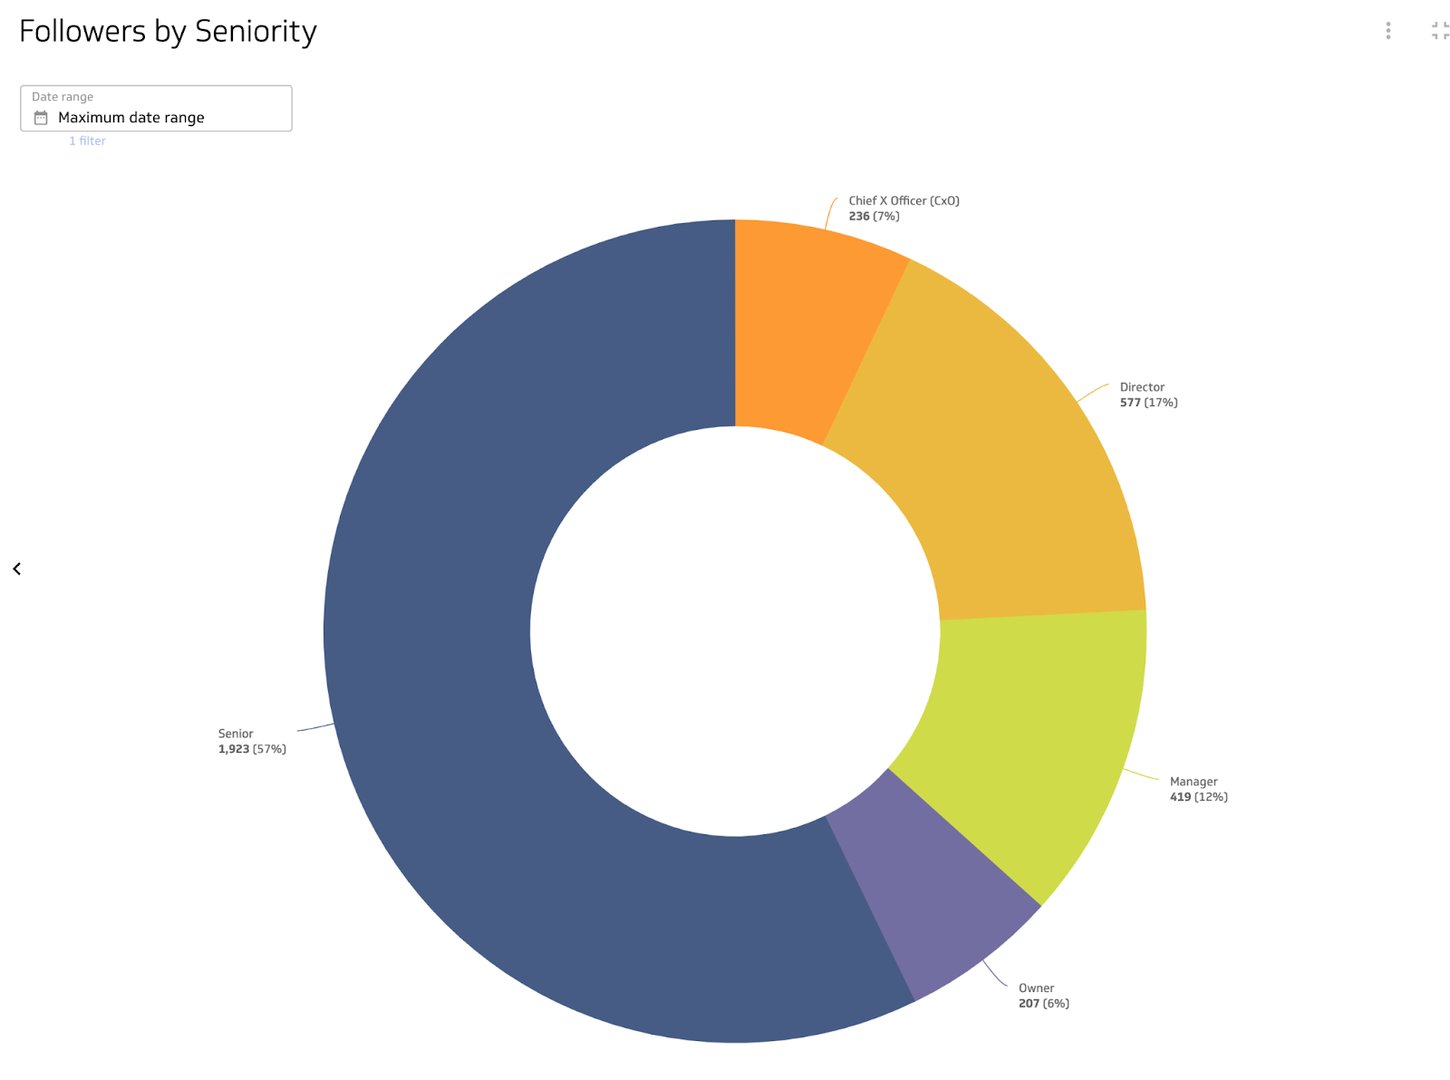
Creating a LinkedIn Pages dashboard will give you deeper insight into your followers and how they interact with the content you share. The majority of LinkedIn Pages metrics that you put on your dashboard can be segmented, whether it be by location, job function, or seniority, for instance.
Temporal data visualizations, like bar or line charts, are one of the most familiar data visualization types. Bar charts and line charts have an x- and y-axis so you can easily compare values over a period of time.
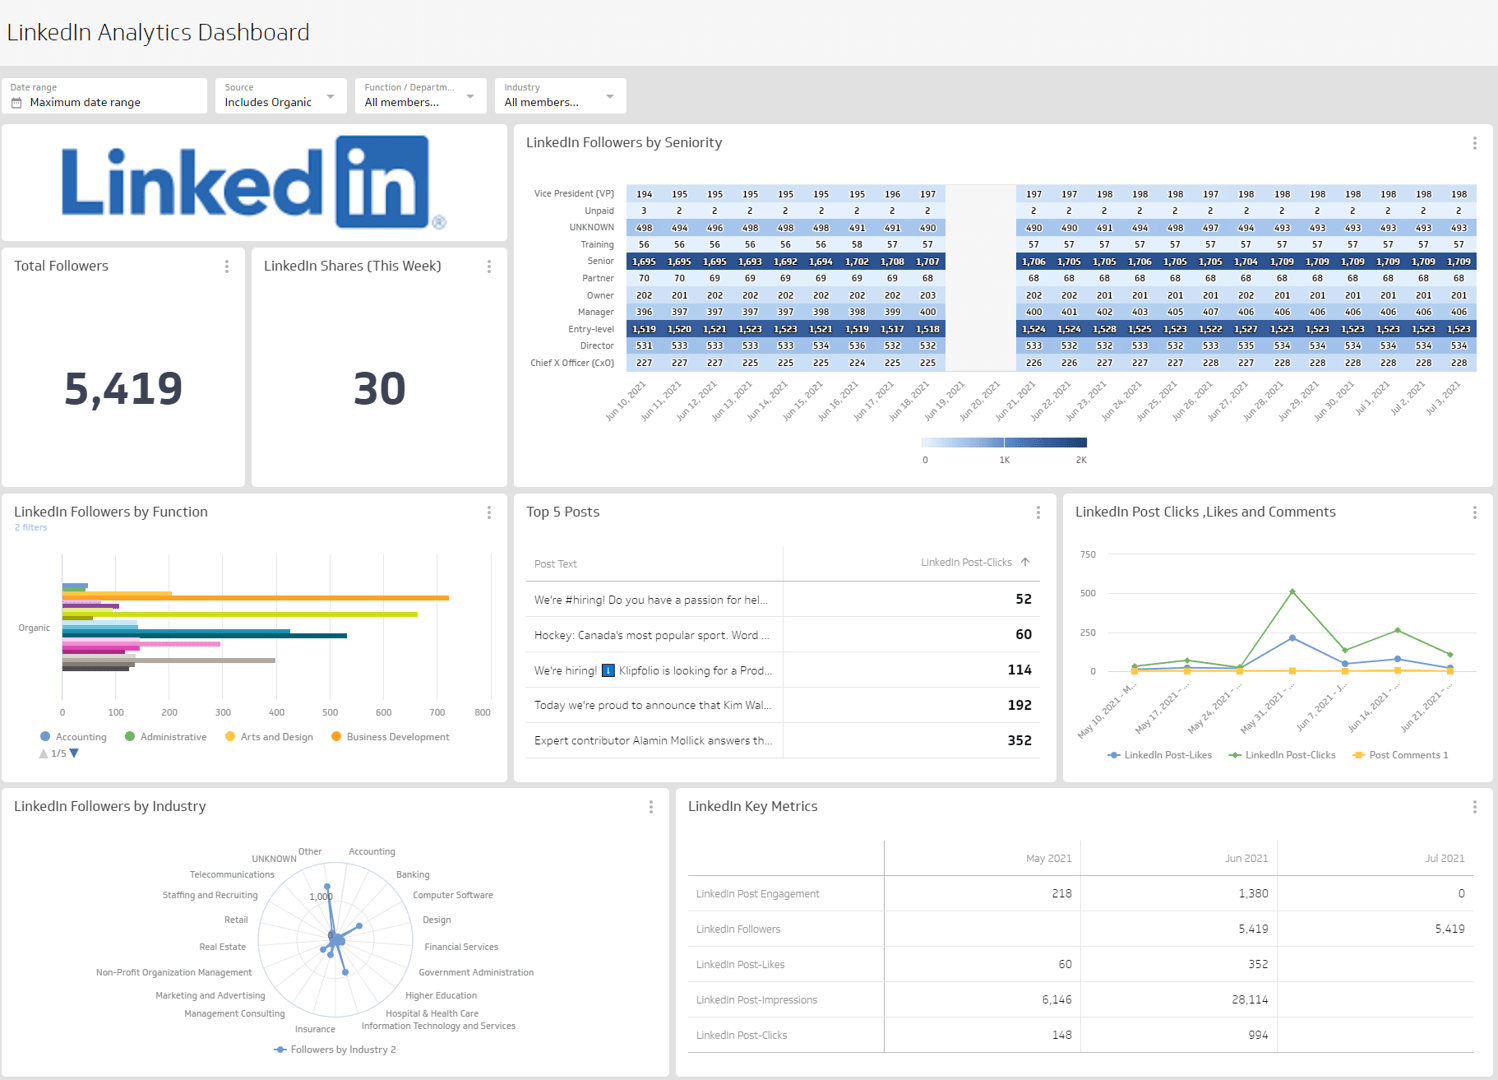
The LinkedIn followers metrics allows you to segment it in a number of ways: my company size, by country, by function, by industry, and by seniority. This is an excellent way to dig into who your followers are and if they align with your target audience.
With this information in mind, let’s look at the data visualizations that you can use on your LinkedIn dashboard.
Bar charts or line charts
Let’s say you want to see the click-through rate of your LinkedIn posts each week. You can choose a bar chart visualization, choose the time period to weekly, and see which posts had the highest click-through rate.
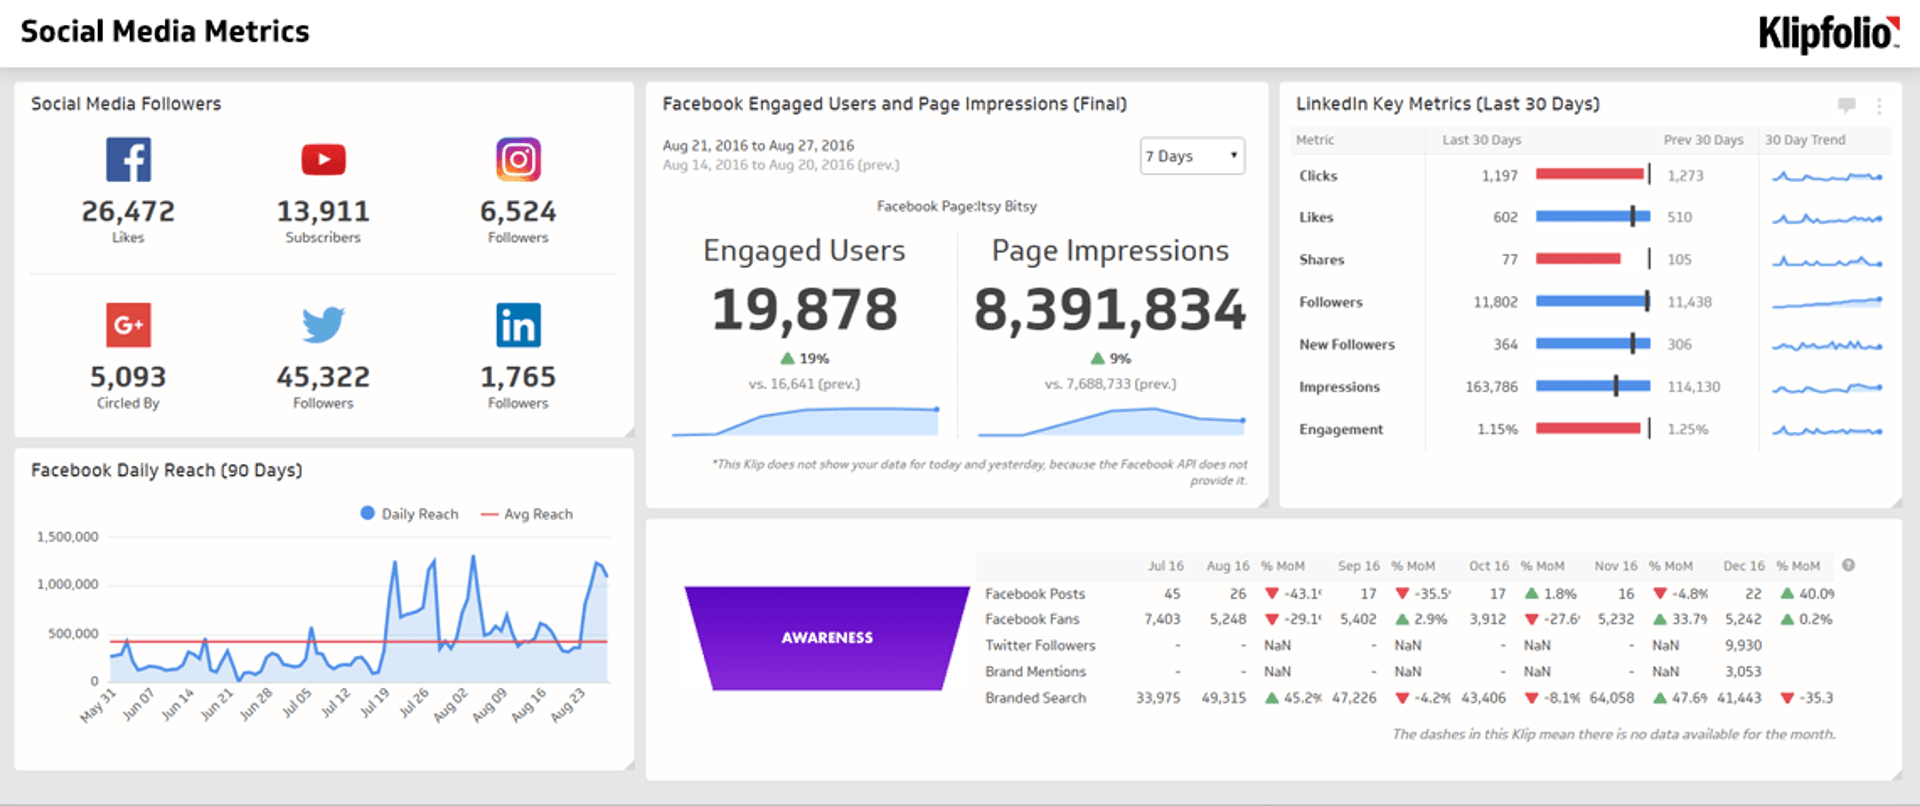
If you want to get a holistic view of your overall content engagement, you can use a line chart. This visualization will allow you to easily identify any trends with a glance.
Summary charts
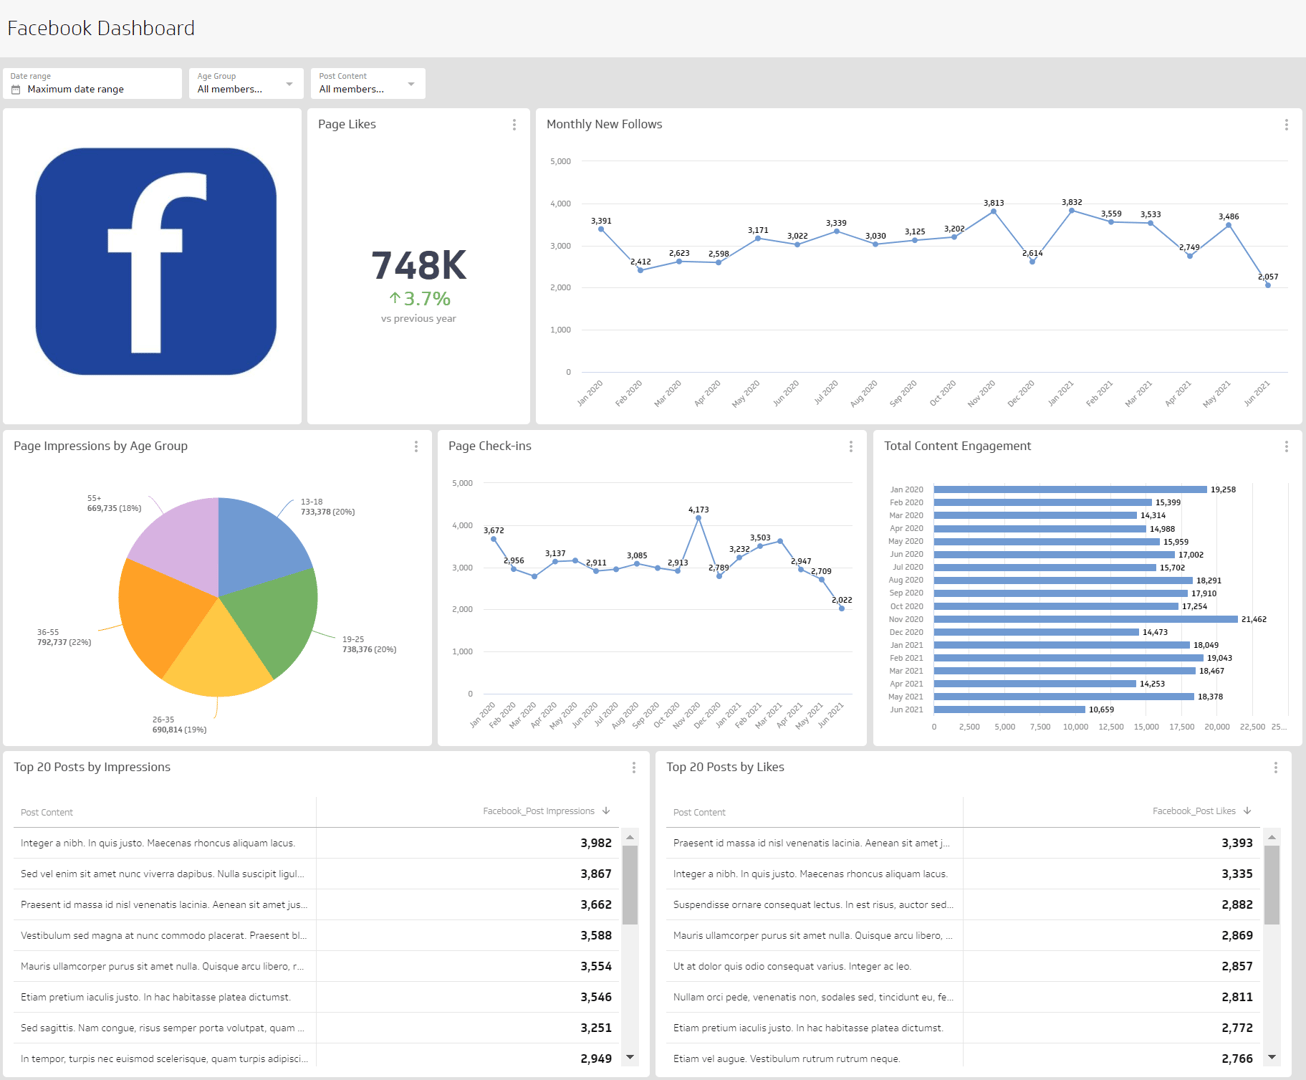
Summary charts display one numeric value and have the capability to add a comparison value. On a LinkedIn dashboard, a summary chart is an excellent visualization to display your total number of followers or your post impressions for a specific time period. When you use a summary chart with a comparison value (either numeric or percentage), you can easily see growth trends.
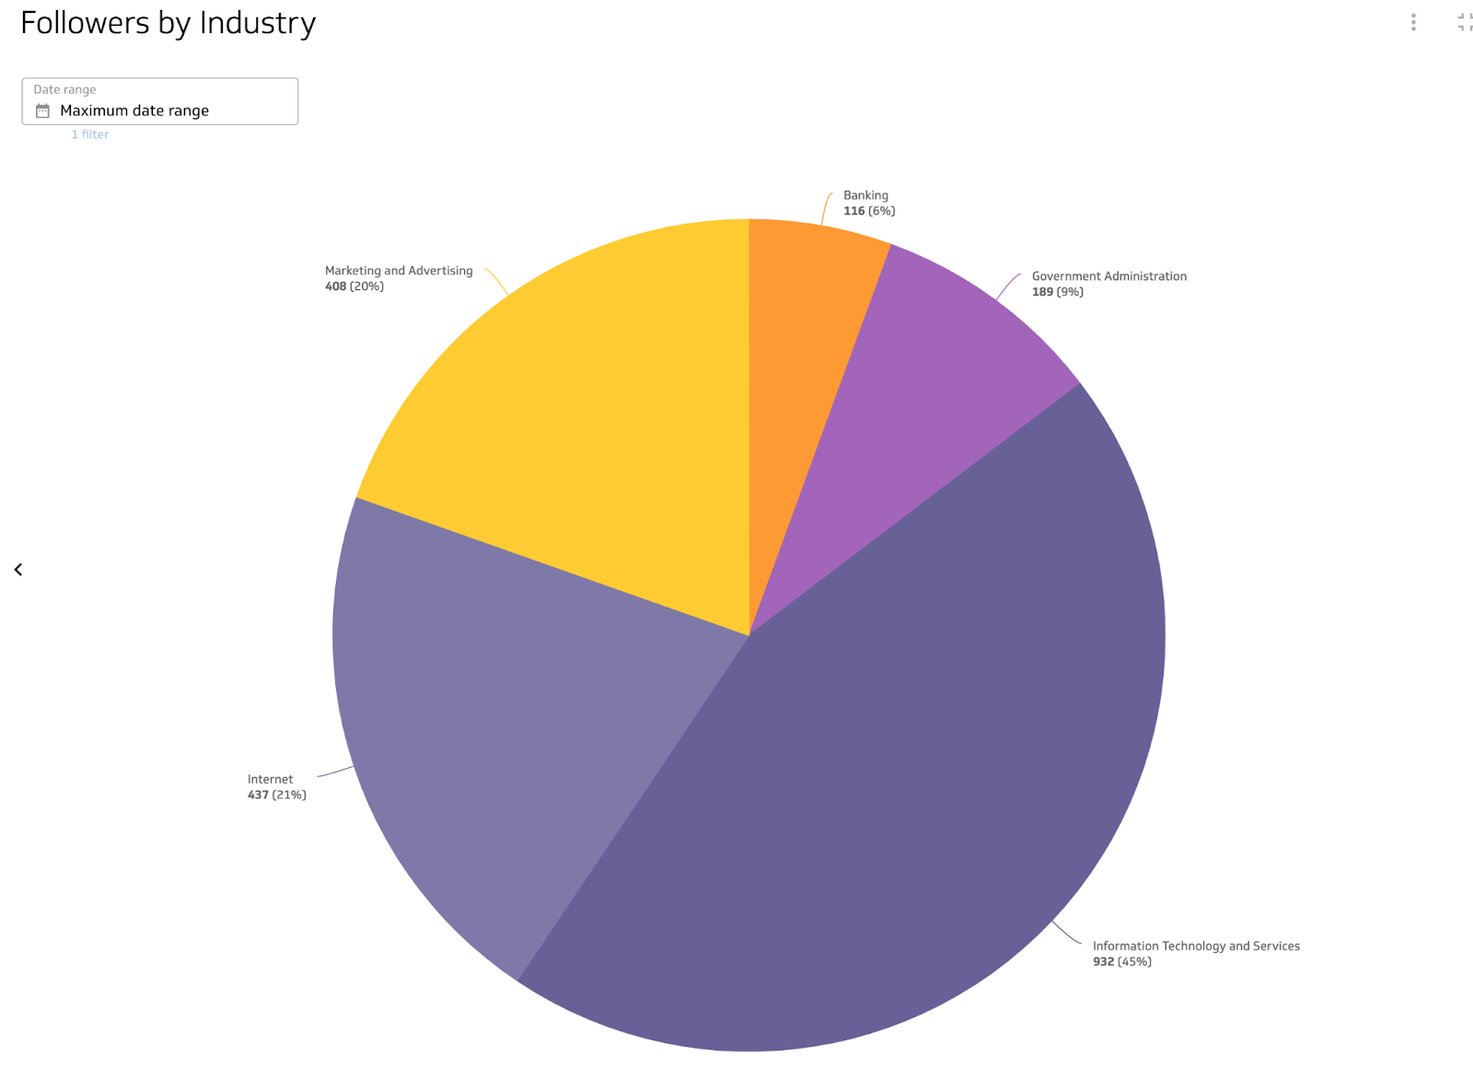
Pie charts
Pie or donut charts are an excellent way to break down parts of a whole. For example, if you want to see the breakdown of the industries that your followers are in, you can use a pie chart.
Benefits of a LinkedIn dashboard
Putting all of your LinkedIn data on a dashboard gives you a single source to reference your performance. When you put your LinkedIn metrics on a PowerMetrics dashboard, you have the power and flexibility to adjust date ranges, pick a data visualization to display your metric and share the information with your team. PowerMetrics allows you to add users and share your dashboards and social metrics so you and your team can always be aligned on your organic social media performance.
Dashboard inspiration for LinkedIn
How do you know which LinkedIn metrics to track? Here are a few LInkedIn dashboards that you can build in PowerMetrics to focus on specific areas like your followers, your performance, or your engagement.
Track your overall performance on a LinkedIn dashboard
Build a LinkedIn Pages dashboard that tracks all of your activity on LinkedIn. This dashboard will answer questions like:
- What is the click-through rate on my LinkedIn content?
- How many followers do I have and what is the company size breakdown?
- How many post impressions are from content I share versus user generated content?
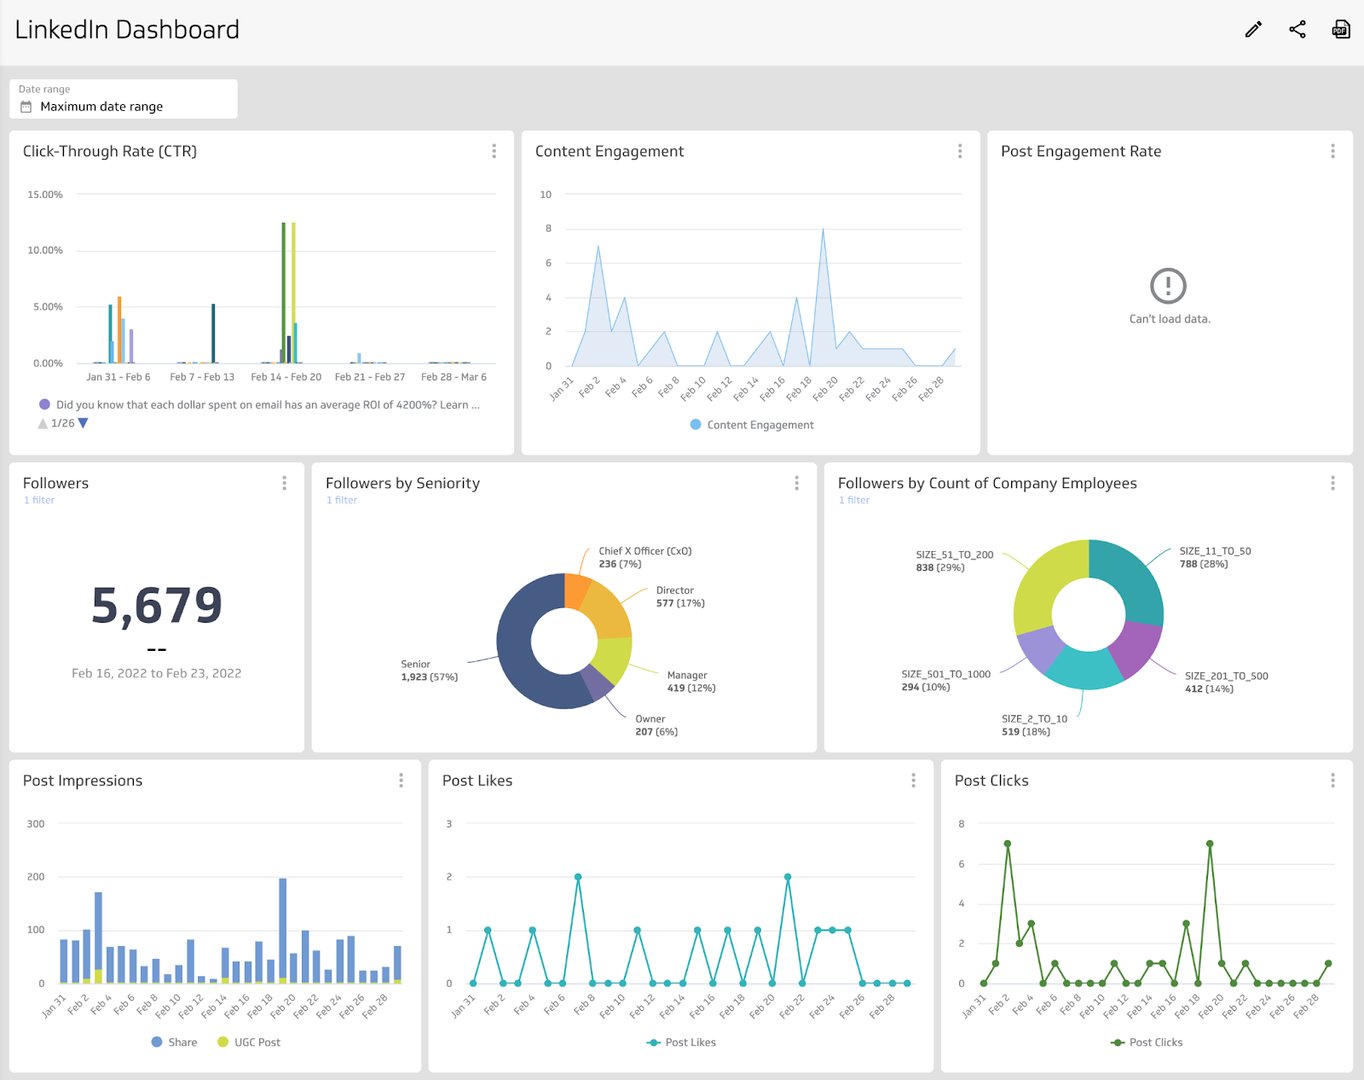
Tracking your LinkedIn metrics will help you answer these questions and succeed with data.
Track your follower demographics with your LinkedIn content
LinkedIn allows you to dig deep into your follower demographics like company size, industry, country, and seniority. When you build a follower dashboard you can answer questions like:
- Where are my followers located?
- Does the company size and industry of my followers align with my target audience?
- Is my follower growth on an upwards trajectory or are there patterns in my follower growth?
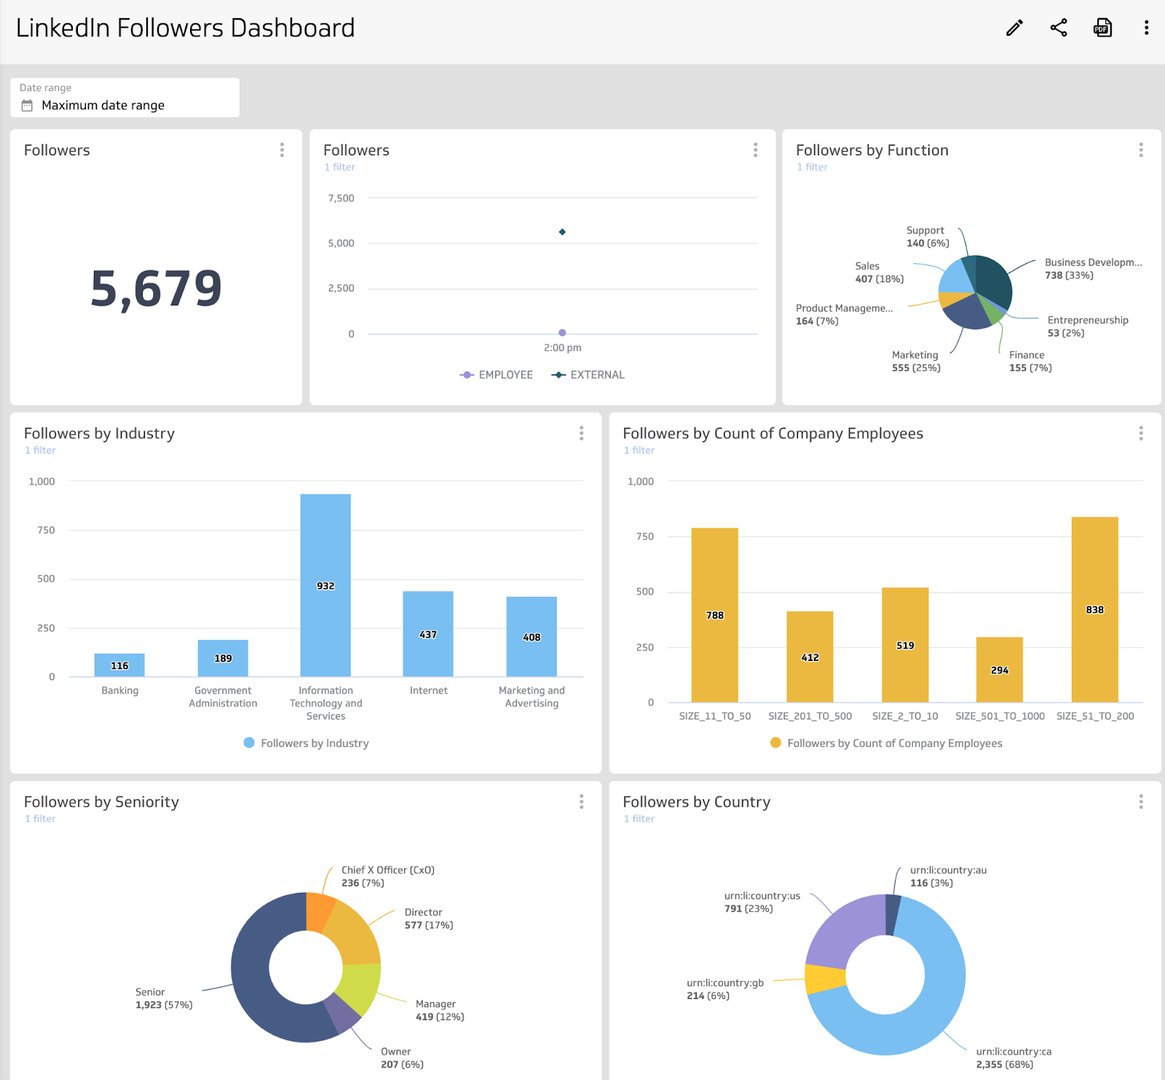
Tracking your follower growth will help you align your content to your current audience on LinkedIn and identify any opportunities to find and nurture your target audience.
Track your engagement for your LinkedIn content
Are people engaging with the content you post on LinkedIn? Sometimes social media can feel a bit like yelling into a void, which is why it’s key to track Linkedin engagement metrics. When you build a LinkedIn engagement dashboard you can answer questions like:
- How are people engaging with my posts? Are they liking or commenting?
- What kind of content (my content versus user-generated content) performs better?
- Do we have consistent content engagement or are there noticeable trends and differences?
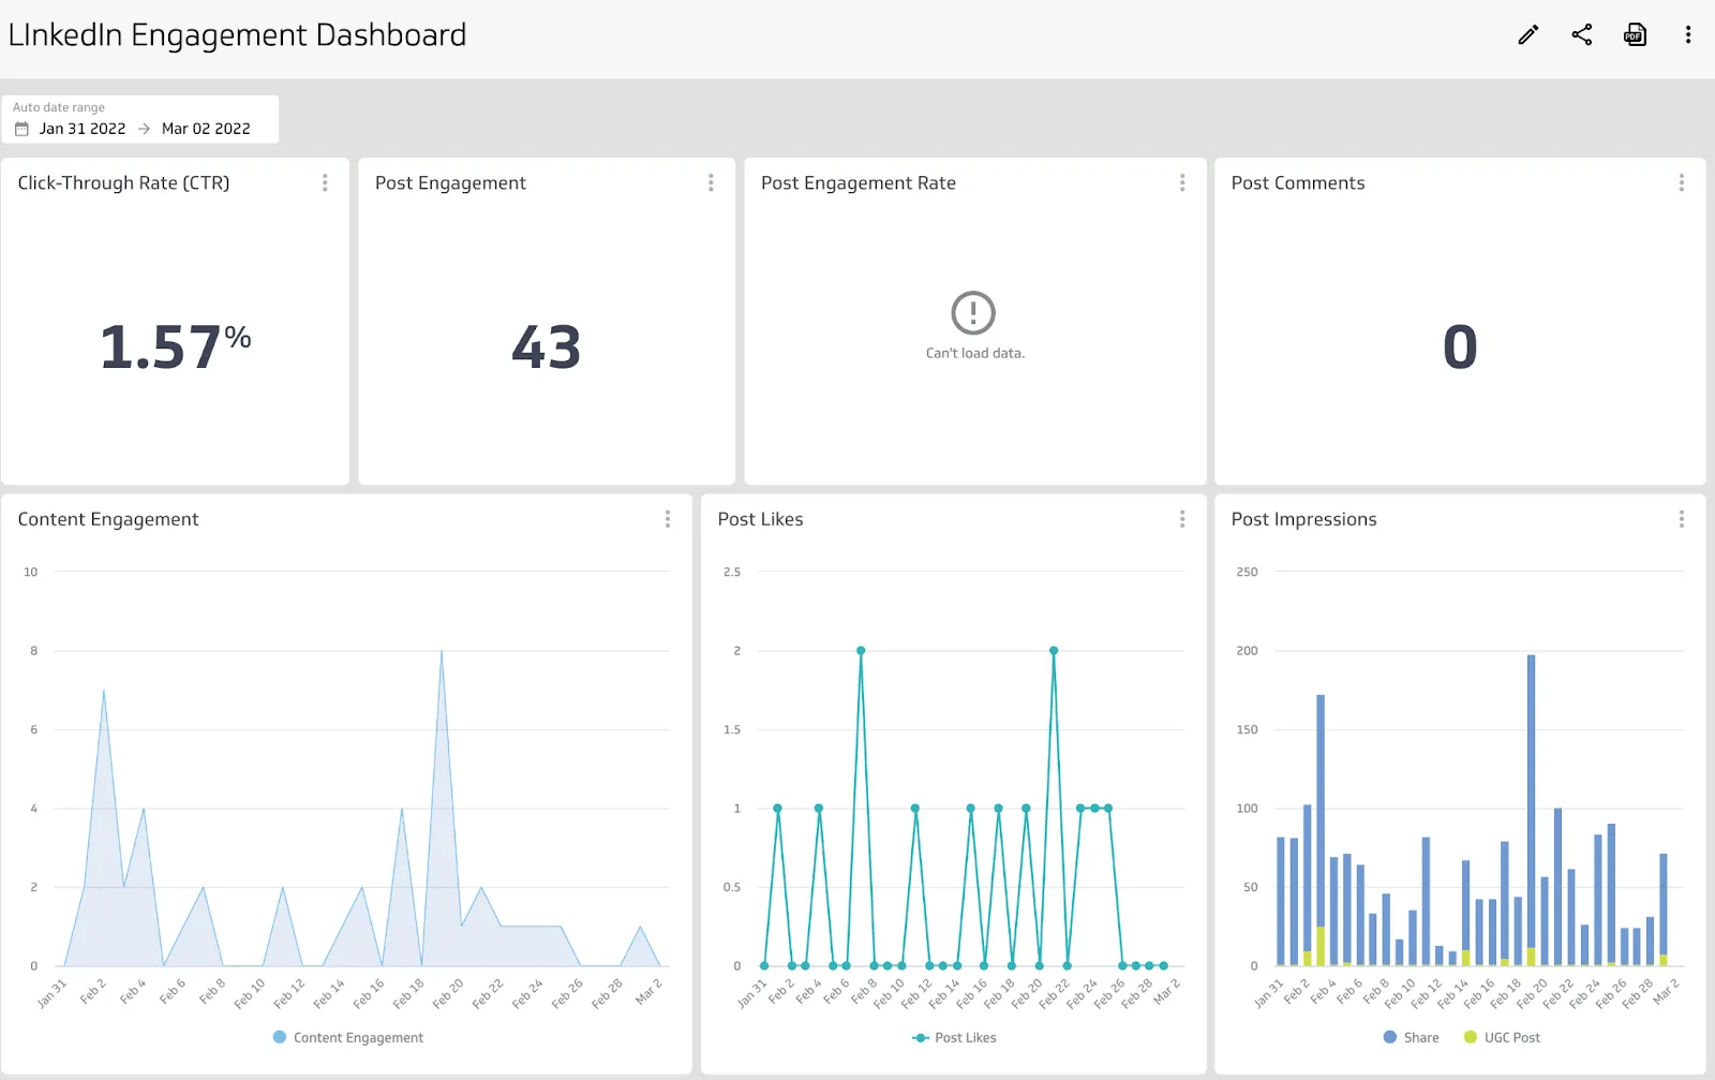
Tracking your engagement metrics will help you answer those questions and understand what type of content receives the most attention. These metrics will help you identify trends in the content you share (for example, does user-generated content perform better than our content?) and adjust your social media marketing strategy accordingly.
What does success look like with a LinkedIn dashboard?
A LinkedIn dashboard will help you share the metrics that matter most to you and your team. Since LinkedIn Pages is often linked to a personal LinkedIn account, building a PowerMetrics dashboard allows you to easily share your performance data with other stakeholders. Keep in mind, when building and designing a dashboard, everyone should be able to understand the data that is being presented. Clear visualizations that pull out the key insights makes for easy interpretation and answers.
LinkedIn is a part of your overall social media strategy. The data displayed on your dashboard can be a key part in the optimization or adjustment to how you approach LinkedIn, and can be used to identify the trends in engagement and behaviour with your audience.
Related Dashboards
View all dashboards