- Department Solutions
- Klipfolio for Digital Advertising
The control you want, the data you need.
All your digital advertising metrics in one reporting tool
“I love that the team doesn’t have to spend time downloading and manipulating CSV files anymore. Klipfolio’s continued commitment to releasing new integrations in addition to extensibility with custom data sources makes it the obvious choice for all of our dashboarding needs.”

Mike King
Managing Director at iPullRank
Build custom advertising dashboards for you and your clients
As a Search Engine Marketer (SEM) or Pay Per Click (PPC) Marketing Specialist, you are responsible for the creation and execution of paid advertising campaigns to help drive the top of your marketing funnel.
You understand the importance of driving conversions through paid channels like: AdWords, Display, Search, Social Media Ads and more. Your goal is to convert customers at the lowest Customer Acquisition Cost (CAC) with the highest Return on Advertising Spend (ROAS) and to keep your Search Impression Share Lost low.
The success of your organization is dependent on your ability to deliver quality inbound leads. But how do you prove your digital advertising campaigns are working? If you're stuck creating manual reports on a daily, weekly, or monthly basis Klipfolio can help.
Pull in data from your paid channels, Google Analytics, or Google Sheets to create custom digital advertising dashboards that you can easily share with your organization or clients. You can also combine data from multiple services to build customized metrics and KPIs, such as ad frequency, that tell the story of your digital ad performance.
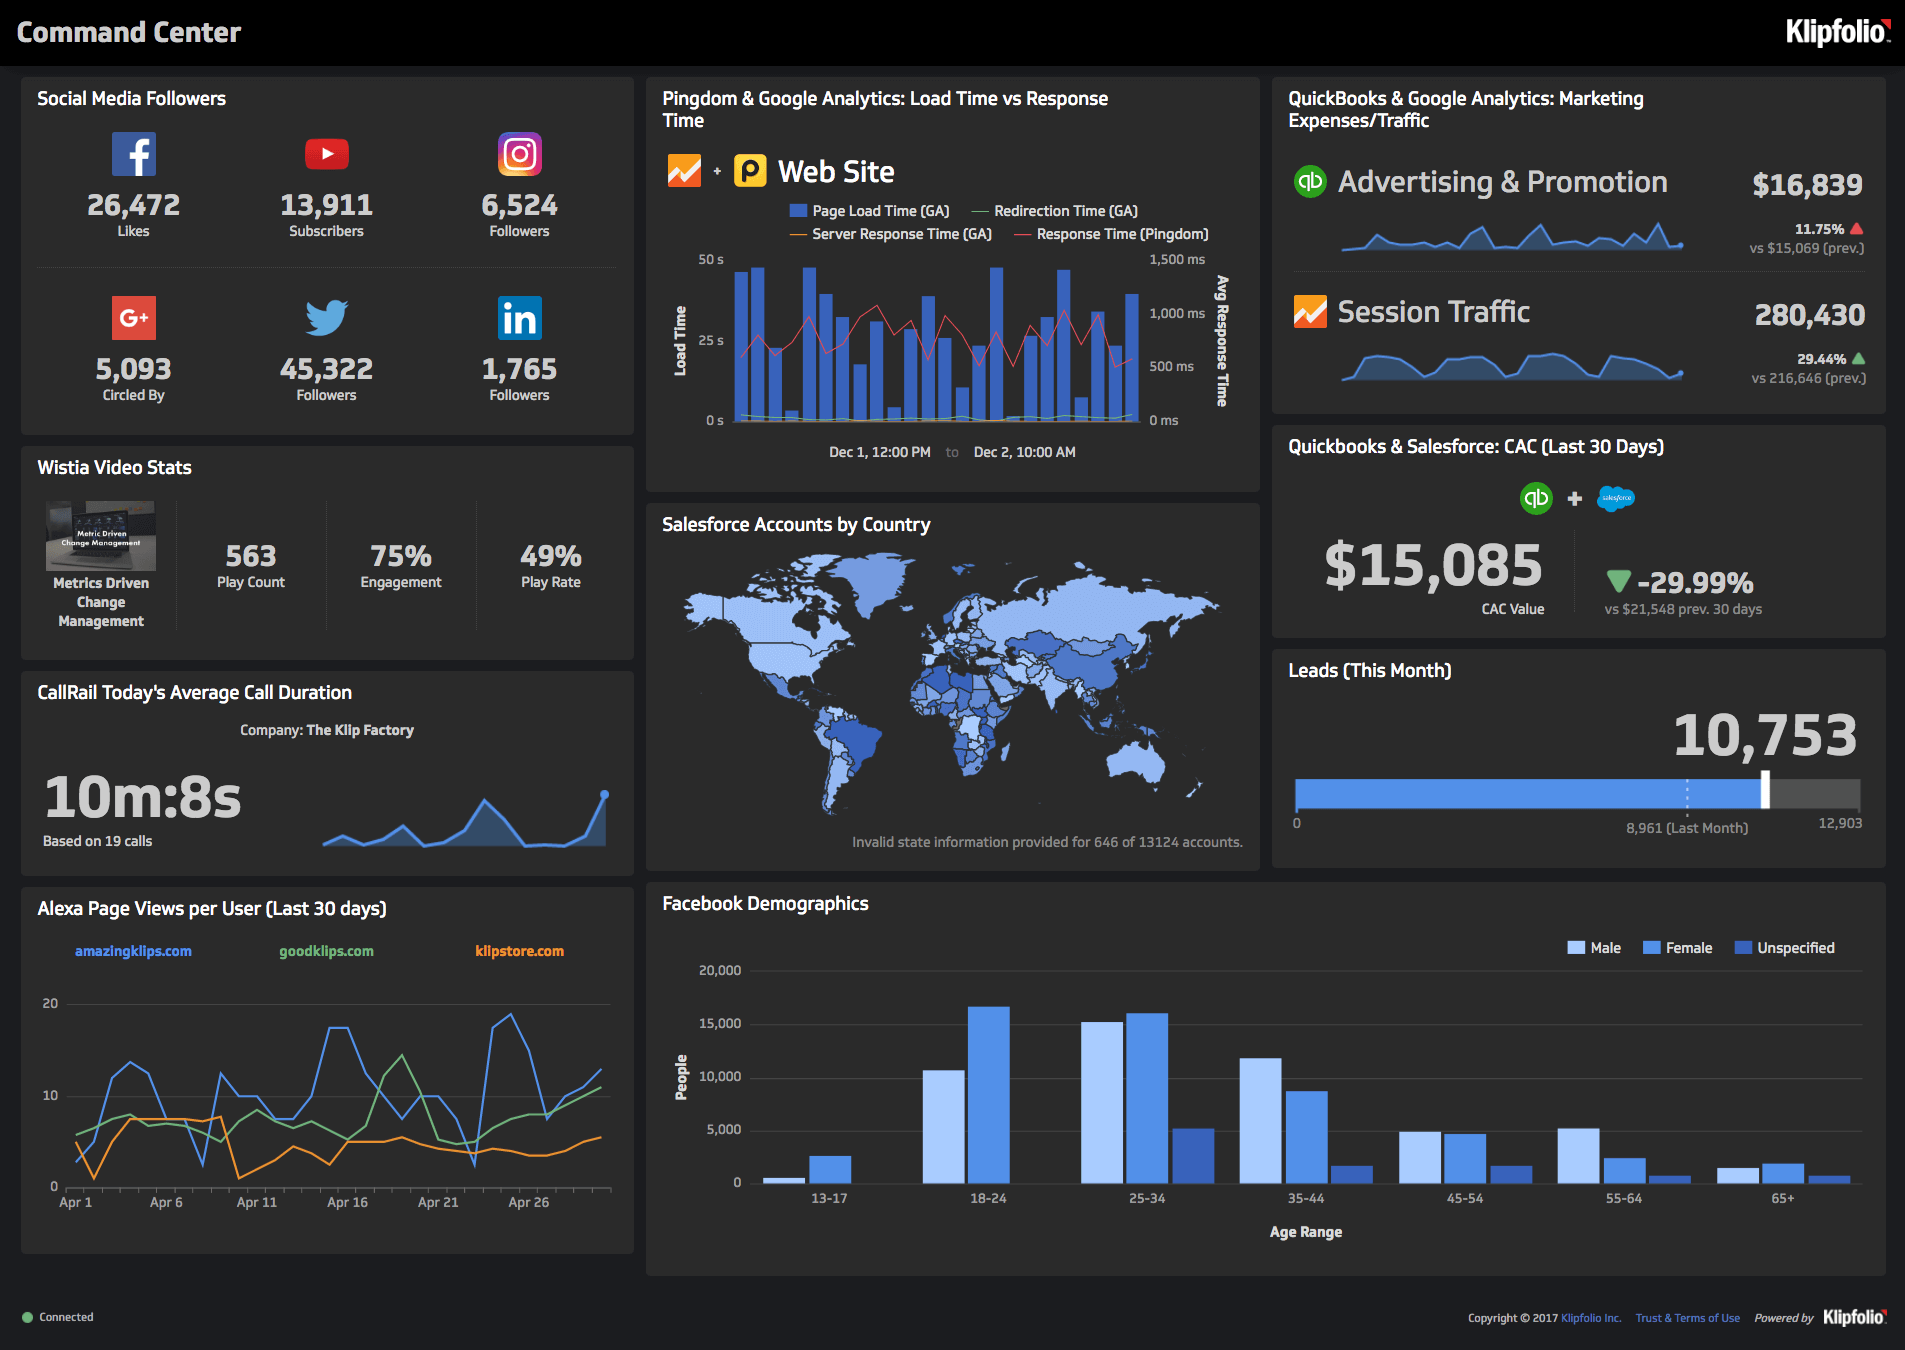
Digital advertising dashboard examples
Curious to see what you can track in Klipfolio? Here are just a few examples of digital advertising dashboards that help you stay on top of your performance and easily share results with your team. View the live dashboard examples to get a better look.
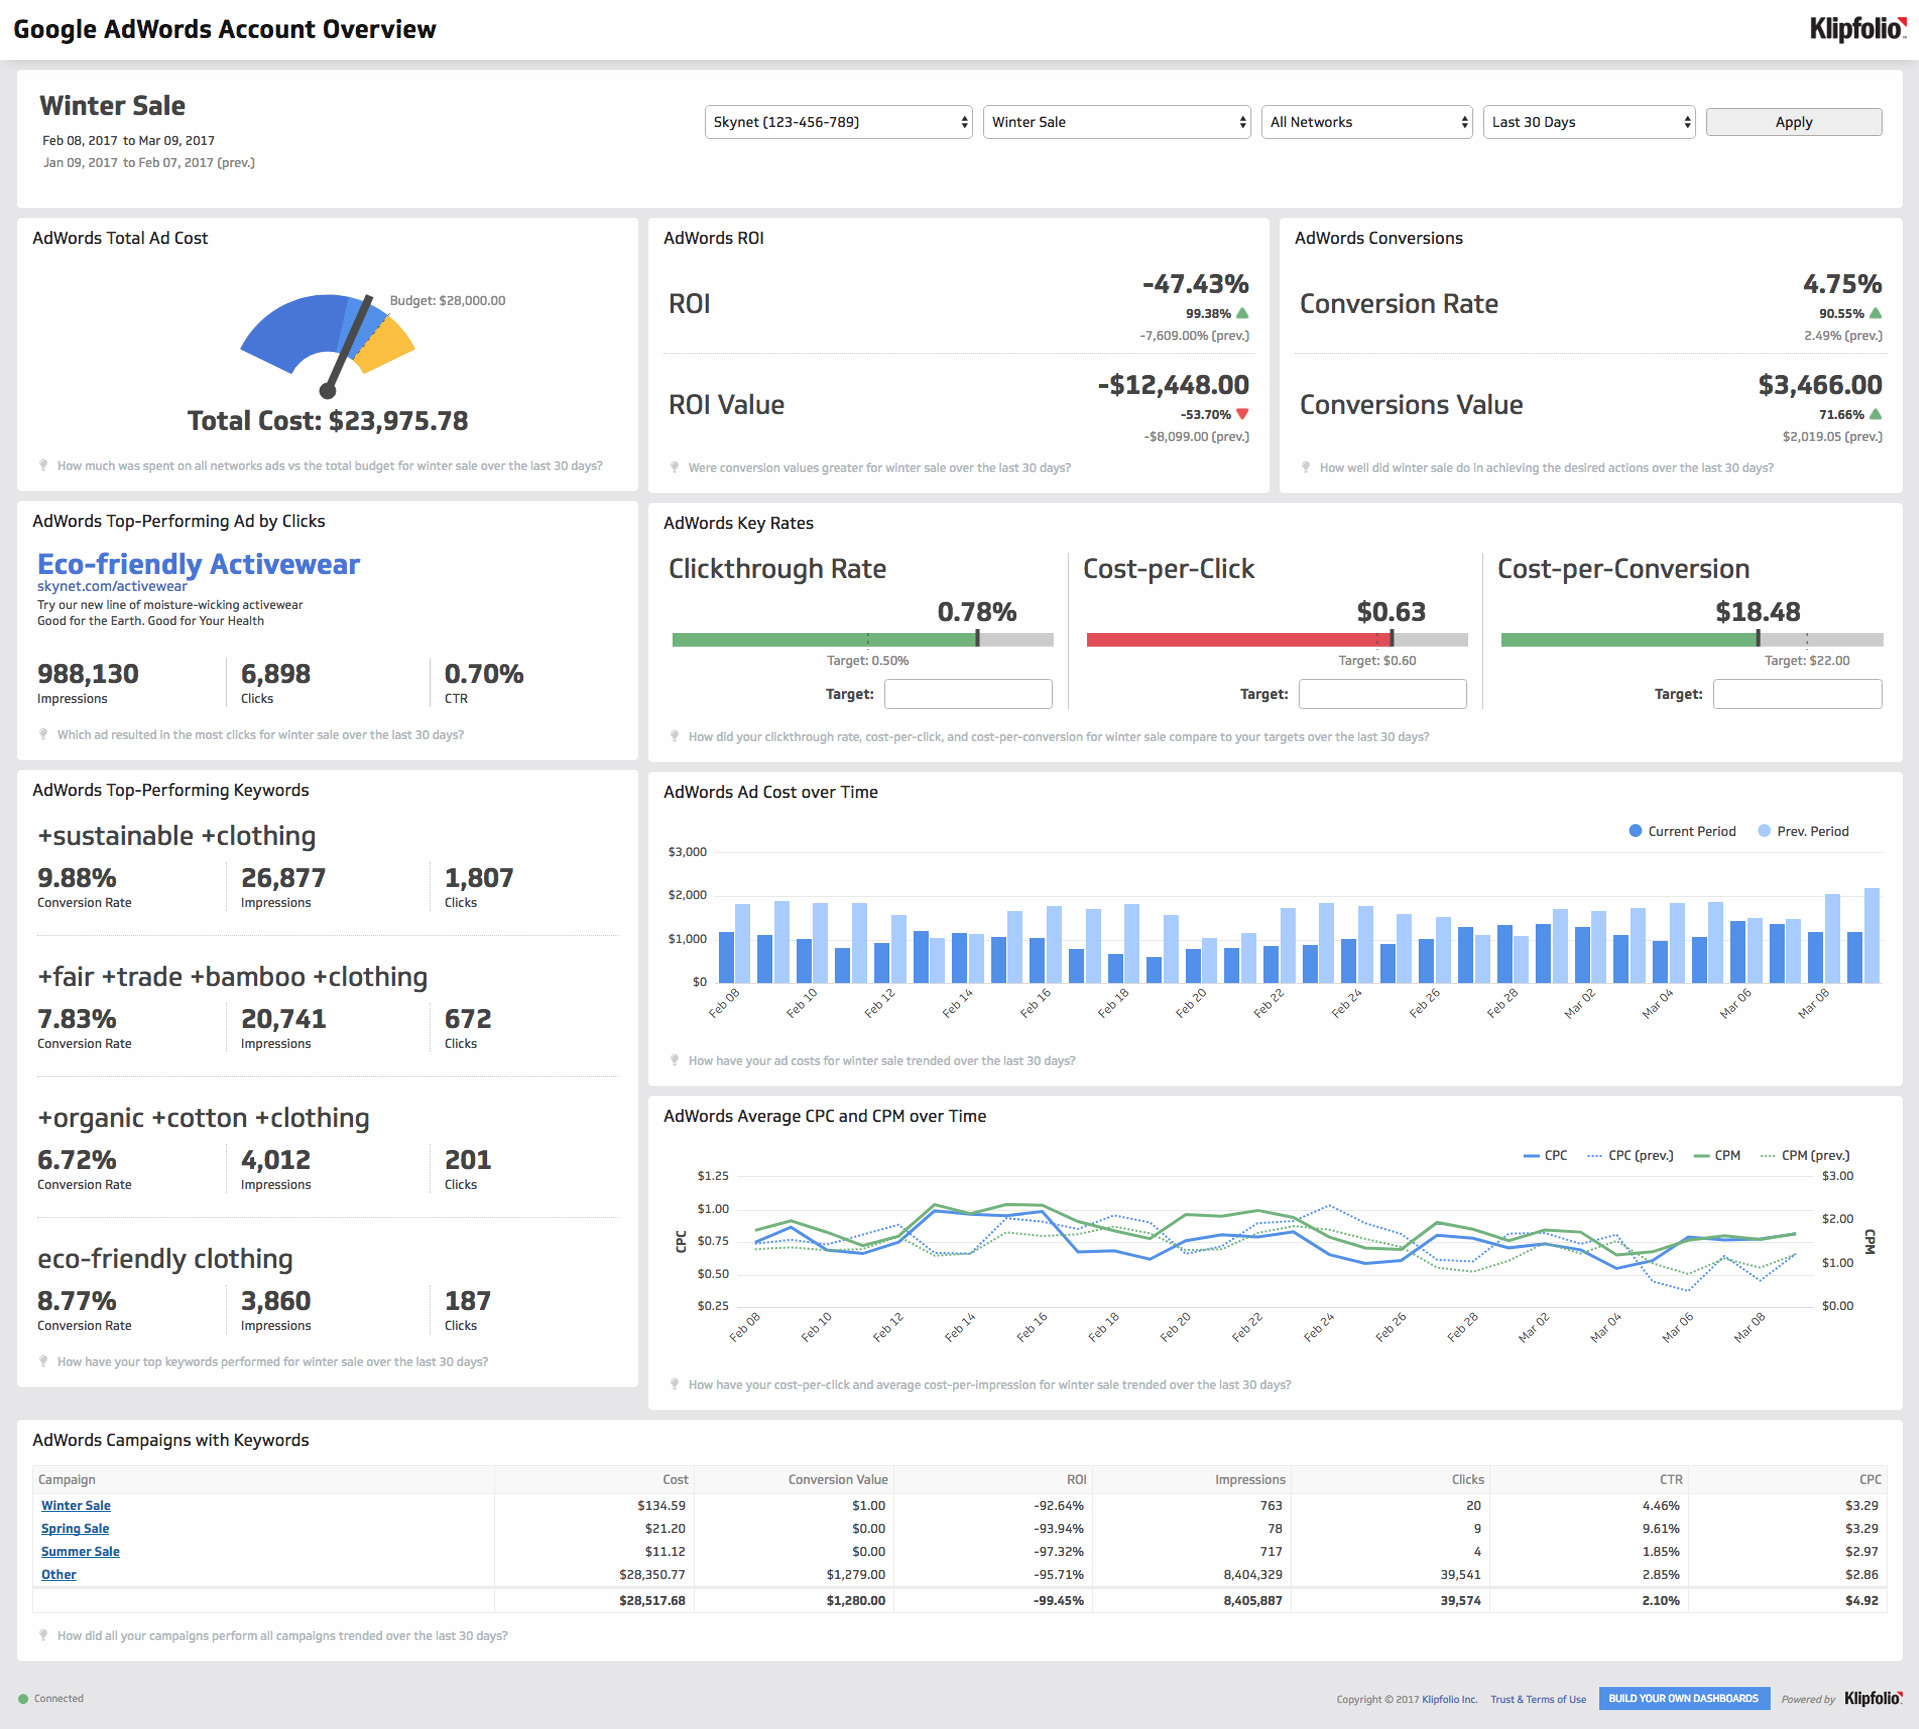
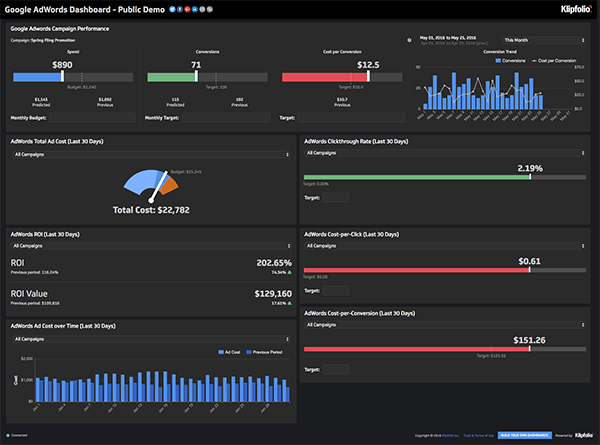
Google AdWords Account Overview
- Get an interactive view of your Google AdWords campaigns in one simple view
- Do a deep dive into key metrics like ROI, Conversion Rate, Conversion Values, and more
- Share your digital advertising results without adding users to your Google account
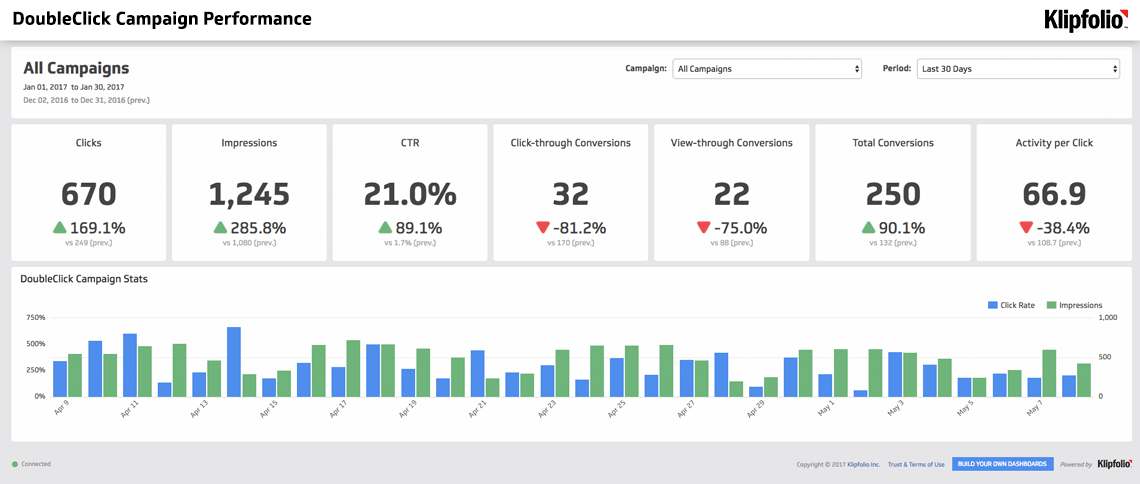
DoubleClick Campaign Performance
- Keep track of all your DoubleClick campaigns in an interactoive dashboard
- Get a quick view into key metrics like Clicks, Impressions, and CTR over different periods of time
- Share the dashboard with your team or put it up on a TV to get everyone rallying around the same numbers
How to track your digital advertising metrics with Klipfolio
Are you responsible for managing paid media campaigns across multiple channels like Google search and disply, Bing, Facebook, or Twitter? Klipfolio allows you to pull in data from all of the different digital advertising platforms you use to track your performance—and display precisely what you need in a single interactive dashboard. What does this mean for you? No more piecemeal reports or Excel sheets with multiple versions. And you can get started with just a few clicks.
Learn about the difference between Ad Clicks and Ad Impressions
Pre-built Dashboards
Here are a few pre-built advertising dashboards
Pre-built Metrics
Here are a few pre-built advertising metrics.
Click each icon to see what's possible.


Facebook Ads
Connecting your Facebook Ads data into Klipfolio gives you instant access to your advertising performance. You can also combine your Facebook Ads data with data from other key services. With Klipfolio you can track metrics like:
- Total spend
- Conversions
- Cost per conversion
- Impressions
- Reach
- And more

Video Campaign Overview
Quickly find your best performing ad sets and see which videos are resonating with your audience.
Uses:


Facebook Campaign Performance
Make sure your message is reaching the right audience by measuring your Facebook Ads campaign performance for the date range of your choice.
Uses:
See what else you can build for Facebook Ads
Google AdWords
Monitoring your Google AdWords performance can be time consuming and sharing results can be tough. With Klipfolio you can easily track and share metrics like:
- Cost-per-click
- Clickthrough rate
- Conversions
- Cost-per-conversion
- ROI
- And more
See what else you can build for Google AdWords
Twitter Ads
Wish you could easily make your Twitter Ads performance visible to your whole team without building monthly or weekly reports? In Klipfolio, it’s easy to track metrics like:
- Impressions
- Clickthrough rate
- Cost-per-click
- And more

Campaign Impressions
Make sure your campaigns are attracting attention! See the number of impressions generated from your Twitter Ads campaign over the last 30 days.
Uses:


Twitter Ads Cost-per-Click
Compare your cost-per-click rate over the last 30 days to your target.
Uses:
See what else you can build for Twitter Ads
Google Analytics
Get more insight into your ads by connecting your Google Analytics account to Klipfolio. You can get a better understanding of how your website is converting visitors who come from your campaigns. Track and share metrics like:
- Website visits
- Website conversion rates
- Keyword performance
")
AdWords Basic Performance (Last 30 Days)
If you've hooked up Google Analytics to Google AdWords, you can make sure that your website visitors from each of your AdWords campaigns are having a positive first impression.
Uses:
See what else you can build for Google Analytics
Discover dashboard builder’s delight
Our customers in digital advertising roles love Klipfolio because it empowers them to build their own dashboards. Sure, it takes time to get it right, but it’s absolutely worth it.
Connecting your data
You’ve got an impressive tech stack, but how do those puzzle pieces fit together? Klipfolio is an API machine with 100s of connections to the digital advertising services you use to help grow your business.
Browse the 100+ services you can connect toThe Editor
Love to tinker and build but tired of using Excel or Google Sheets to share your key results and metrics? The Klip Editor is where you bring your data story to life. Build custom data visualizations that you can share with your whole organization.
Custom visualizations
Drag-and-drop visualizations from the palette to start assembling your custom dashboard. Choose from standard data visualizations like charts, bullet charts, and scatter plots. Or get creative and inject custom HTML into your dashboard. The choice is yours.
Are you building ad campaign reports for clients? We can help.
Tired of using Excel, Google Sheets, and Powerpoint to present paid media strategies and campaign reports to clients? Klipfolio gives you the ability to build and share custom dashboards with your clients that update automatically. That's right, no more manual reports that take hours to put together. Your digital advertising dashboards can include more than just data. Add in images, docs, definitions, or whatever else you need to share. You're only limited by your imagination.
From strategy development to conversion tracking, you can build reports across your entire ad lifecycle. Klipfolio’s strong analytical capabilities make it easy for you to present key insights and data to your clients. Here are a few more benefits you'll see when building dashboards for your clients:
- Showcase ROI in real-time: Partnering with Klipfolio enables you to provide your clients with transparent access to the metrics that matter most to them.
- Automated reporting: Deliver interactive performance dashboards in real-time or submit PDF dashboard reports at the push of a button.
- 100s of integrations: Agency partners are empowered with the freedom and flexibility to connect their dashboards to a wide variety of data sources in real-time, so they don’t have go to ten places to get one answer (and neither do their clients).
- Dashboard reports: Create branded PDF reports for your clients and schedule recurring email reports based on live dashboards.
- Customize your dashboards: Add your logo and taglines to your dashboard, stylize individual Klips and automated dashboard reports, or refine the look and feel of your dashboards at a more granular level with custom CSS.
- Client management: Get access to our dashboard management hub that lets you manage multiple client accounts in a single place.
Sharing
Data is meant to be shared. A dashboard without any viewers is, well, kind of sad. Wouldn’t you agree?
Which is exactly why we make sure you can share with your team multiple ways.
TV dashboard display
Our customers love showing off their dashboards on wall-mounted TVs throughout the office. It’s a great way for executives to nurture a culture of data transparency and the team to see their performance at a glance. Plus, it looks super cool.
Slack, email snapshots, and links
Send Klips or entire dashboards via Slack, setup manual or recurring email snapshots, and share links to your live dashboard.
Top Display and Paid Search Ad Metrics
Looking for some ideas on what advertising analytics to monitor, here are a few common metrics and KPIs to consider:
- Impressions: The total number of times your ad was displayed. The number by itself does not hold much value but it is a metric used to calculate other metrics and KPIs. Note: An impression does not mean that someone actually saw your ad, it just means that the ad was shown on a web page/app.
- Reach: This is the number of unique people that potentially saw your ad. The number should always be lower than the number of impressions because your ad is generally shown to the same person (using cookies) more than once.
- Clicks: Number of clicks on an ad that lead to a person leaving the ad. Keep in mind that a click does not mean that a person landed on the intended destination of the banner ad. There are multiple factors that could lead to a click but not a visit to the desired page.
- Visits: As mentioned above, not every click turns into a visitor landing on your website. Visits are measured by the clicks that did end up on your website.
- Visitors: The visitors metric goes one step further and calculates the number of people (counted by their unique cookies) who ended up on your website as a results of a click on your ad.
- CTR (Click Through Rate): This is the number of clicks generated per impression of an ad. CTR is expressed as a percentage. CTR = (Click / Impressions) x 100
- Engagement Rate: This applies to rich media ads where there is an opportunity for the user to interact with the ad. Engagement rate is the percentage of interactions per impression of an ad. Engagement rate = (Number of Interactions / Total Impressions) x 100
- CPC (Cost Per Click): CPC is the cost that you pay for each click. CPC = Cost/Clicks.
- Conversions: This should be considered your most important metric to track and is usually linked to your Google Tag Manager for tracking. A conversion is the count of action that you want the visitors to take when they arrive from your display ads. Common examples of conversions are: purchase made, newsletter signup, trial sign up, registration for a webinar lead, and more.
- Conversion Rate: Conversion rate is the percentage of visits that resulted in a desired conversion. Conversion Rate = (Total Conversions / Visits) x 100.
- CPC (Cost Per Conversion): Another top metric to track for your digital ads. CPC = (Total Cost / Number of Conversions).
- Revenue: Another key metric to help track the success of your digital advertising campaigns. Revenue is calculated at the total amount of revenue that is directly attributed to the visits from your paid advertising efforts.
Resources for Marketing Ad Managers (SEM/PPC/SEO)
For many companies the success of their pipeline is determined by how successful their paid acquisition strategies are. Managing all your different marketing channels and tracking the performance of each one is not easy. Here are some great resources to help you build more effective skills around digital advertising analytics: