

Best web analytics tools for growing companies
Compare top web analytics platforms to find the right fit for your growing company. Our guide covers free and paid tools, key features, and how to build effective dashboards.

What is web analytics
Web analytics is the practice of measuring how your target audience interacts with your website. It answers critical questions about your visitors and their behaviour, including:
How many visitors your website receives
Where traffic comes from (search results, social media, direct links)
What devices visitors use (mobile, tablet, desktop)
By understanding who uses your website and what they do, you can refine your strategy to reach them more effectively.
In this guide, we'll cover:
Top web analytics tools for 2026
Key features to evaluate
Best web analytics software
Here are seven leading web analytics platforms:
Google Analytics
Hotjar
Adobe Analytics
Crazy Egg
Matomo
Amplitude
Pendo
What does web analytics software do
Web analytics software collects data from your website and organizes it so you can monitor your key performance indicators, understand your audience, and improve your site's performance.
Web analytics software performs three core functions:
Collection: You can't manage what you don't measure. Web analytics software gathers visitor information by installing tracking code on your site. This code captures data about user behaviour, pages visited, browser type, and session duration.
Management: Raw data has no value sitting idle. Web analytics software stores your data in a centralized location where it can be accessed and sorted at any time, making it easy to retrieve insights when you need them.
Analysis: Static data is useless without the ability to slice and dice it. Web analytics software provides tools to extract the specific information you're looking for after it's been collected.
Google Analytics is a practical example. It uses tracking code installed on your site to collect visitor data, then provides a platform where you can pull and analyze that information quickly. This combination of collection, storage, and analysis is what makes web analytics software valuable for your business.
How web analytics software helps
Web analytics software keeps you on top of your website, one of your most important business assets. It gives you the information to act with confidence rather than guess.
Here's a practical example. You notice conversions dropped last month. A look at your web analytics data reveals that mobile traffic declined significantly. This prompts you to investigate: Did recent site changes break mobile navigation? Did your marketing team stop targeting mobile users? Did organic search traffic from mobile drop?
Without web analytics, you'd be guessing. With it, you have a clear answer and a direction. The software collects comprehensive information that you can filter by device, traffic source, geography, and dozens of other factors. That's the difference between reacting to a problem and understanding it well enough to fix it.
The alternative, pasting numbers into a spreadsheet or asking a generic AI tool to interpret data it knows nothing about, puts the burden back on you. Good web analytics software surfaces what matters without making you dig for it.
Best low-cost and free web analytics software
Google Analytics
Google Analytics is Google's free web analytics platform that tracks, analyzes, and reports website traffic. It measures advertising ROI and integrates with a wide range of marketing and advertising tools.
Pricing: Free up to 10 million hits per month per property. Request a quote for Analytics 360 (the premium version).
Hotjar
Hotjar is a behaviour analytics platform that helps you measure and observe user behaviour. It shows you what users do on your site and provides insights for improving user experience and conversion rates.
Pricing: 15-day free trial. Basic plan is free forever (up to 2,000 pageviews/day). Plus plan starts at around £32/month (up to 10,000 pageviews/day). Check the Hotjar website for current pricing.
Adobe Analytics
Adobe Analytics is an enterprise analytics platform that helps you understand customers as people and make decisions based on customer intelligence. It provides reporting, visualizations, and analysis of customer data to surface actionable insights.
Pricing: Customized pricing with three tiers: Select, Prime, and Ultimate.
Crazy Egg
Crazy Egg is a website optimization tool that uses heatmaps, session recordings, and A/B testing to show you exactly where users click and how they move through your pages. It's particularly useful for improving conversion on high-traffic landing pages.
Pricing: Plans start at around $29 USD/month. Check the Crazy Egg website for current pricing.
Matomo
Matomo (formerly Piwik) is a free, open-source web analytics platform that gathers and analyzes user behaviour through KPIs. It's trusted by organizations including Forbes, Sharp, and Oxfam.
Pricing: Free open-source software with no data limits. Cloud-hosted version pricing varies by traffic volume. Check the Matomo website for current plans.
Amplitude
Amplitude is a product analytics platform that helps companies understand user behaviour, marketing effectiveness, and business performance. Companies including Square and Dropbox use Amplitude to drive user engagement and retention.
Pricing: Free plan with limited features. Request a quote for Growth and Enterprise plans.
Pendo
Pendo is a product engagement platform offering in-app analytics, surveys, feedback collection, and user guidance. It provides visibility into how features are used and by whom.
Pricing: Free plan for designing and deploying NPS surveys in-app or on websites. Request a quote for Pendo Product Cloud, which includes product analytics, surveys, personalized guides, and in-app announcements.
Create custom dashboards for you and your team.
Get started with KlipsKey questions to ask when evaluating web analytics software
Choosing the right web analytics tool requires understanding your needs and priorities. These questions will guide your evaluation.
What do I need my web analytics software to accomplish?
Start here. If you don't know what you're trying to achieve, you can't select the right tool. Define your goals, whether that's tracking conversions, understanding user behaviour, or monitoring campaign performance. This ensures your analytics tool extends your strategy rather than complicating it.
Can I accomplish what I need with a free tool?
Free tools are the best starting point. Google Analytics is free and comprehensive enough for most growing companies. You can track site visits, conversion goals, and return on investment without paying anything. For most organizations, that's sufficient.
If not, what do I need from a paid tool?
Free tools have limits. Paid tools offer advanced features. Crazy Egg, for instance, creates heatmaps showing exactly where users click and move their mouse, helping you improve key pages. Evaluate whether these premium features justify the cost for your specific needs.
How many resources do I have to devote to this?
Web analytics software pricing varies widely. Google Analytics is free, but Google Analytics 360 costs significantly more. Beyond subscription fees, factor in setup costs, consultant fees if needed, and internal staff time to configure and learn the tool. Build a complete budget before committing.
How technically proficient is my organization?
Some analytics tools require significant technical expertise to install and use effectively. Assess whether your team has the skills to implement and use the tool fully, or whether you'll need external support.
Are we more interested in reporting or analysis?
Web analytics serves two purposes: reporting (tracking known metrics) and discovery (uncovering unexpected insights). Google Analytics excels at reporting against KPIs but is less suited to revealing new patterns. Decide which matters more to your team and choose accordingly.
How reliable is the tool?
Can you trust the data? Would you share these numbers with your leadership team? Reliable numbers are more valuable than a long feature list. Some tools have been known to report inaccurate data, so evaluate this carefully before committing.
How many users can have access?
Many analytics platforms price by user count. Ensure the pricing model fits your current team size while allowing room to grow. Some tools offer unlimited users; others charge per seat.
How frequently is the software updated?
Analytics platforms evolve constantly. Ask how often the tool updates and whether you'll always have access to the latest features. Regular updates mean you're not stuck with outdated functionality.
How to build web analytics dashboards that drive decisions
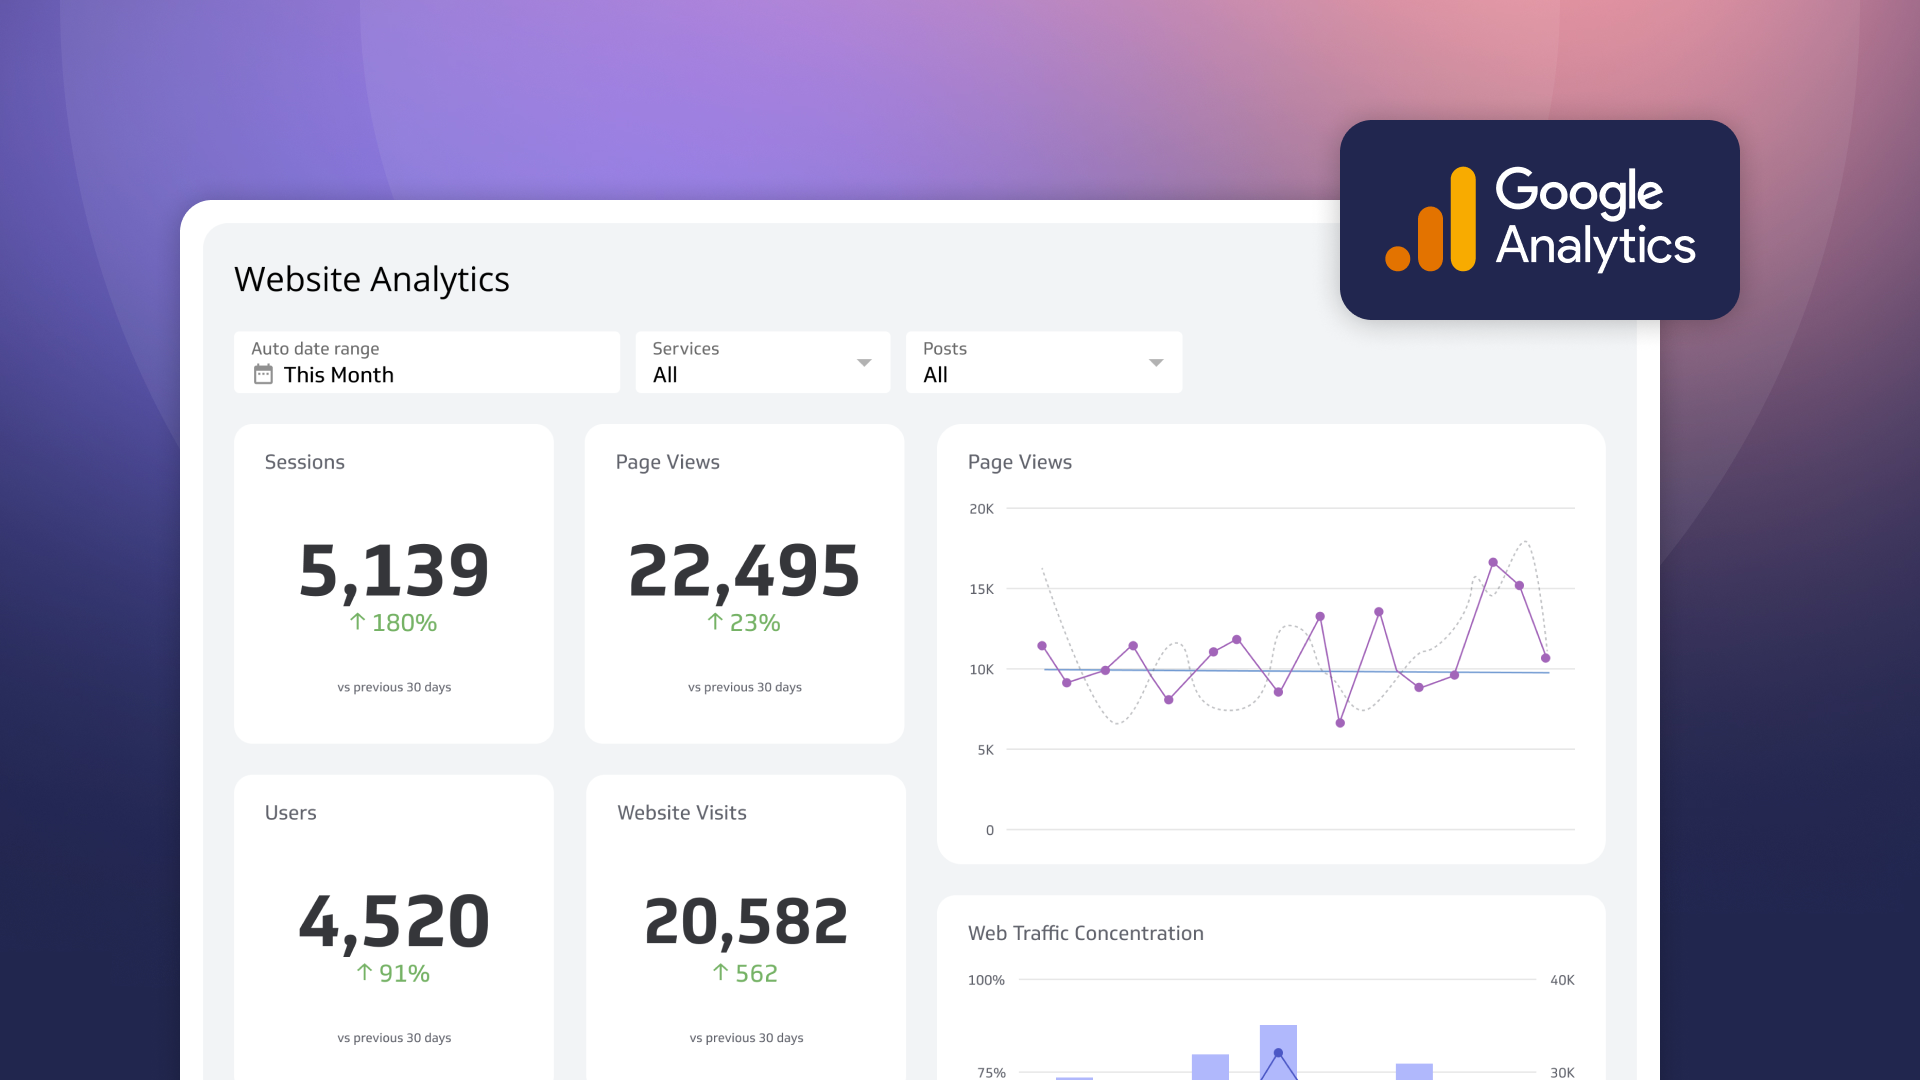
Google Analytics is powerful, but its native reports aren't always formatted the way your team needs them. Custom dashboards solve this problem, and they do something more important: they turn a tool you have to check into a source of answers that's always ready.
Build custom Google Analytics dashboards that present your data exactly how your team needs to see it. Use the Google Analytics Query Explorer to pull rich datasets. Combine Google Analytics with other sources, such as Facebook Ads, HubSpot, and Shopify, to create unified dashboards in Klips, our dashboard software for growing companies.
Instead of pasting numbers into a spreadsheet or explaining your business context from scratch to a generic AI tool every time you need an answer, you get a single view that reflects your actual performance, consistently and automatically. Your team knows what's happening without having to ask, and you spend your time on decisions, not on pulling data.
Most important Google Analytics metrics
Track these ten key metrics to understand your website performance:
Users: Total number of unique visitors
Bounce rate: Percentage of visitors who leave without taking action
Sessions: Number of user visits
Average session duration: How long visitors spend on your site
Percentage of new sessions: Ratio of new to returning visitors
Sessions by channel: Traffic breakdown by source (organic, paid, social, direct)
Pages per session: Average number of pages viewed per visit
Goal completions: Number of times visitors complete a desired action
Goal conversion rate: Percentage of visitors who complete a goal
Pageviews: Total number of pages viewed
How to build a Google Analytics dashboard
Choose your dashboard type: Build from scratch or use a pre-built Klips template.
Connect your data: Link your Google Analytics account to Klips with our built-in integration.
Select your metrics: Choose the KPIs that matter most to your team.
Design your dashboard: Customize visualizations, colours, and add indicators to match your brand.
Create custom dashboards for you and your team.
Get started with KlipsCustom Google Analytics data sources
Connect your Google Analytics data using app connectors to build custom dashboards in Klips.
Updated 2026-08-27




Most recent
- SEP 25What SOC 2 taught a small team about trust
- SEP 15The AI race: progress, humanity, and trust
- SEP 9The good advisor
- AUG 11Beyond simple sign-ups: how True Trials and Activation predict growth
- JUL 7Why business leaders miss important trends in their dashboards
- JUN 19The best chart for the job: Visualizing data for non-technical users