X (Twitter) Analytics Dashboard
Boost your X (Twitter) performance by monitoring key engagement metrics in a dashboard.
What is an X (Twitter) Analytics Dashboard?
An X Analytics Dashboard displays the metrics and KPIs for your social media marketing strategy. When you visualize your X metrics on a dashboard, you can use the insights to develop your marketing strategy, increase engagement, and drive performance outcomes.
When you monitor your X analytics on a dashboard, you can answer important questions like:
How many people are my posts reaching?
How does my audience engage with my X content?
Are people talking about my brand, product, or service on X?
An X analytics dashboard gives you the insight to understand how effective X is as part of your social media strategy and whether it is helping you achieve your goals.
What metrics should you include on an X dashboard?
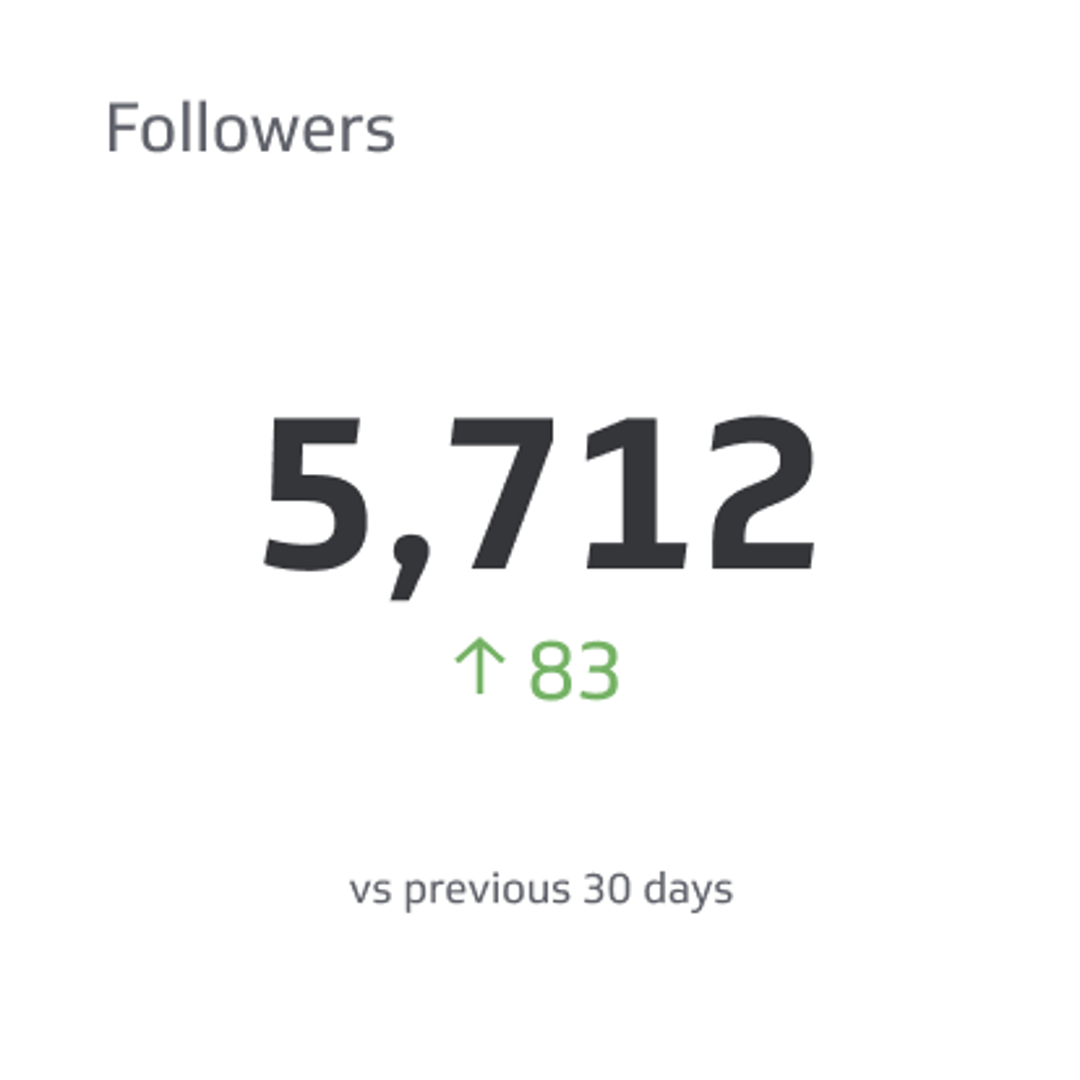
Followers
Followers is the number of users who have chosen to follow another user's or company's posts.
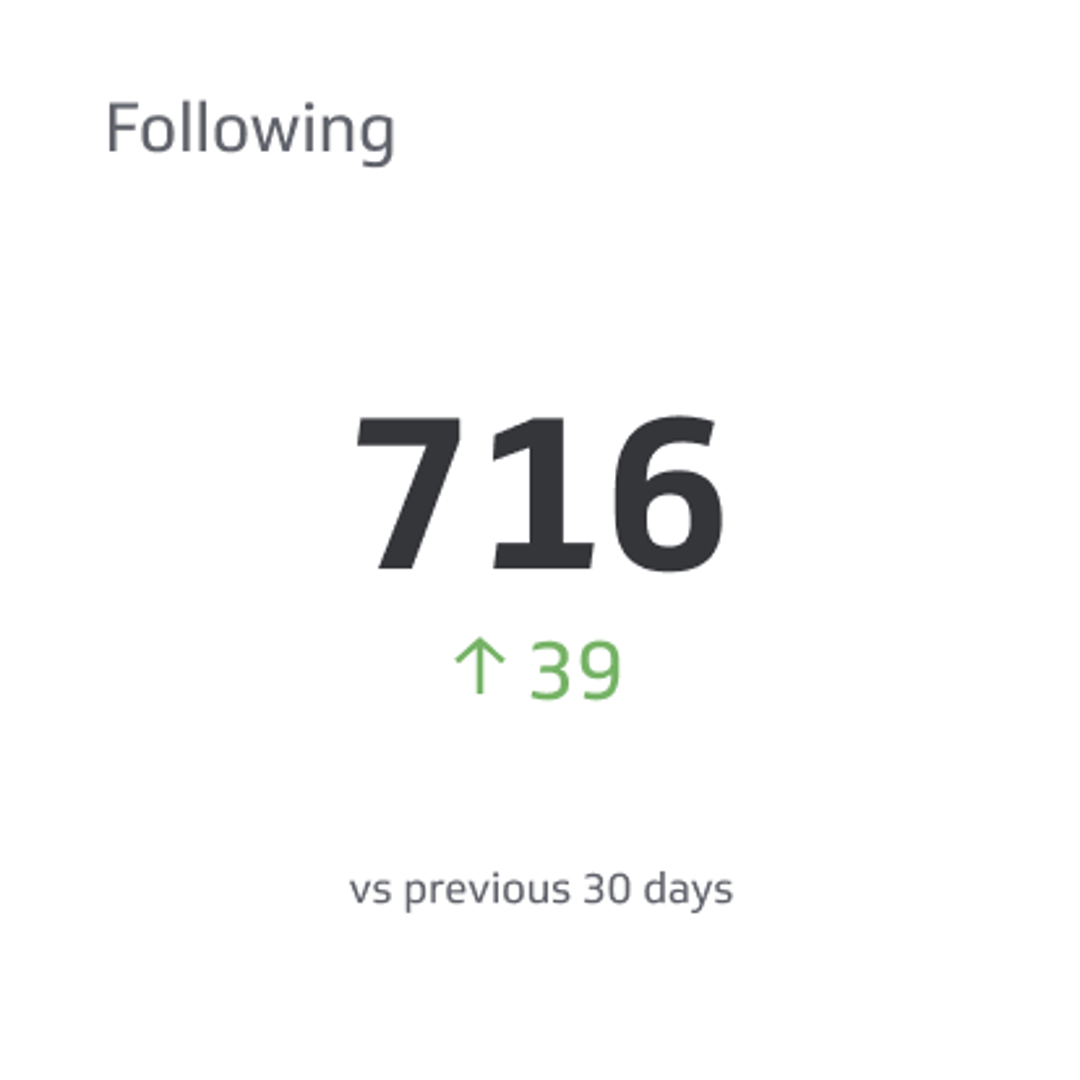
Following
Following is the number of accounts or pages a user or brand has chosen to follow on social platforms.
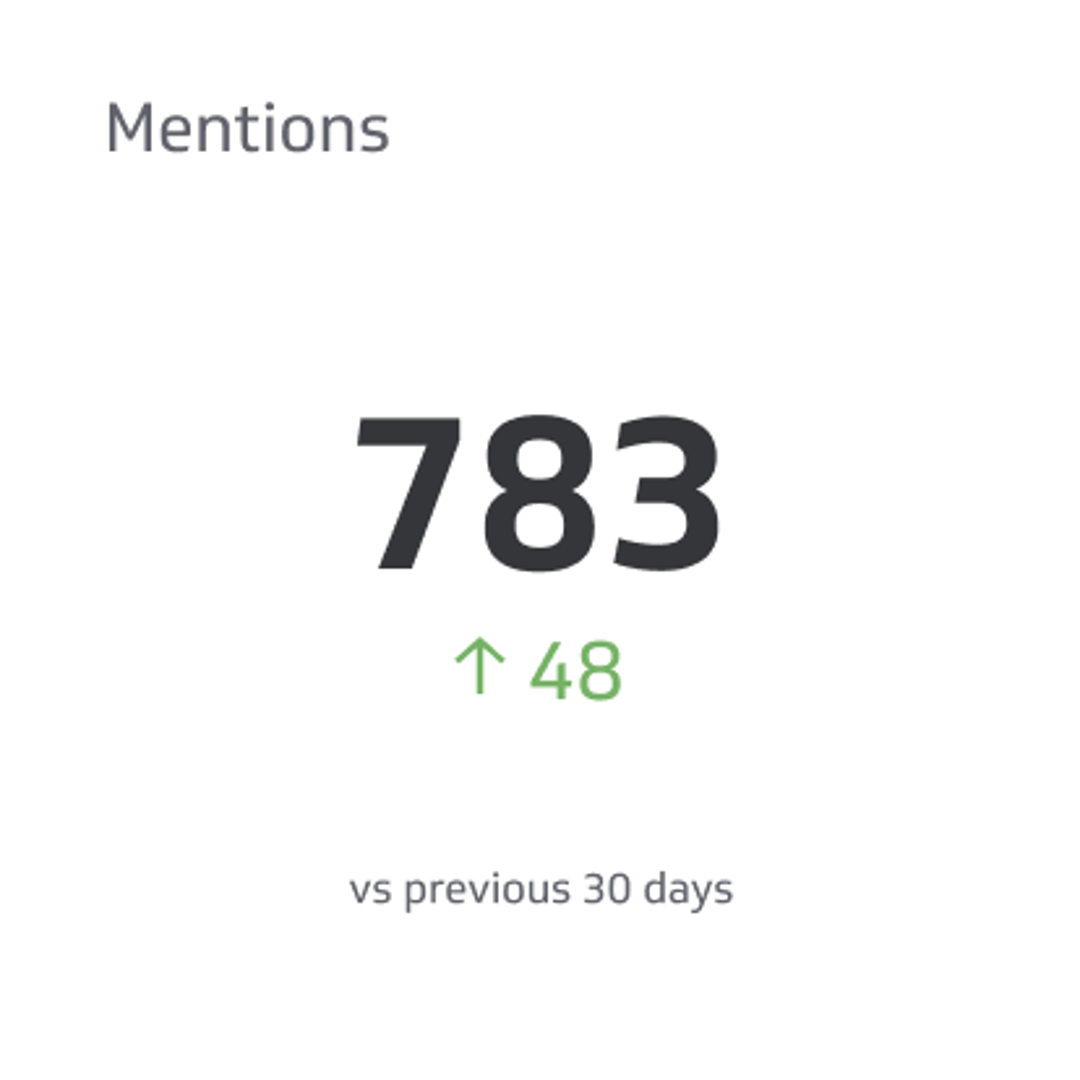
Mentions
Mentions on social media are instances where users reference another user by using the @ symbol.
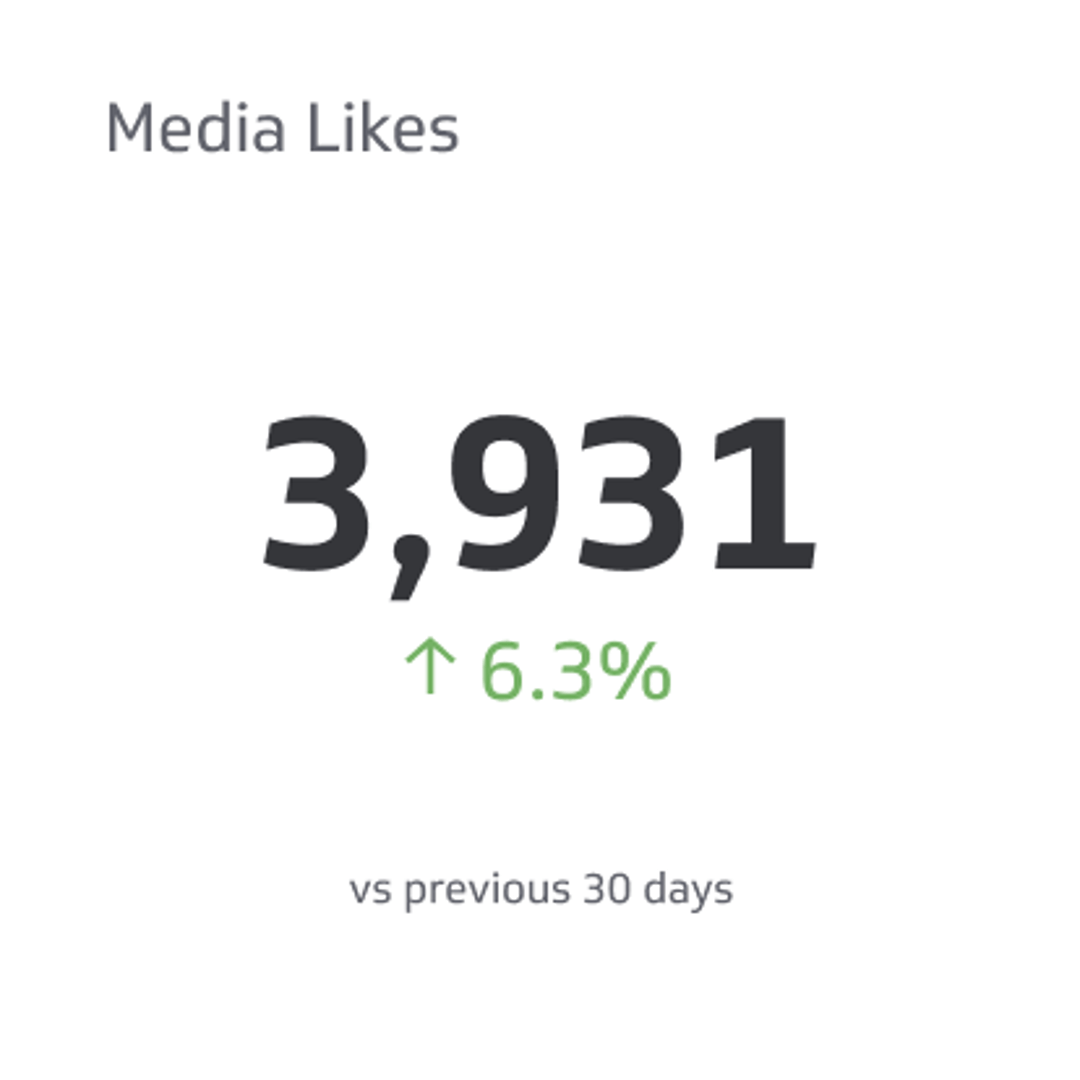
Media Likes
Media Likes is the total count of likes you receive on multiple formats of media posted on your social media page.
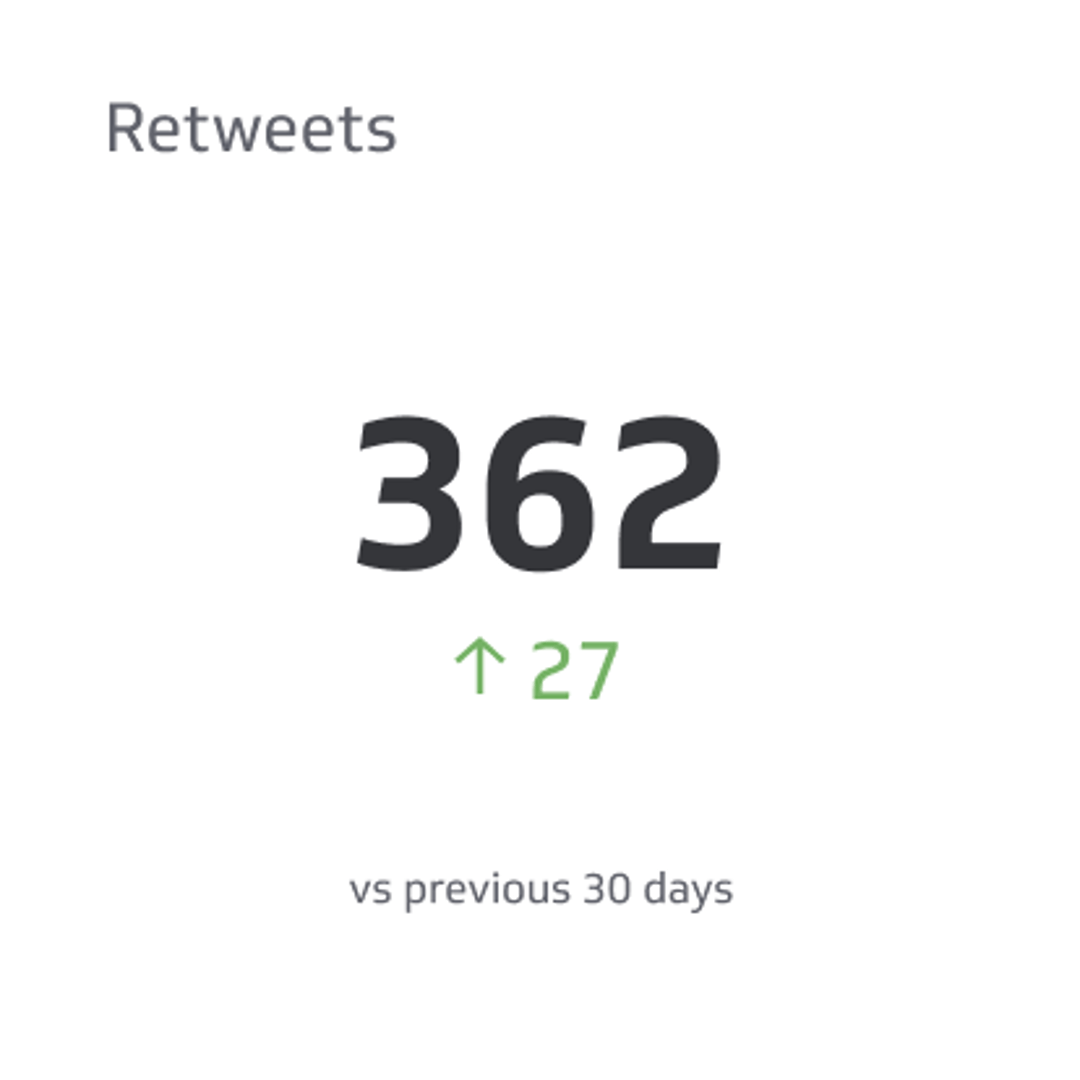
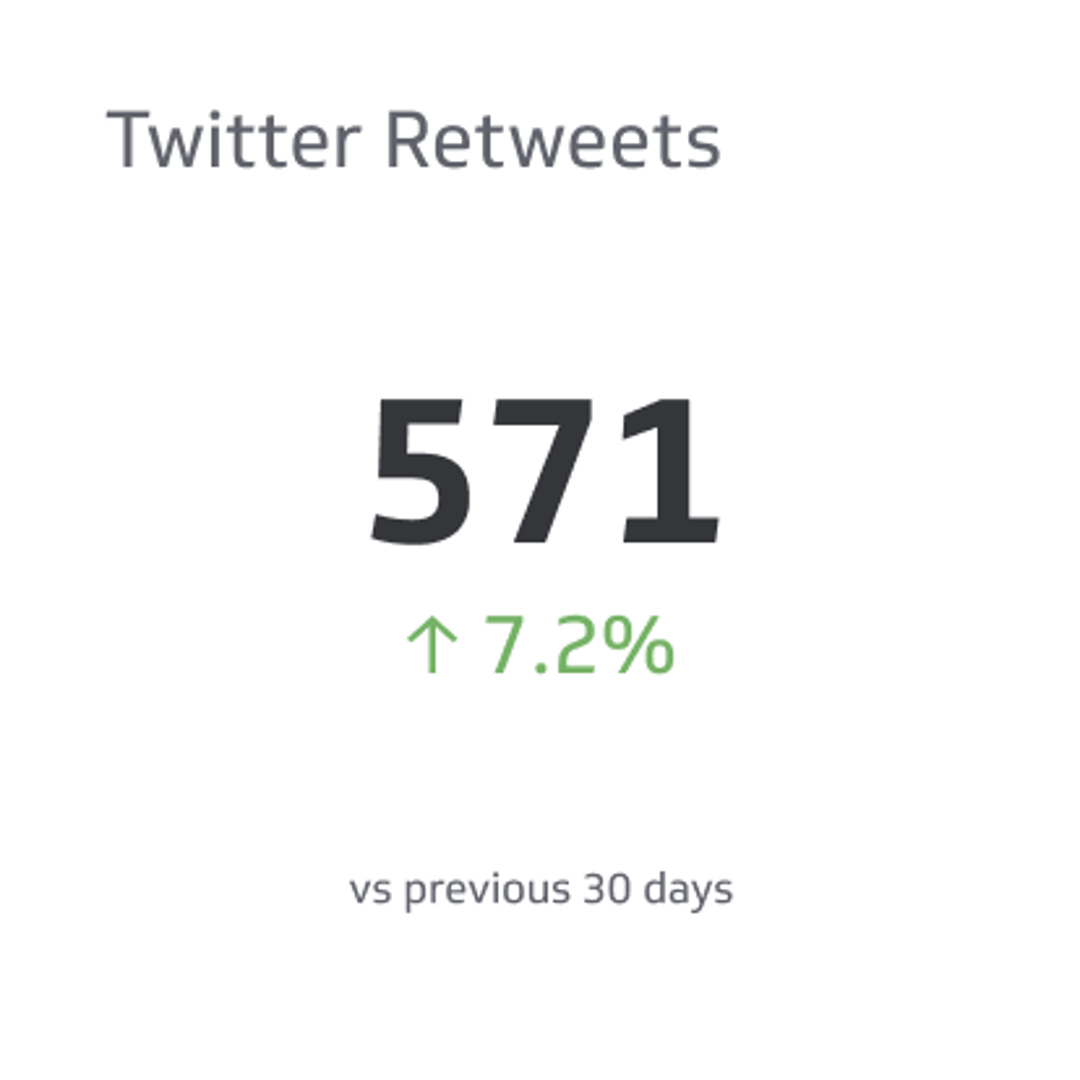
Reposts
Reposts (formerly retweets) is the total number of people who share your post with their own followers.
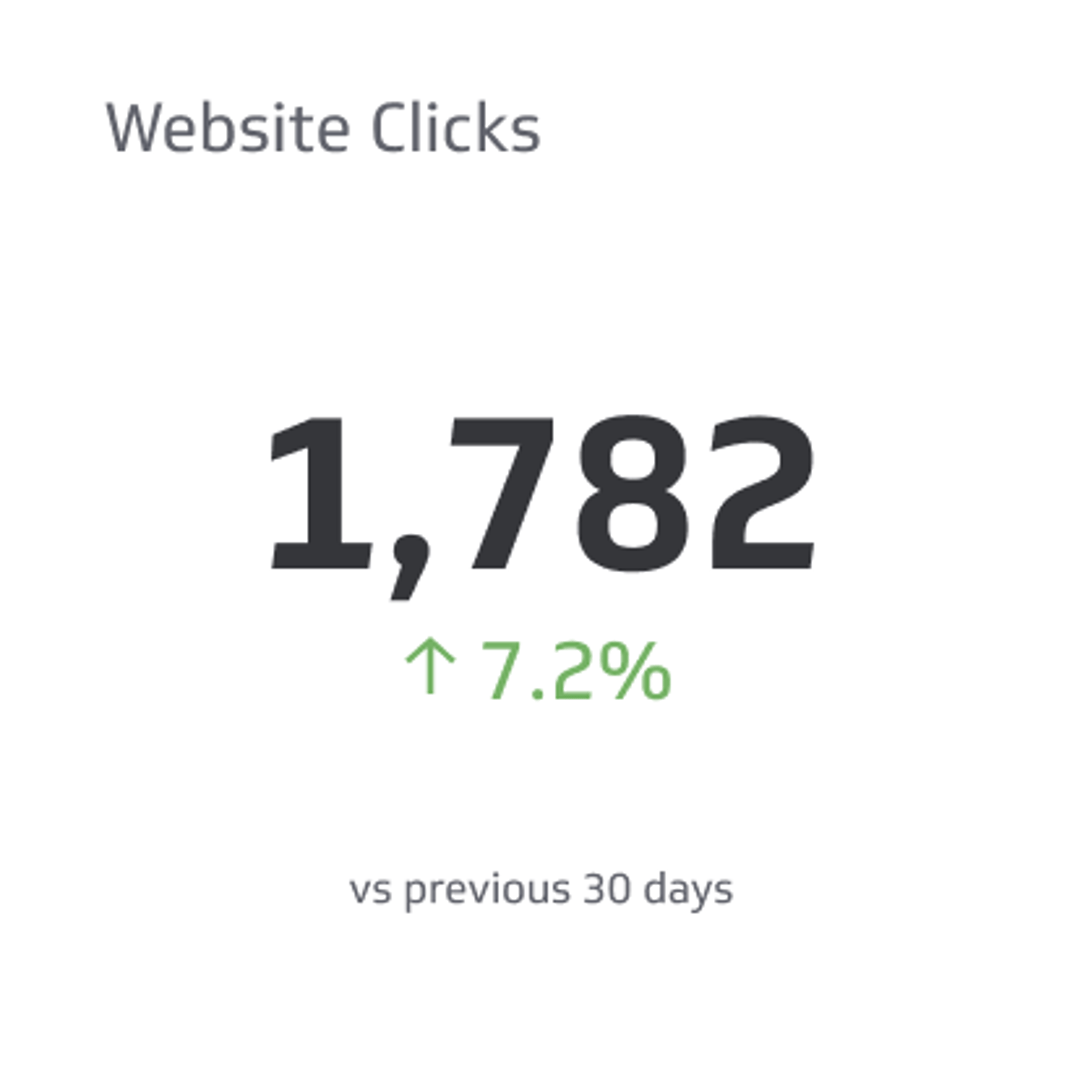
Website Clicks
Website Clicks counts the number of times people clicked on the link to your website on your social media profile page.
What visualizations work best on an X dashboard?
X analytics provide valuable insight into the growth and engagement of your account. The metrics you track on your X dashboard have basic dimensionality. You can segment your metrics by time periods — days, weeks, or months — to understand how your content performs and identify trends.
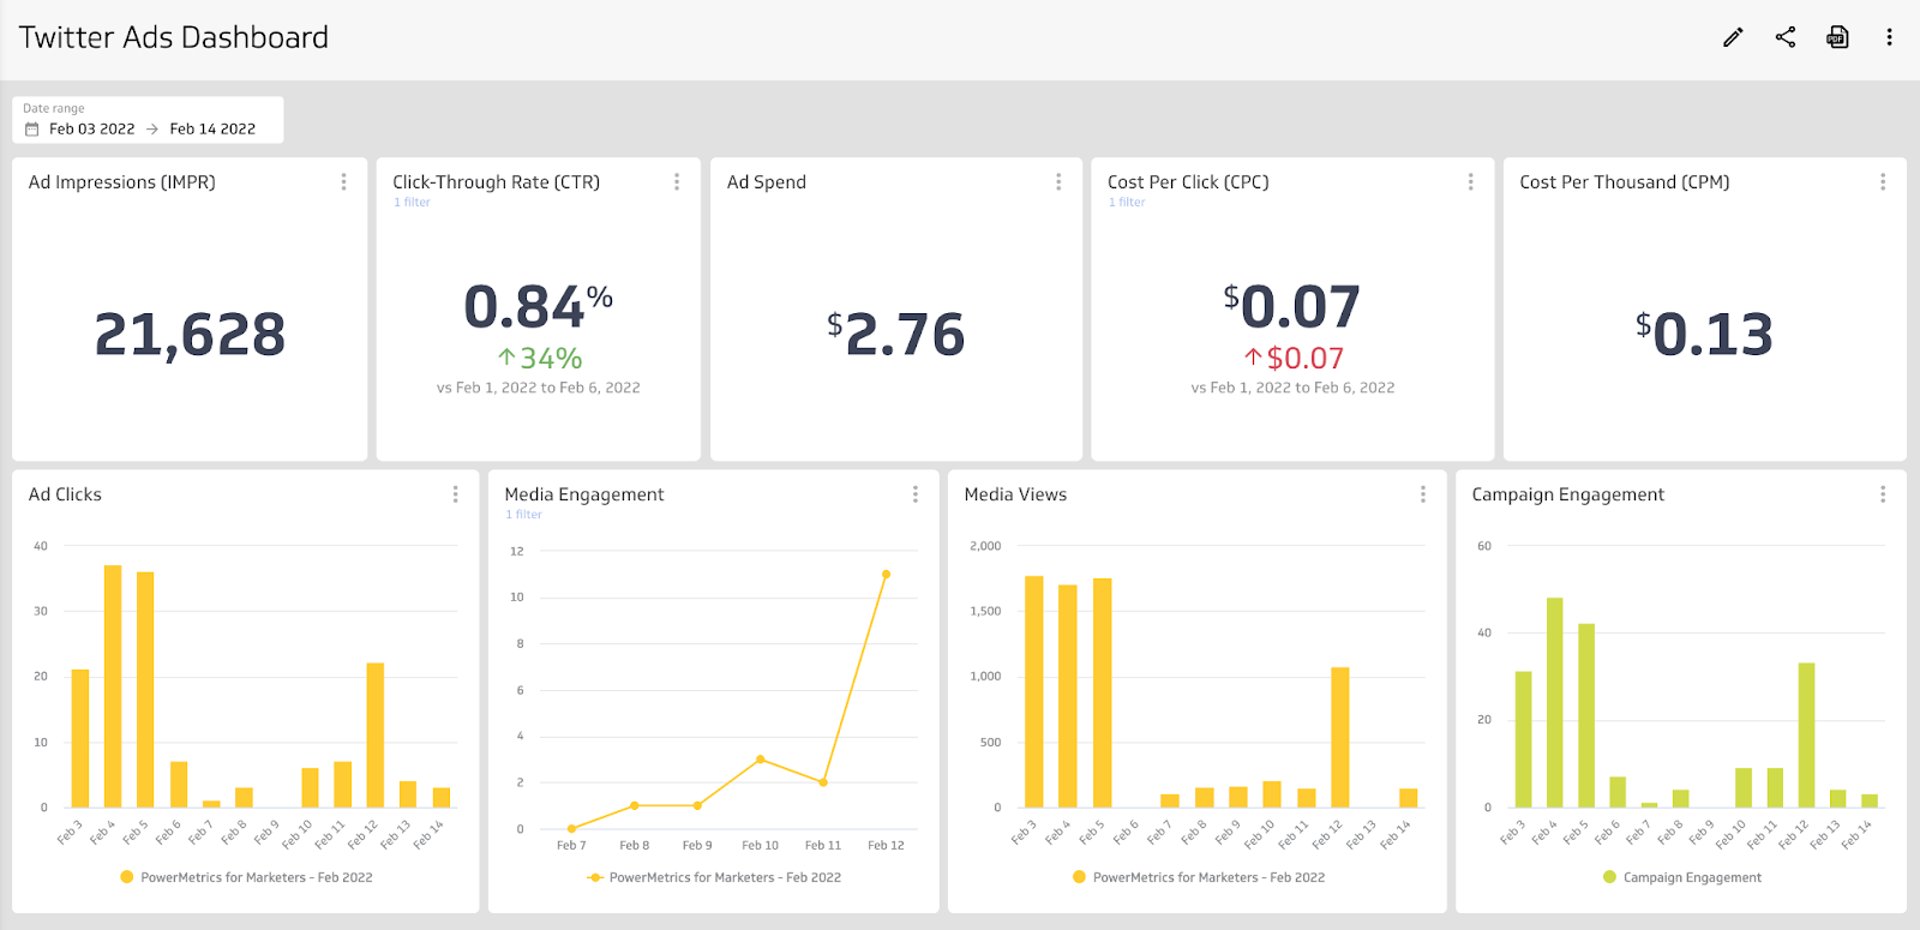
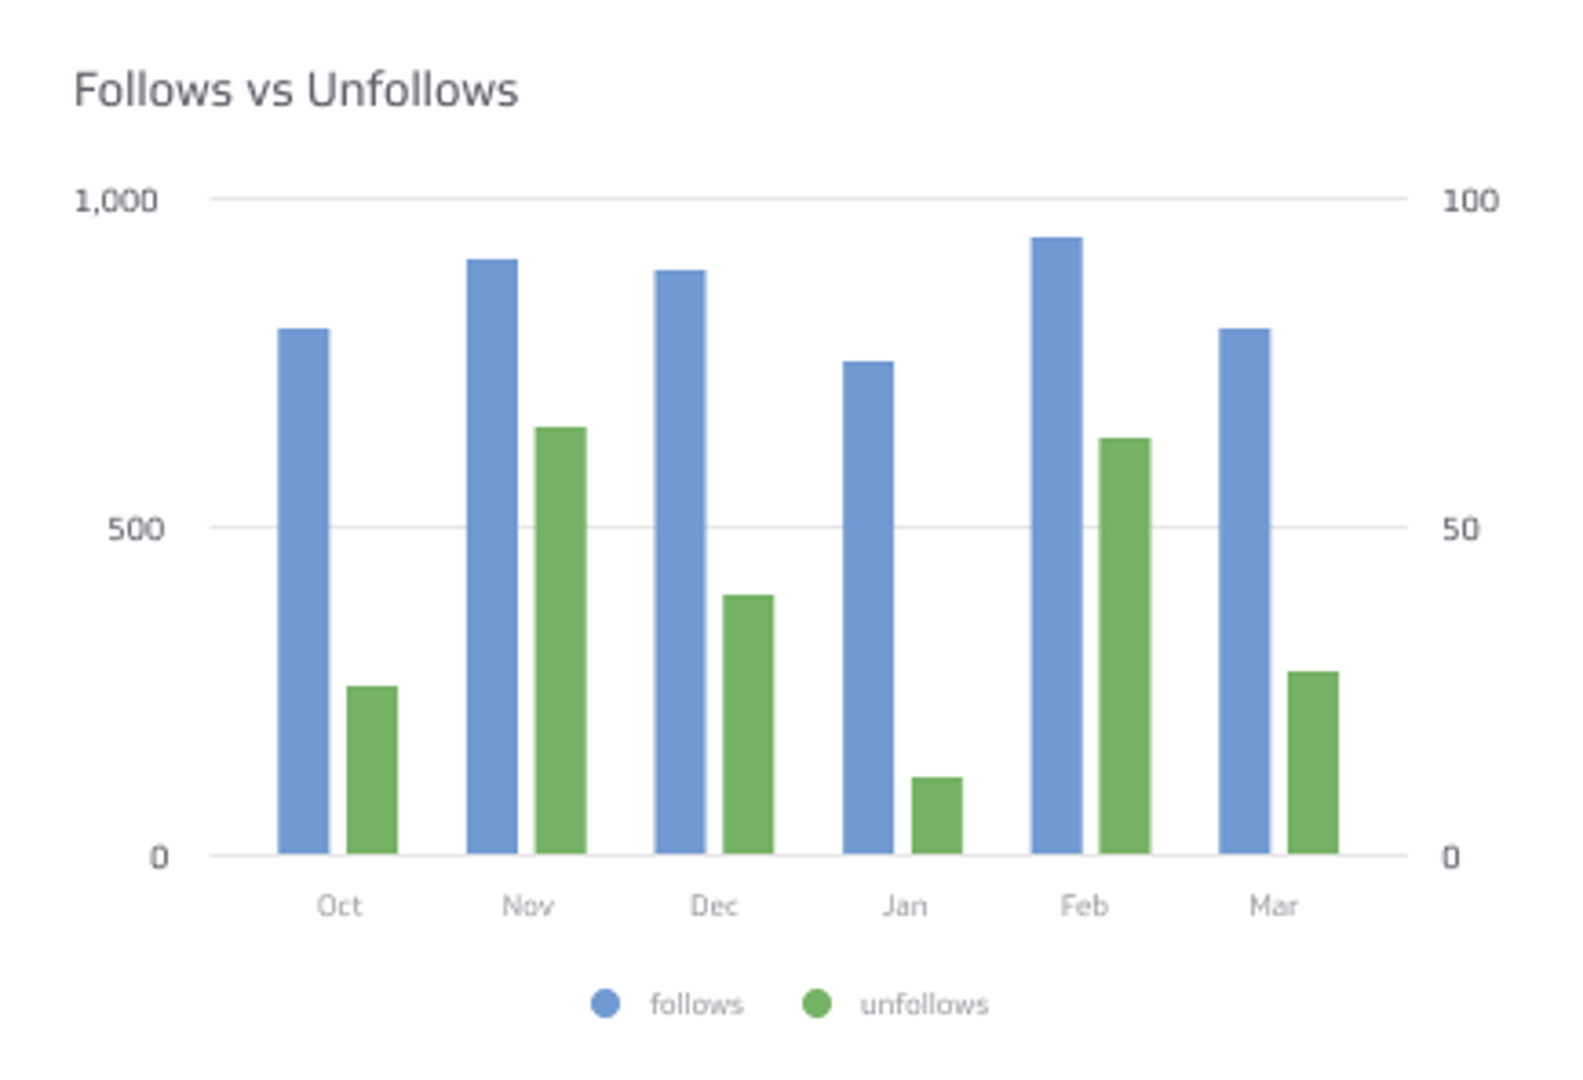
Temporal data visualizations are the most common choice for displaying periods of time. Bar charts and line charts both include an x- and y-axis, making it easy to compare values over a period of time.
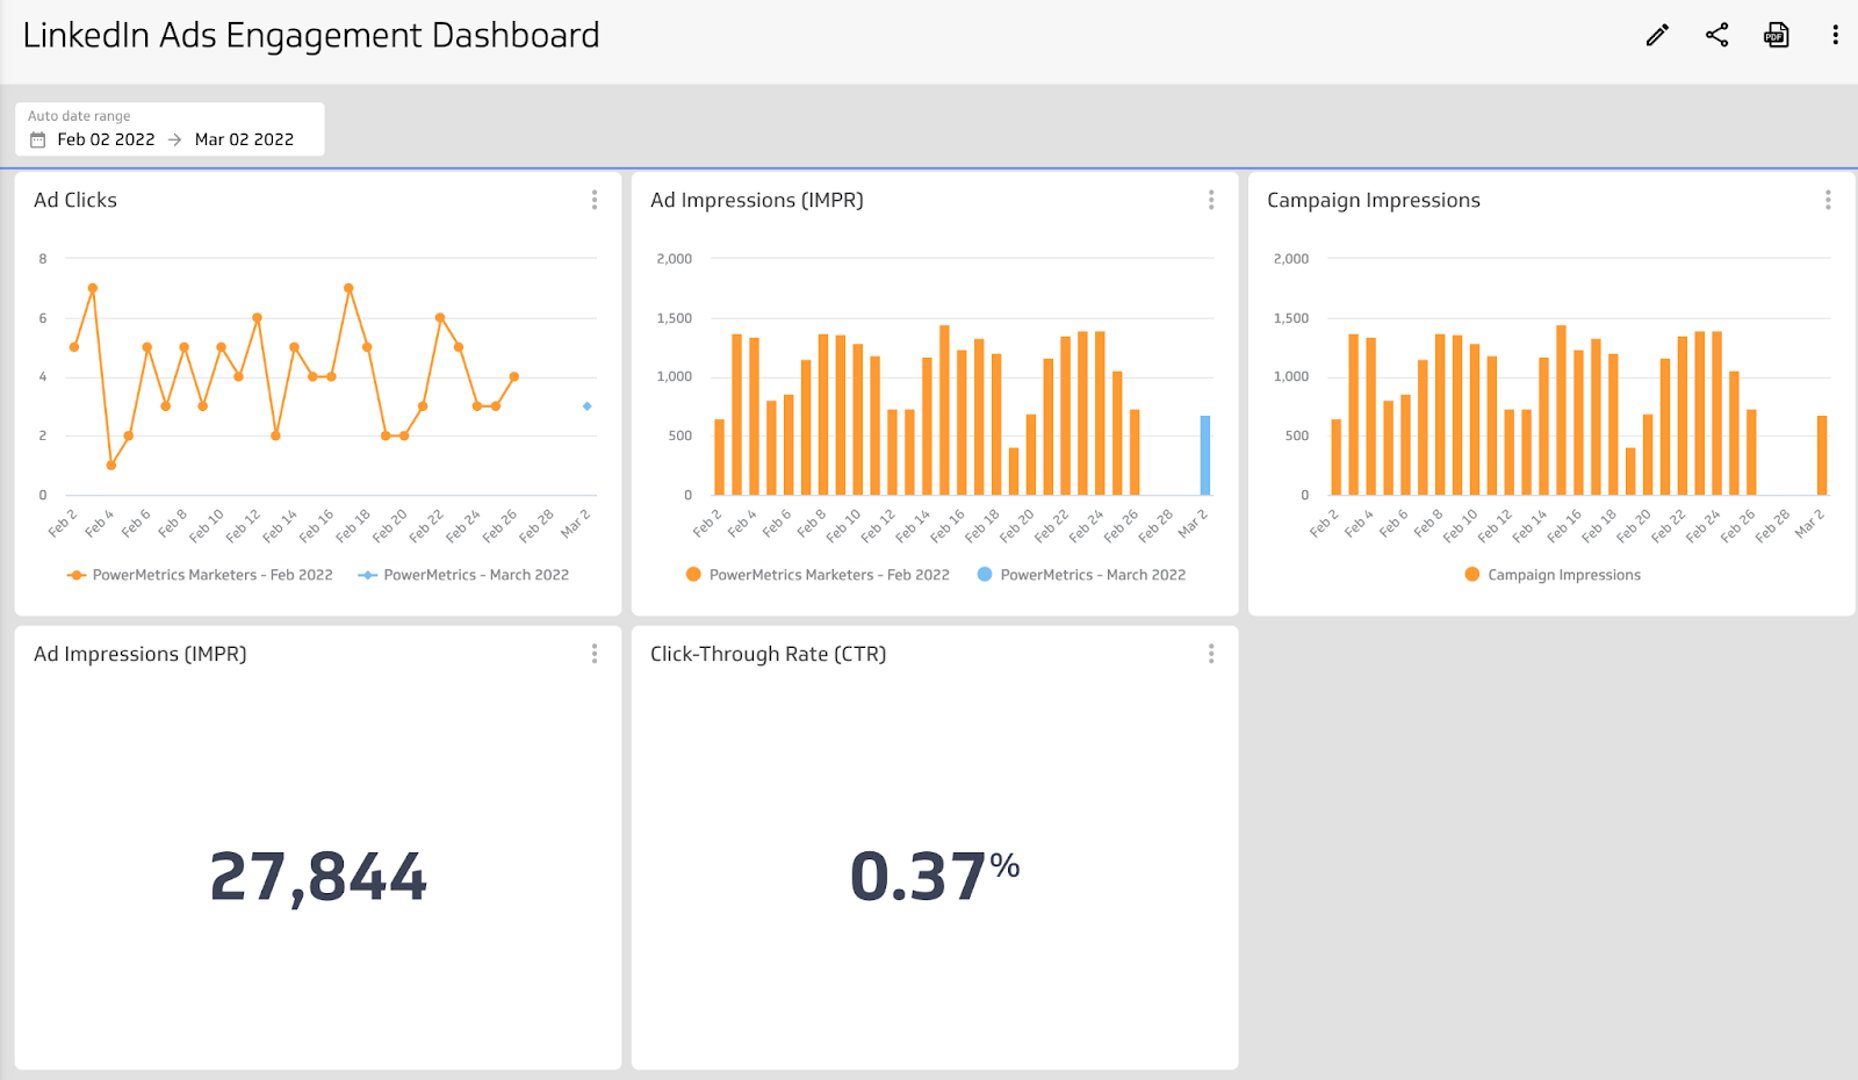
Bar charts or line charts
If you want to compare follower growth by week, a bar chart or line chart works well. Both visualizations let you spot growth trends at a glance.
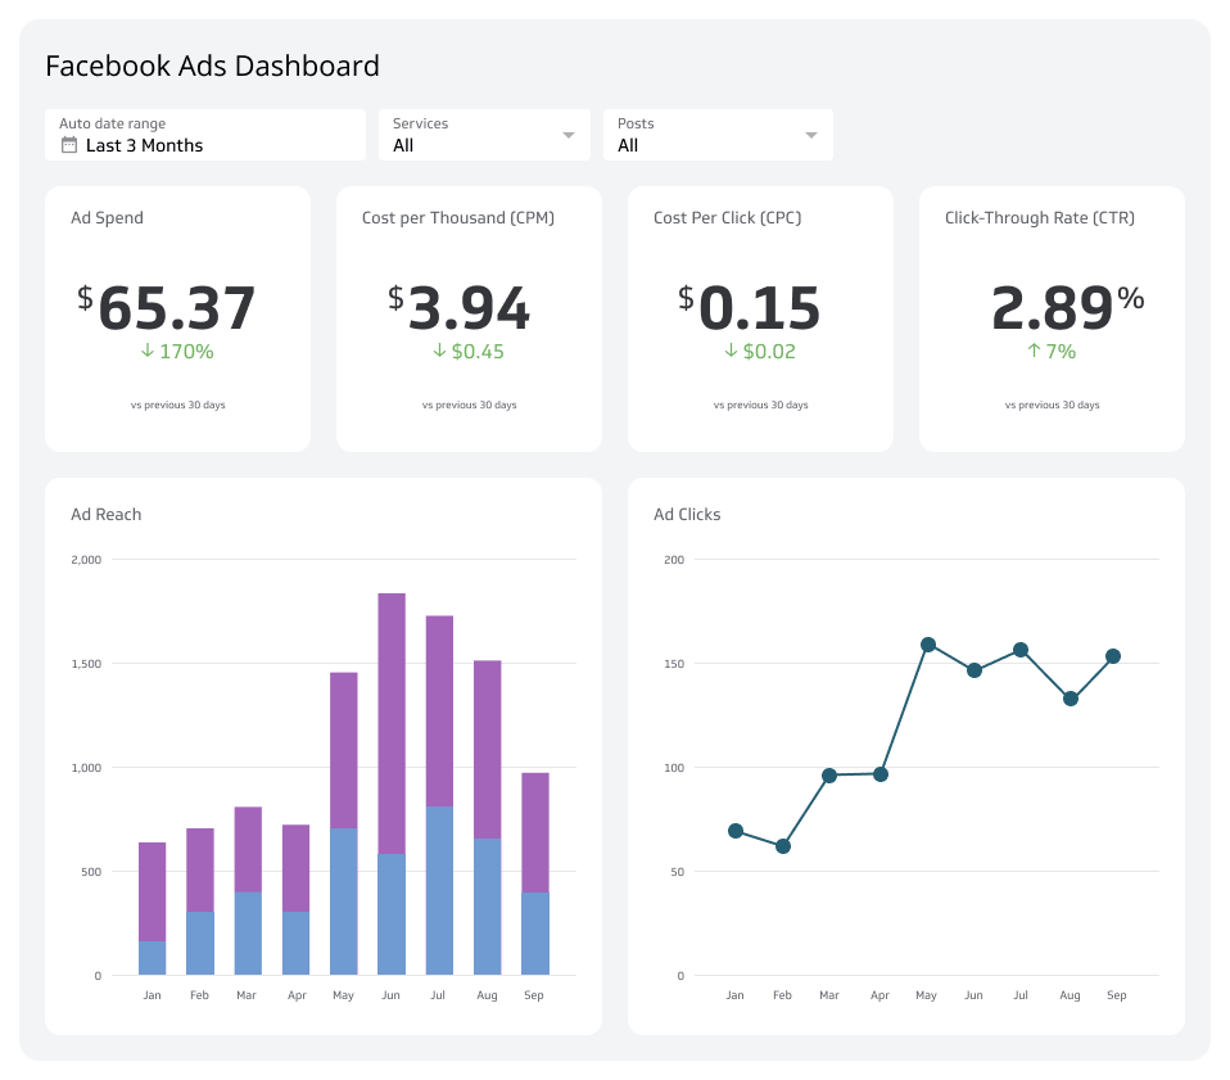
Summary charts
A summary chart displays a single numeric value. On an X analytics dashboard, a summary chart is a good choice for displaying your total follower count or number of reposts. Summary charts also support a comparison value (numeric or percentage) so you can track variances over time. The colour indicators — red or green — make positive or negative trends immediately recognizable.
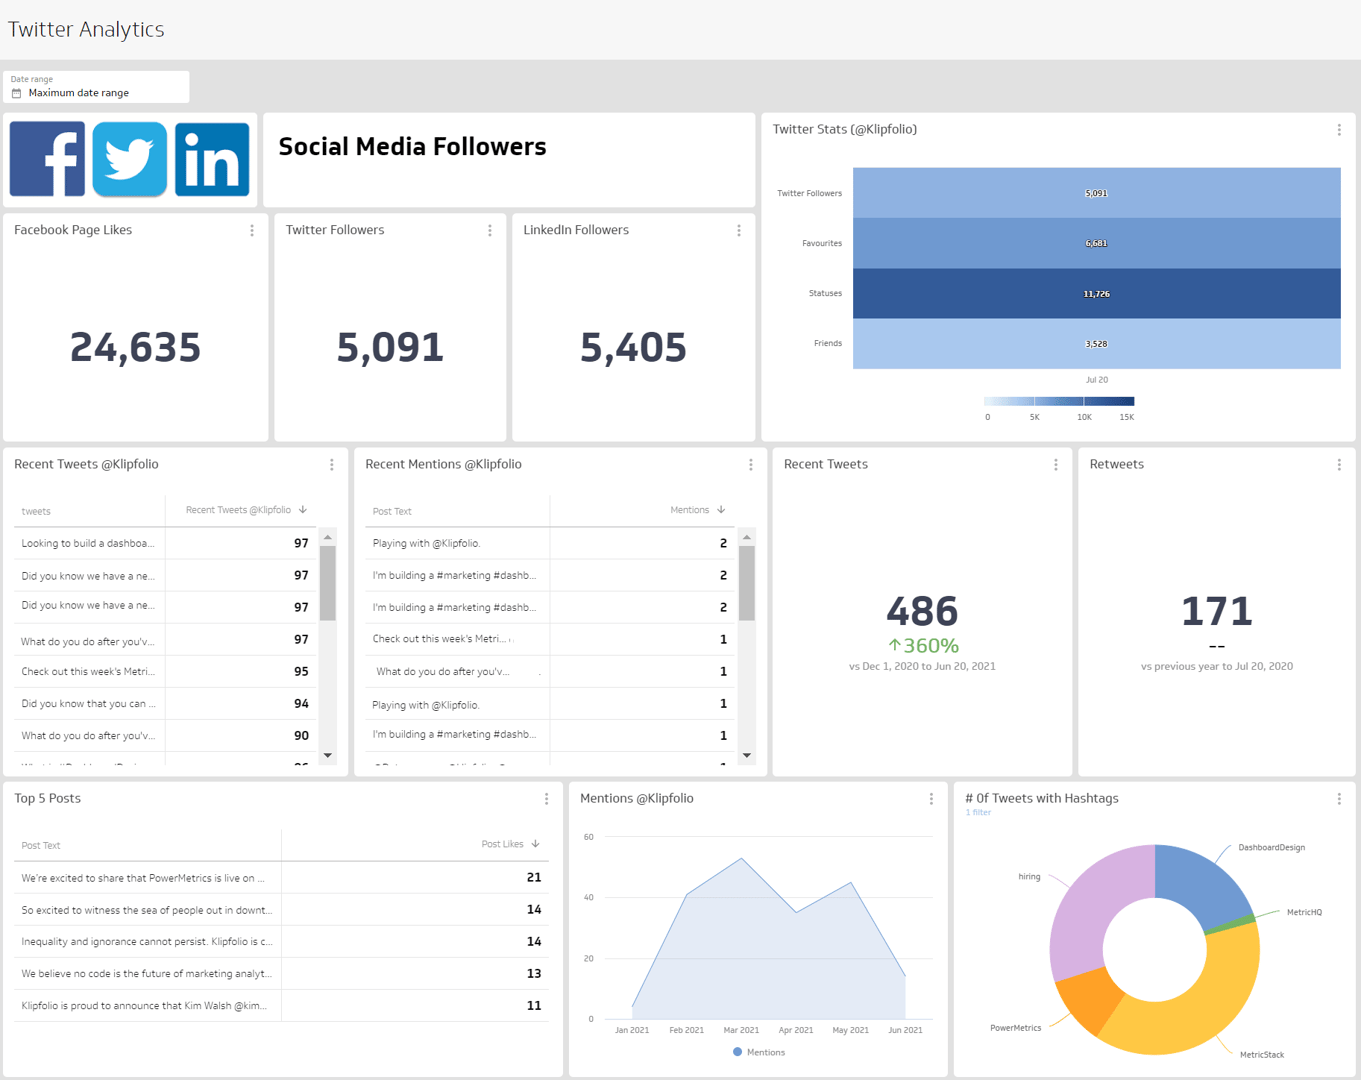
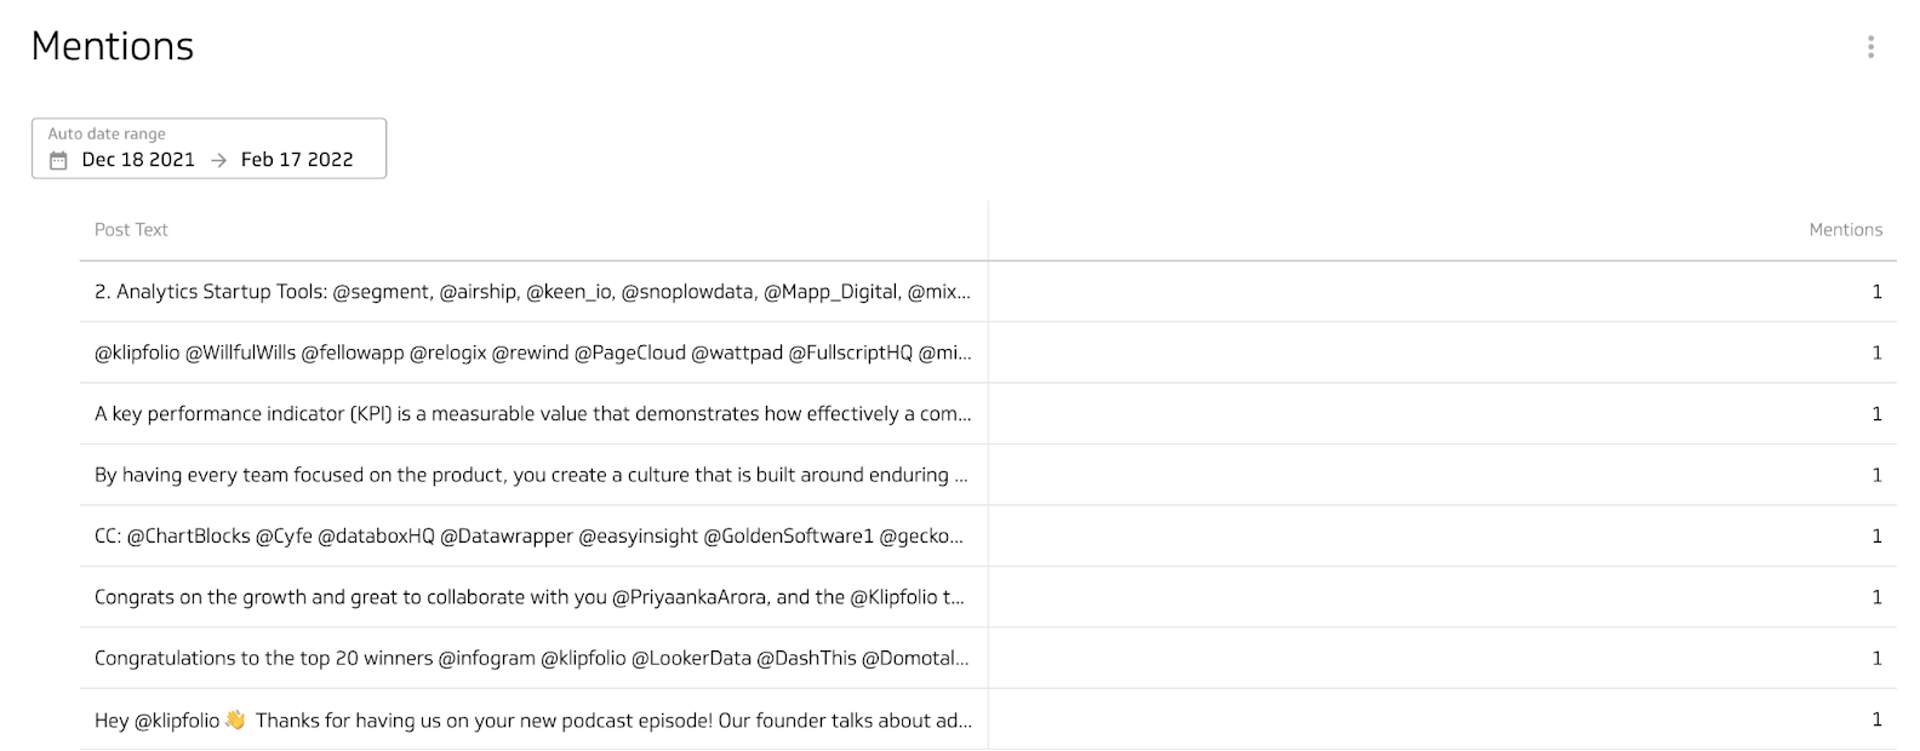
Tables
Table visualizations display data in rows and columns, similar to a spreadsheet. A list table, like the example below, displays your data — in this case, X mentions — in the order it was returned. You can also explore pivot tables and ranked tables. Tables work best with filtered data sets; narrowing your view to your top 10 mentions keeps the visualization clean and readable.
Benefits of an X analytics dashboard
X does not capture historical follower data by default. The platform surfaces a handful of metrics — impressions, profile visits, and mentions — but followers remain a key part of any social media strategy. The more you grow your audience, the more people you reach with your message.
You can work around this limitation by checking your follower count daily or reviewing the 28-day snapshots available in X's native analytics. A dashboard makes this easier. Track follower growth over time, compare across different periods, and identify trends without manual effort.
Dashboard inspiration for your X analytics
Knowing which metrics to track is one thing; designing a dashboard that surfaces the right information is another. Here are a few approaches to structuring your X analytics dashboard around specific performance goals.
Track your performance on an X analytics dashboard
Build a performance dashboard that looks at follower growth, post engagements, and overall account activity. This dashboard will help you answer questions like:
How many new followers did we gain this week?
How many people liked our posts?
How many reposts did we receive this week versus last?
Monitoring these metrics helps you identify what content resonates and where to focus your efforts.
Track engagement with your X content
Build an engagement dashboard that shows how users interact with your content. This dashboard will help you answer questions like:
What is the average engagement rate per post?
How many impressions did my posts receive this month?
How many link clicks did my posts get today?
Tracking these metrics helps you determine what content drives the highest engagement and how to sustain your growth trajectory.
Track the growth of your X account
Build a growth dashboard with the metrics that tell the story of your account over time. A growth-focused dashboard will help you answer questions like:
Is my follower count increasing?
Are followers and other X users reposting my content?
Are impressions, engagement, and link clicks connected to follower growth?
These metrics help you develop and refine your social media growth strategy.
What does success look like with an X analytics dashboard?
An X analytics dashboard is a reporting tool you can share with your team and decision-makers to gain insight into social media performance and engagement. A well-designed dashboard communicates clearly to everyone — regardless of department or data experience. That accessibility is a sign of good design.
X analytics reflect your social media strategy. Use the data on your dashboard to adjust your approach, spot engagement trends, and understand how your audience behaves. When your dashboard is connected to live data and shared with the right people, it becomes a tool for alignment — not just reporting.
At a glance
Focus Area
Social media performance tracking, engagement analysis, and follower growth monitoring for X (Twitter).
Metrics List
Followers, Following, Mentions, Media Likes, Reposts, Website Clicks, Impressions, Engagement Rate
Related Dashboards
View all dashboards