How to: Create custom metrics in PowerMetrics

Published 2022-07-19, updated 2023-08-31

Summary - Create a custom metric using a data feed connected to your data, like a spreadsheet, SQL query, or REST API. Once your data is added to a feed, you can create a custom metric to measure your business goals and KPIs.
We talk a lot about metrics at Klipfolio. We’re passionate about metrics and how you and your team can use them to drive better business decisions.
Metrics are a core part of PowerMetrics. The platform enables people like you to create metrics, prepare and model data, build dashboards and reports, store data and its corresponding history, and share insights with your team.
PowerMetrics offers three ways to create a metric: instant metrics, custom metrics, and calculated metrics.
In this article, I’m going to dive into custom metrics. But be sure to check out this resource for more information on metrics and this resource on calculated metrics.
First, let’s start with the basics.
What is a metric?
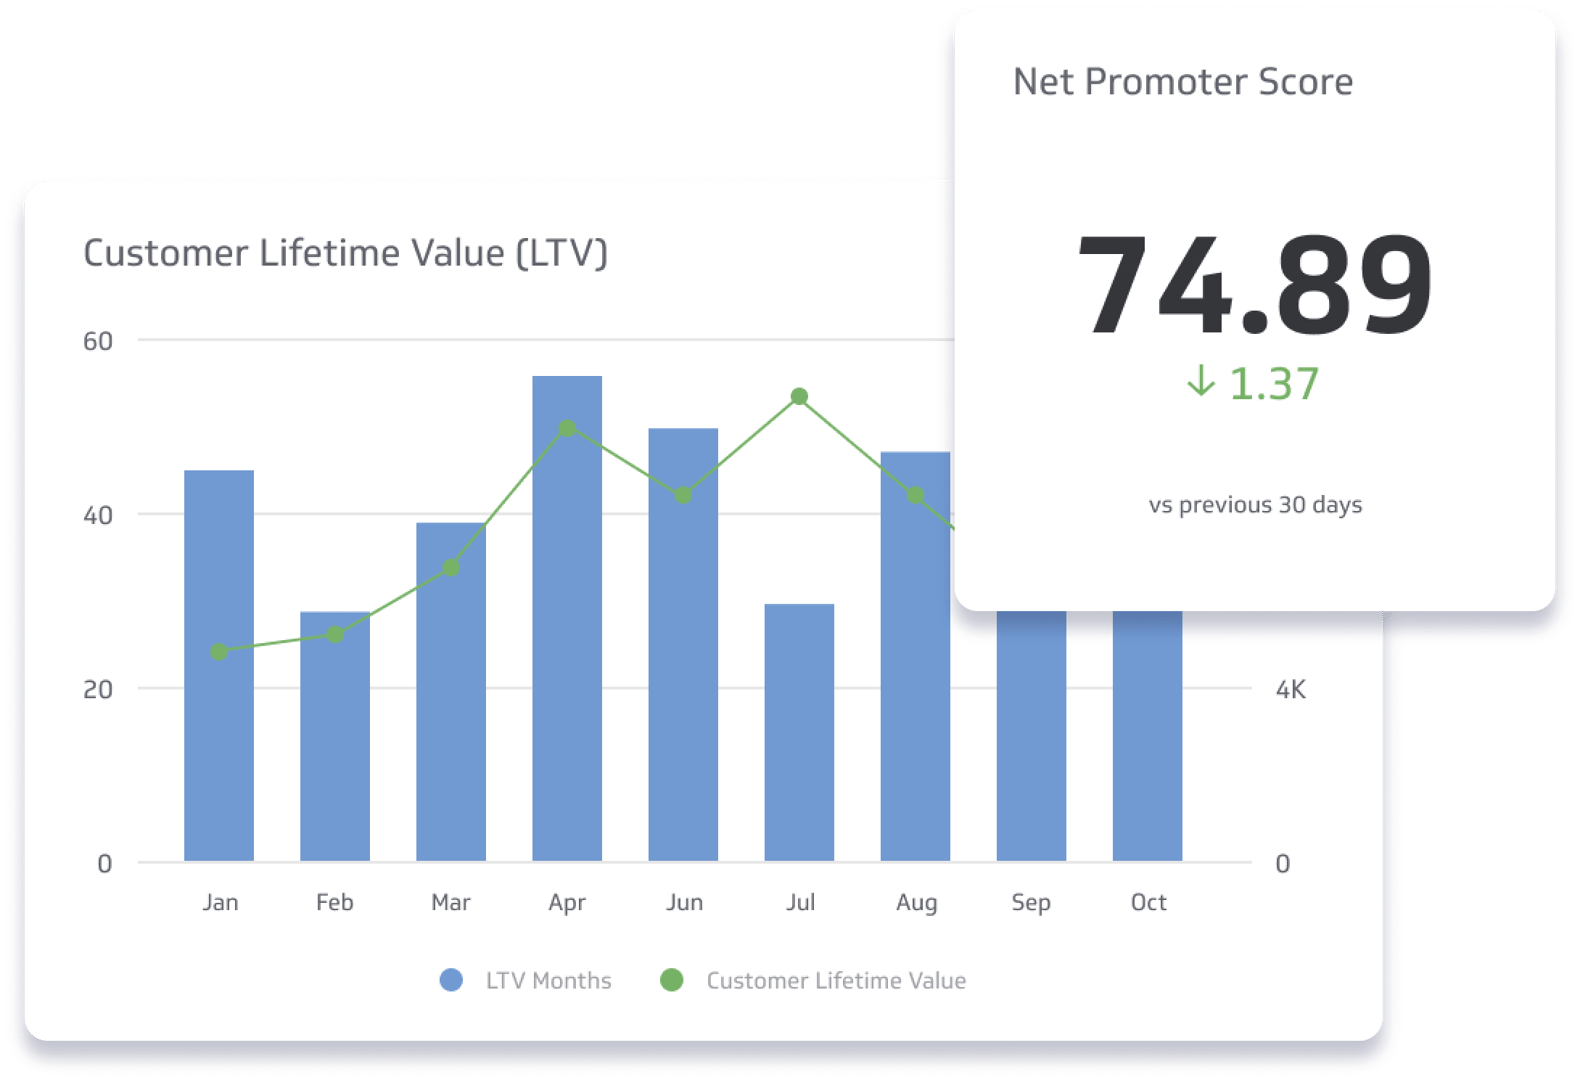
A metric is a measurable value that represents performance, success, or progress towards a specific goal or objective. Metrics also store the history of the value over time and can be visualized multiple ways.
For example, let’s say you want to track your Monthly Recurring Revenue—how it changes month over month and which vertical has the highest amount of new subscriptions or expansions. To create a Monthly Recurring Revenue metric, you would take your MRR data from your original data source (like a spreadsheet or accounting software), model your data into a data feed with the dimensions you need, and create a metric using a calculation. Now that you have a quantifiable metric that you can use to monitor performance.
Metrics visualize your data, making it easy to analyze and understand versus sifting through a spreadsheet and doing back-of-a-napkin math.
I mentioned earlier that PowerMetrics offers three ways to create a metric: instant, custom, or calculated. Let’s take a look at custom metrics.
What is a custom metric?
Custom metrics are true to their name—a custom metric built using your own data feed. A data feed is the channel between your service (let’s say Google Analytics, for example) and the custom metric that you’ll create using that data.
By comparison, our instant metrics use pre-built connectors to third party services like HubSpot or Stripe, and we auto-model the data for you into a data feed.
Custom metrics require you to pull your data into PowerMetrics from something like a spreadsheet, SQL query, or REST API. Then you can create a data feed which you can use to create custom metrics.
Once you’ve created your data feed, PowerMetrics automates the data collection and starts to stack up your data history, but more on that to come later.
What is a data feed?
PowerMetrics requires a data feed in order to create a metric. You can do this step in our data feed editor. Data feeds ensure that your metric data is standardized in order to be used effectively.
Think of metrics like building blocks. For metrics to fit together in order to compare time periods or dimensions, they need to have the same foundation. A standardized set of metrics gives you and your team a rich analytics and reporting system.
A data feed is a cleaner, simplified version of your data that is easy and quick to work with. When you model your data in a data feed, you define and manipulate the data you want to include by applying formulas or data formats, like text, number, percentage, currency, date, or duration.
Once your data feed is set up, you can create a metric with it. It’s worth noting that a data feed can be used to create multiple metrics—there’s no limitation to how many times you can use your data.
How-to create a custom metric
Let’s look at each step to creating a custom metric in a bit more detail.
1. Connect your data
In this step, you’ll gather your data, whether it’s an Excel spreadsheet, an SQL query, or data you’ve exported from a cloud application. Ideally, you should try to make sure there is a relevant date with a timestamp that you can add to your data feed, too. Once you have it ready to go, you’re ready to move into the second step: editing your data feed.
2. Finalize your data feed for use in your metrics
In this step, you’ll bring your data into our data feed editor. Here you’ll be able to further refine and format your data, like removing null values or fixing text discrepancies. You can also use formulas in the data feed editor to populate additional columns in your data, or merge the feed with another for a richer data set.
When you’re editing your data feed, it’s important to consider the metric you’re planning to create with it. Does your data feed contain the right information, like numeric values you want to track or records to be counted? Are all of the dimensions you want to use in your metric available in your data feed so you can segment your data and look at it from different perspectives? Think about the columns you need, the dimensions you want to filter by, and the time dimension and make sure it’s included in your data feed so we can store it in your metric.
A few other tips to be successful with the data feed editor:
- Don’t over prepare your data. You want to have access to the flexibility and customization available in PowerMetrics
- Use the unpivot function to convert data from a pivot table format to a list table
- Use formulas to optimize your data, like grouping it into categories to simplify your metric
- Group related columns, like first name and last name, into combined dimensions, like a name column, for clarity and ease of use
3. Create a custom metric
It’s time to create your metric. Here you will select your metric value, segmentation, and date and time from the data feed, as well as define the historical data, date handling and display settings for your metric.
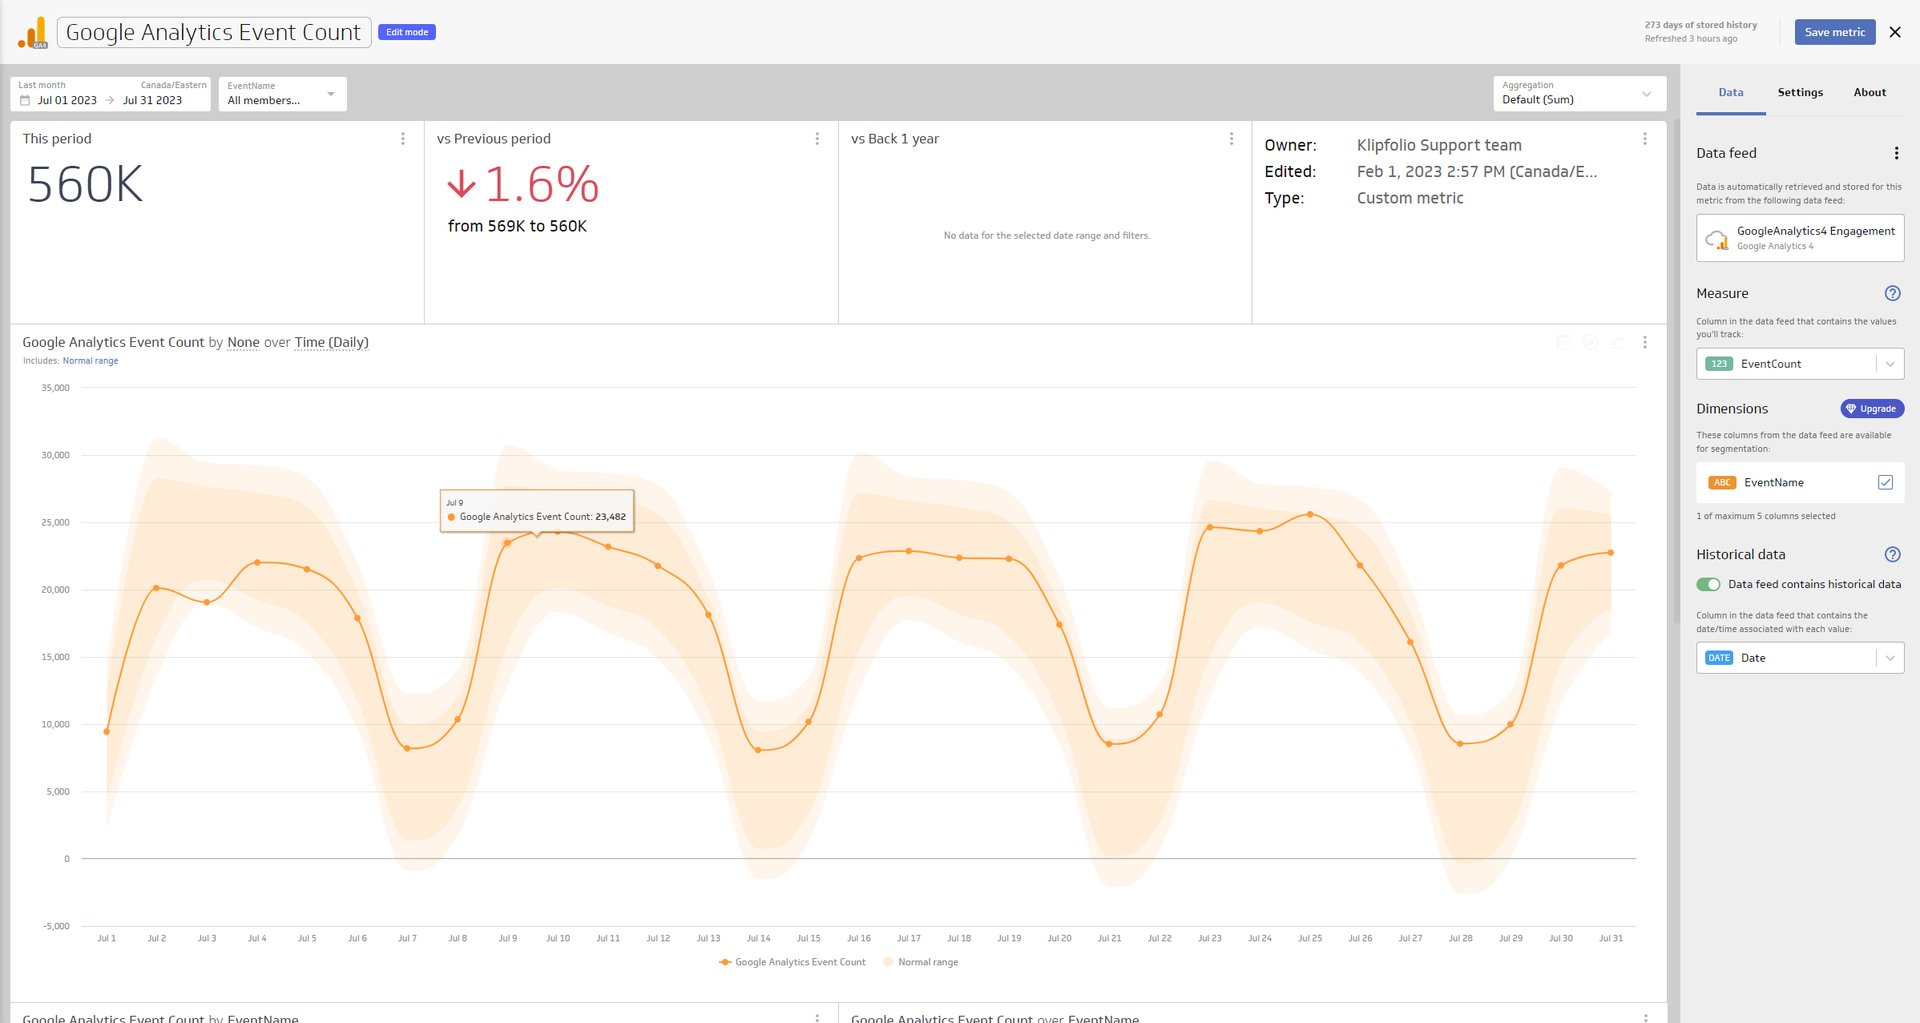
Historical data settings allow you to select the column from your data feed that contains the date/time associated with each metric value. Date handling settings will allow you to choose whether to use all values in your data feed for your metric, or to only use the latest values in a given period. Display settings is where you name your metric, choose the data format, like numeric, currency, percentage, or duration, and optionally choose to show your data as cumulative or set a favourable trend.
Other features for custom metrics
Configuring data feeds is a core feature of custom metrics, but there are a few others that I want to touch on, too.
Data history and storage
PowerMetrics can store up to 10 years worth of data for you. And, depending on your plan type, you can access a date range window that displays anywhere from two months to more than three years. Data history and the ability to compare metrics across time periods is key to making data-driven business decisions.
Traditional data storage software, like databases or spreadsheets, requires manual data entry or configuration, which can be time consuming to regularly update. Once you configure a metric in PowerMetrics, your metrics will pull in and incorporate your new data automatically, so you can always have the most up-to-date information at your fingertips.
PowerMetrics also offers backfill. Instant metrics have backfill auto-enabled, which means when you create a metric, we go back and automatically retrieve up to six months of data. Backfill is available for custom metrics, but would require you to pull the custom data in from your original data source.
And, if your data feed doesn’t have historical data, we start recording it for you as soon as you create a metric with that data.
Query Builder
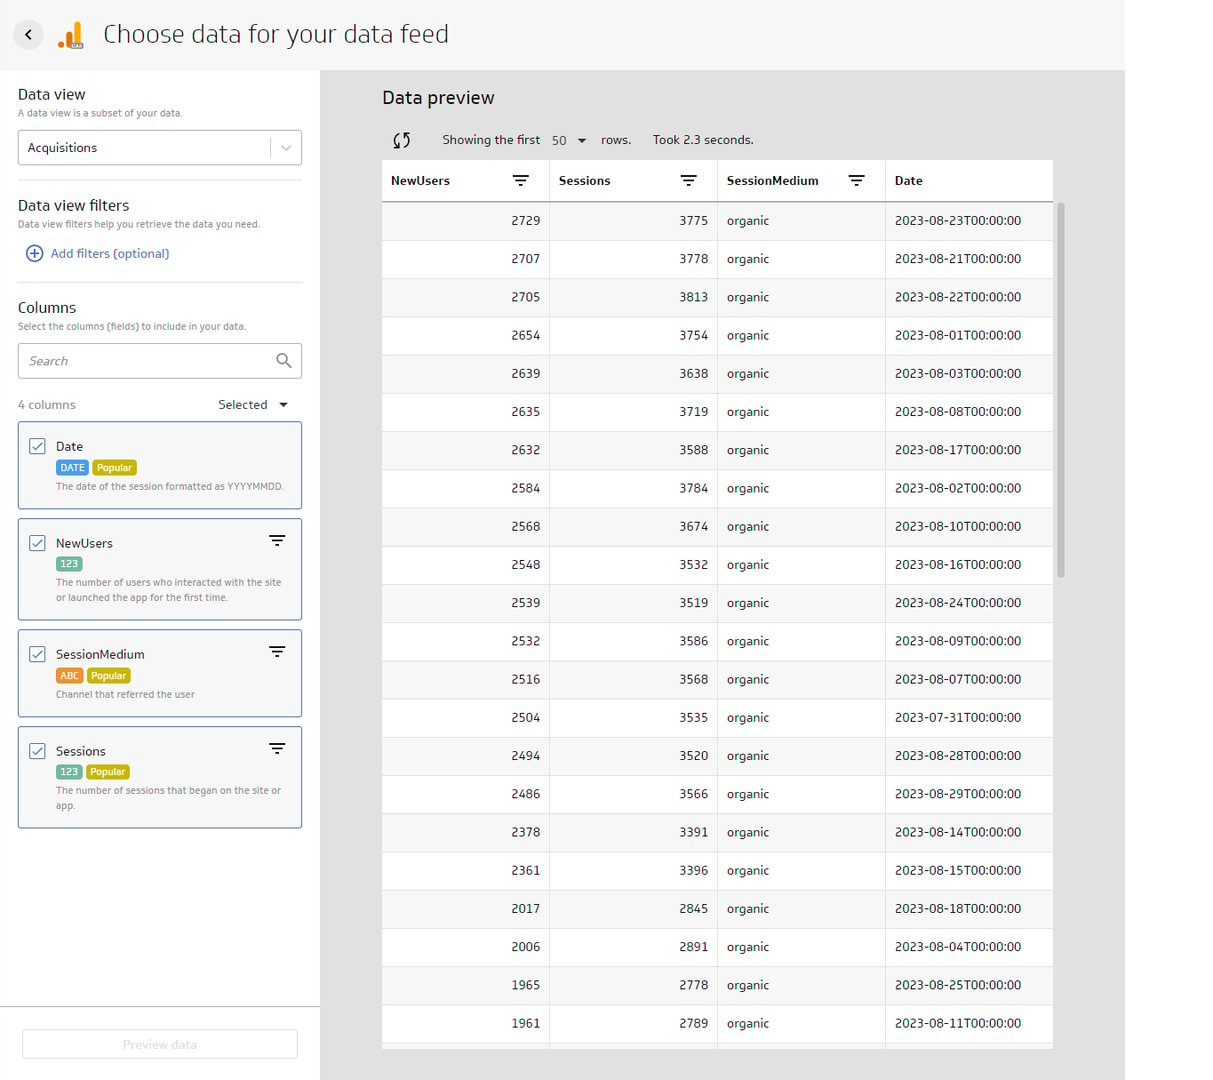
Query Builder is a powerful tool that lets you access your custom data within the supported data services that you connect to. Within Query Builder, you can connect the tables and fields in your data.For example, you could connect your Google Analytics 4 data, select the Acquisitions table, and then go on to select the columns like New Users, Sessions, and Session Medium to be used in your data feed. Now, you can query that information within the Query Builder interface to pull that data into PowerMetrics. You can preview it, add additional columns like a date to give your data a shape, or add optional filters if the API allows it. Then, you can create a custom metric from the data feed.
It’s a metrics-based approach to reporting and analytics
Metrics are dynamic and enable you to set up your dimensions, aggregation types, history, and trend indicators, giving you complete control from start to finish. You can also add goals and notifications to all metrics to monitor your progress, anywhere, anytime. Build, manage, and explore your metrics to match your skill level, technical expertise, or data goals—all in PowerMetrics.
Related Articles
Metrics provide rich context for better AI: Introducing the new PowerMetrics AI experience
By David Mennie — June 21st, 2024
PowerMetrics - New data warehouse integrations and Cube semantic layer support
By David Mennie — June 14th, 2024

Partner Case Study: Eyeful
By Cathrin Schneider — May 21st, 2024

Partner Case Study: The Project Booth
By Cathrin Schneider — April 11th, 2024