Why metrics are the key to confident decision making

Published 2023-07-31, updated 2023-11-27
Summary - A metric describes both a data structure and a business concept. More and more analysts are discovering that using a well-defined metrics framework supports faster, more reliable decision making. In the world of big data, which often lacks meaning and structure, metrics are the key to success. The right amount of data, self-serve analytics, monitoring data over time, understanding and reacting to change, effectively combining disparate data sources in reports, and visualizing data for every team – Metrics include all this and more, enabling you to understand and gain insights into your data and business performance.
The concept of metrics is gaining popularity in the analytics and business intelligence world. Metrics help data teams manage large amounts of data and make it easy for business teams to understand and access the information they need for confident decision making. However, some data experts may not realize the benefits of metrics when compared to traditional models. While there’s some good technical content out there about metrics, such as this article by Airbyte, our blog aims to help you understand what metrics are and why using them to measure and track your data will help you make the best business decisions.
How metrics are different from traditional BI models
A metric is a data structure that refers to a single, meaningful, measurable business concept. A metric includes the history of that value and the categories that the value can be broken down into (also called dimensions).
Let’s use a “Revenue” metric as an example. In the table below, you can see revenue by geography, department, and customer (the selected dimensions), for today’s date (current data), and for previous dates (historical data). Note that it doesn’t contain any data related to expenses – this would be measured using an “Expenses” metric. Read more about the differences between metrics, measures and KPIs.
| Date | Revenue in $ | Geography | Department | Customer |
| Jul 14, 2023 | $4000.50 | United States | Sales team A | Company D |
| July 12, 2023 | $15,100 | Germany | Marketing | Company C |
| July 10, 2023 | $32,000 | Canada | Sales team A | Company B |
| July 10, 2023 | $400 | Italy | Sales team B | Company A |
A metric is not only a data structure, it’s also a business concept. Metrics are created because they’re meaningful to a business. What the metric measures and how the data is processed is carefully considered and agreed upon by the organization. As such, metrics represent not just clean data, but also deeply meaningful and understood information.
Unlike metrics, traditional BI models typically contain multiple sets of values and dimensions with few or no built-in query rules. Rarely optimized around a business concept, they provide a flexible collection of data and leave it up to the consumer to decide what to do with it and how to query from it.
The consistent structure of a metric makes it easier to solve challenges that traditional BI systems, which tend to be optimized around sets of data or large multi-value models, struggle with. Let’s take a look at the solutions metrics provide and why they’re the secret to confident decision making.
Metrics are optimized for decision making
Unlike traditional data models, metrics are chosen and defined by a business because they have actionable meaning and are a necessary part of the decision making process within that organization.
Metrics often have industry definitions based on input from experts in the field. These definitions tell you how to react when a metric trends in specific ways and how to know if the values you’re seeing are normal or unexpected. Some companies develop their own unique metric definitions as part of the secret sauce of their business processes. Either way, an organization’s decision makers have a shared understanding of how to react to metric changes in specific circumstances.
This is in contrast to more traditional analytics approaches that rely on data experts and decision makers to dig into the data models and query them in different ways to uncover the information they need (a time consuming and often inconsistent method). While this may still be required for complex questions, with metrics, the decision making process has been thought through in advance, allowing businesses to make many decisions faster and with more confidence.
Metrics include the right amount of information
There’s such a thing as too much data! Messy, irrelevant data creates noise and inhibits effective decision making. Different versions of the same data can make it difficult to know which is correct. No matter how much data you have, there are times when your business team can’t access the information they need. All of these factors can lead to confusion and indecision.
Let’s use a practical example to show how metrics include only the information you need - nothing more, nothing less. When driving a car, the dashboard includes a few well-defined and understood metrics – speed, fuel level, and engine temperature. We know instinctively that if the speed is too high we slow down, if the gas is low we stop to fill it up, and if the engine overheats we stop the car and call for service. We can make quick, effective decisions using the information that’s provided to us. This wouldn’t be possible if the car gave us every available data point collected from all of its engine’s sensors. When you apply metrics to your business you benefit from the same decision-making paradigm, helping you react appropriately with access to the right amount of clear, well-understood data.
Metrics enable self-serve analytics
Traditional analytics teams often create reports based on the needs of the organization however these reports tend to be static in nature. To make informed decisions, follow-on reports are often needed from the data teams, requiring additional time and resources.
Conversely, with metrics (which contain the dimensions and context relevant to a single set of values) information is available immediately to all stakeholders. For example, if the “revenue” metric drops unexpectedly, using a BI tool like PowerMetrics, it’s easy for a decision maker to dig into the metric to understand what happened and why. Segmenting the data by geographies, filtering by customer groups, or comparing different time periods are logical first steps when examining the metric from different perspectives. The metric is a lightweight self-serve analysis artifact centred on a single business concept. Read more about the metric-centric BI approach within the context of the modern data stack and its benefits to business and data teams.
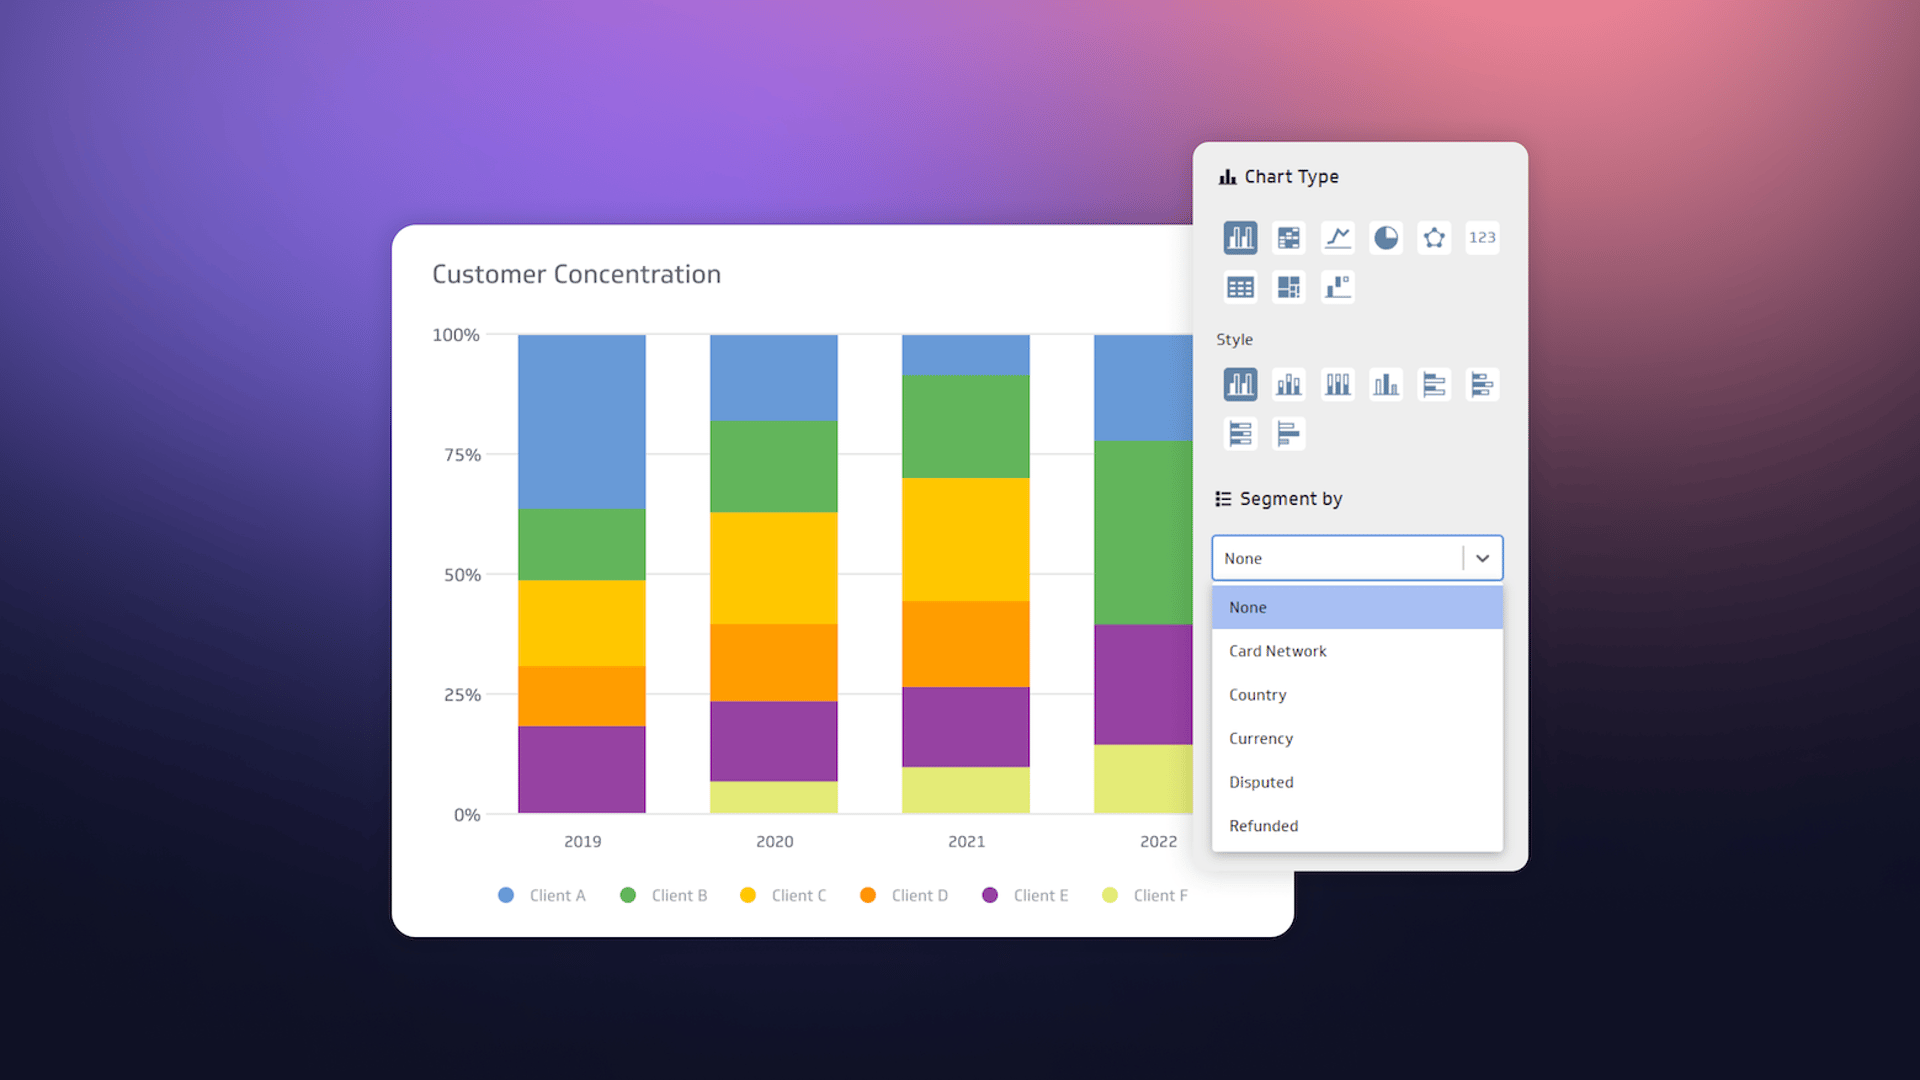
When analytics tools are purpose-built for metrics consumption, they make assessing your business performance intuitive and straightforward. In this example, business teams can easily compare and analyze different customer segments to better understand the “customer concentration” metric:
Metrics formalize the contract between an organization’s decision makers and its data teams. The decision makers describe what information they need in a metric and the data experts determine how to fulfill their request. The way a metric gets its data may change, as long as it continues to meet the metric’s definition. As a result, business teams can be confident their metrics will always measure data in the way they expect.
Metrics show change over time
Many business decisions rely not just on the current data, but on how that data has changed over time or how it’s currently trending. It can be difficult to see and understand changes in data using traditional BI because the data set or model is usually replaced each time it’s generated. Data history is only available if it’s contained in the source data and has been specifically integrated into the BI model. This isn’t always trivial as many data services don’t expose historical values for their data. Even when historical values are available, it’s not always easy to combine or process the raw values to get the correct aggregated value for a time period.
Metrics contain historical data
In some metrics solutions, metrics have time built in whether or not time is available in the source data. PowerMetrics does this by storing each of the metric values with a date/time stamp, either by using the time values in the source data or by storing them at the time each value is ingested into the metric. Aggregation rules that determine how the values are combined from different time periods are built into the metric definition - so they’ll always be correct at query time. This behaviour makes it easy to query and visualize the data to show changes in the values of the metric. Users never need to worry about data sources not providing or storing historical data.
Metric goals and alerts help you react to change
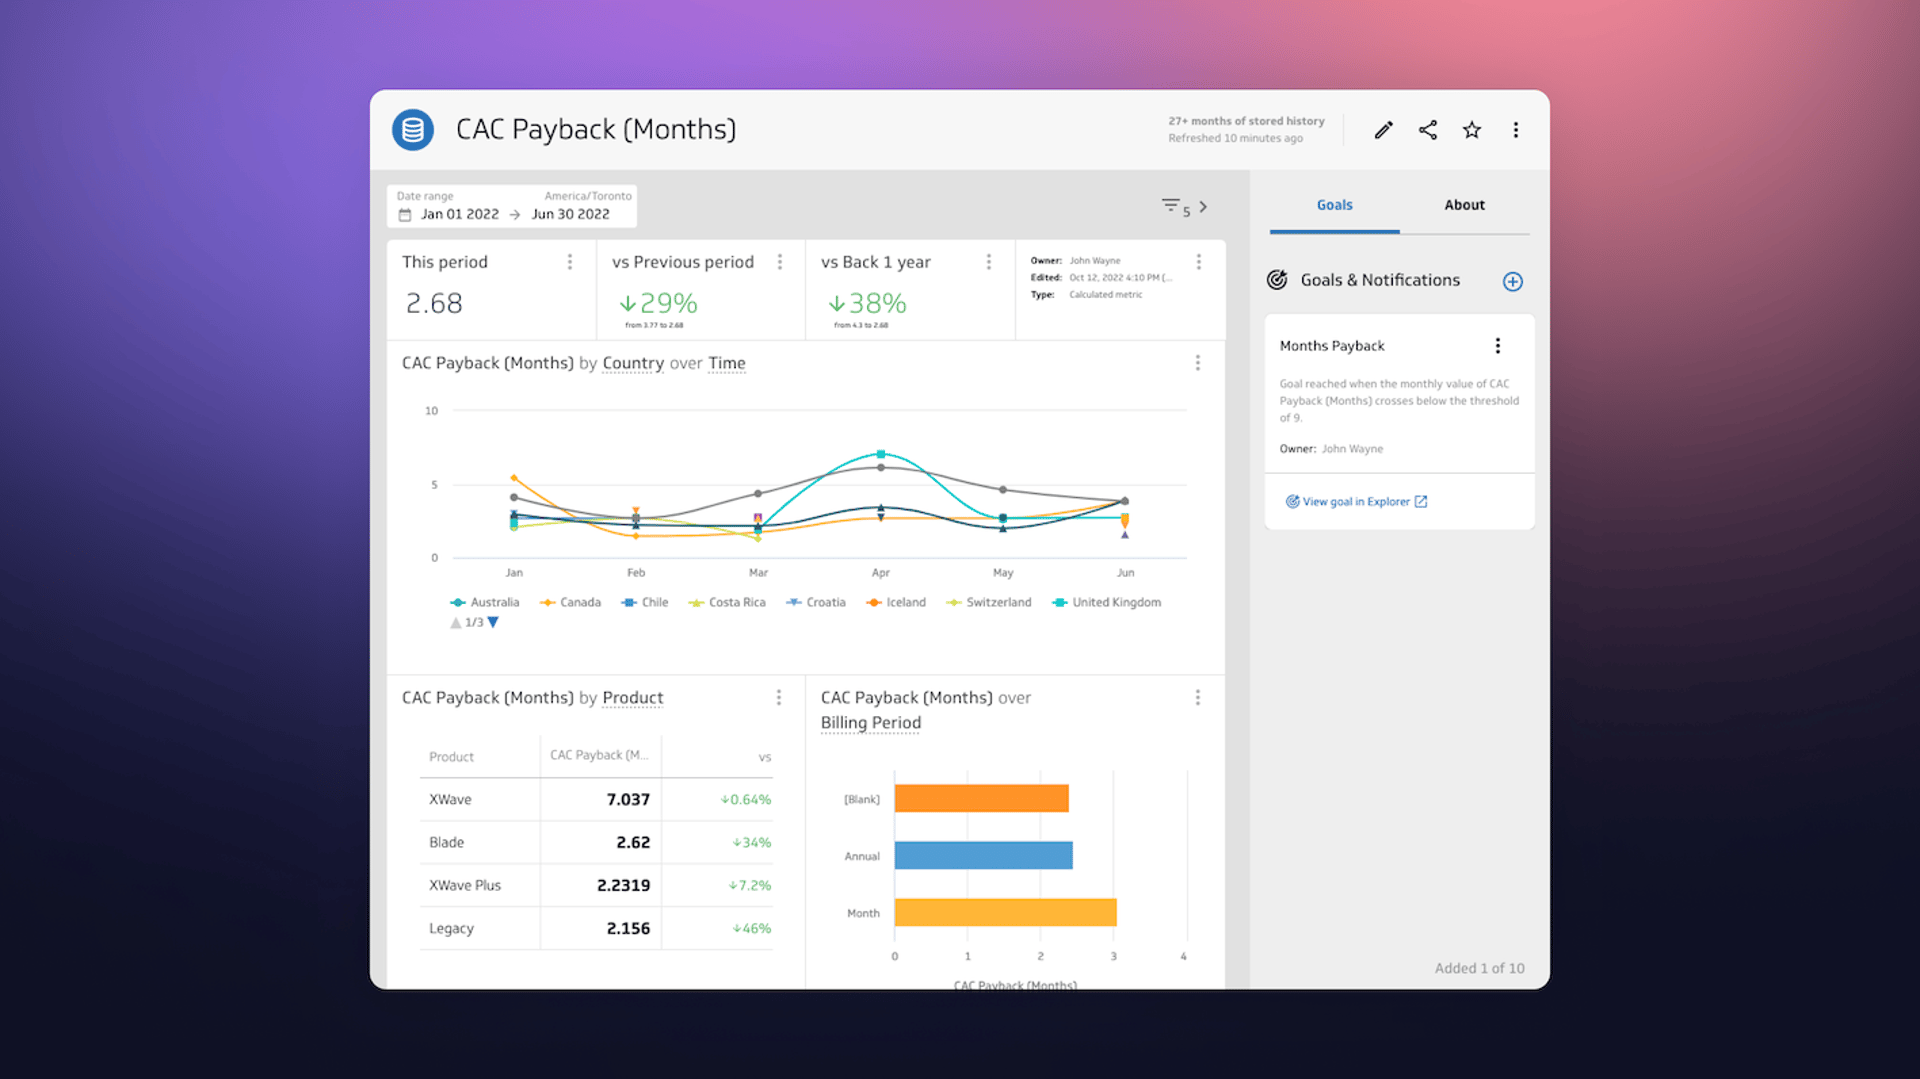
Metrics allow goals and notifications to be defined and set, optimizing the decision-making loop based on changes to metric values. Setting a goal signals the system to automatically notify users if the goal has been met or if it will not be met. This means you can monitor your business’ status without continuously, manually digging into data. Goals and notifications are a much-loved PowerMetrics feature, helping customers stay on top of the performance of their business metrics so they can react to change effectively.
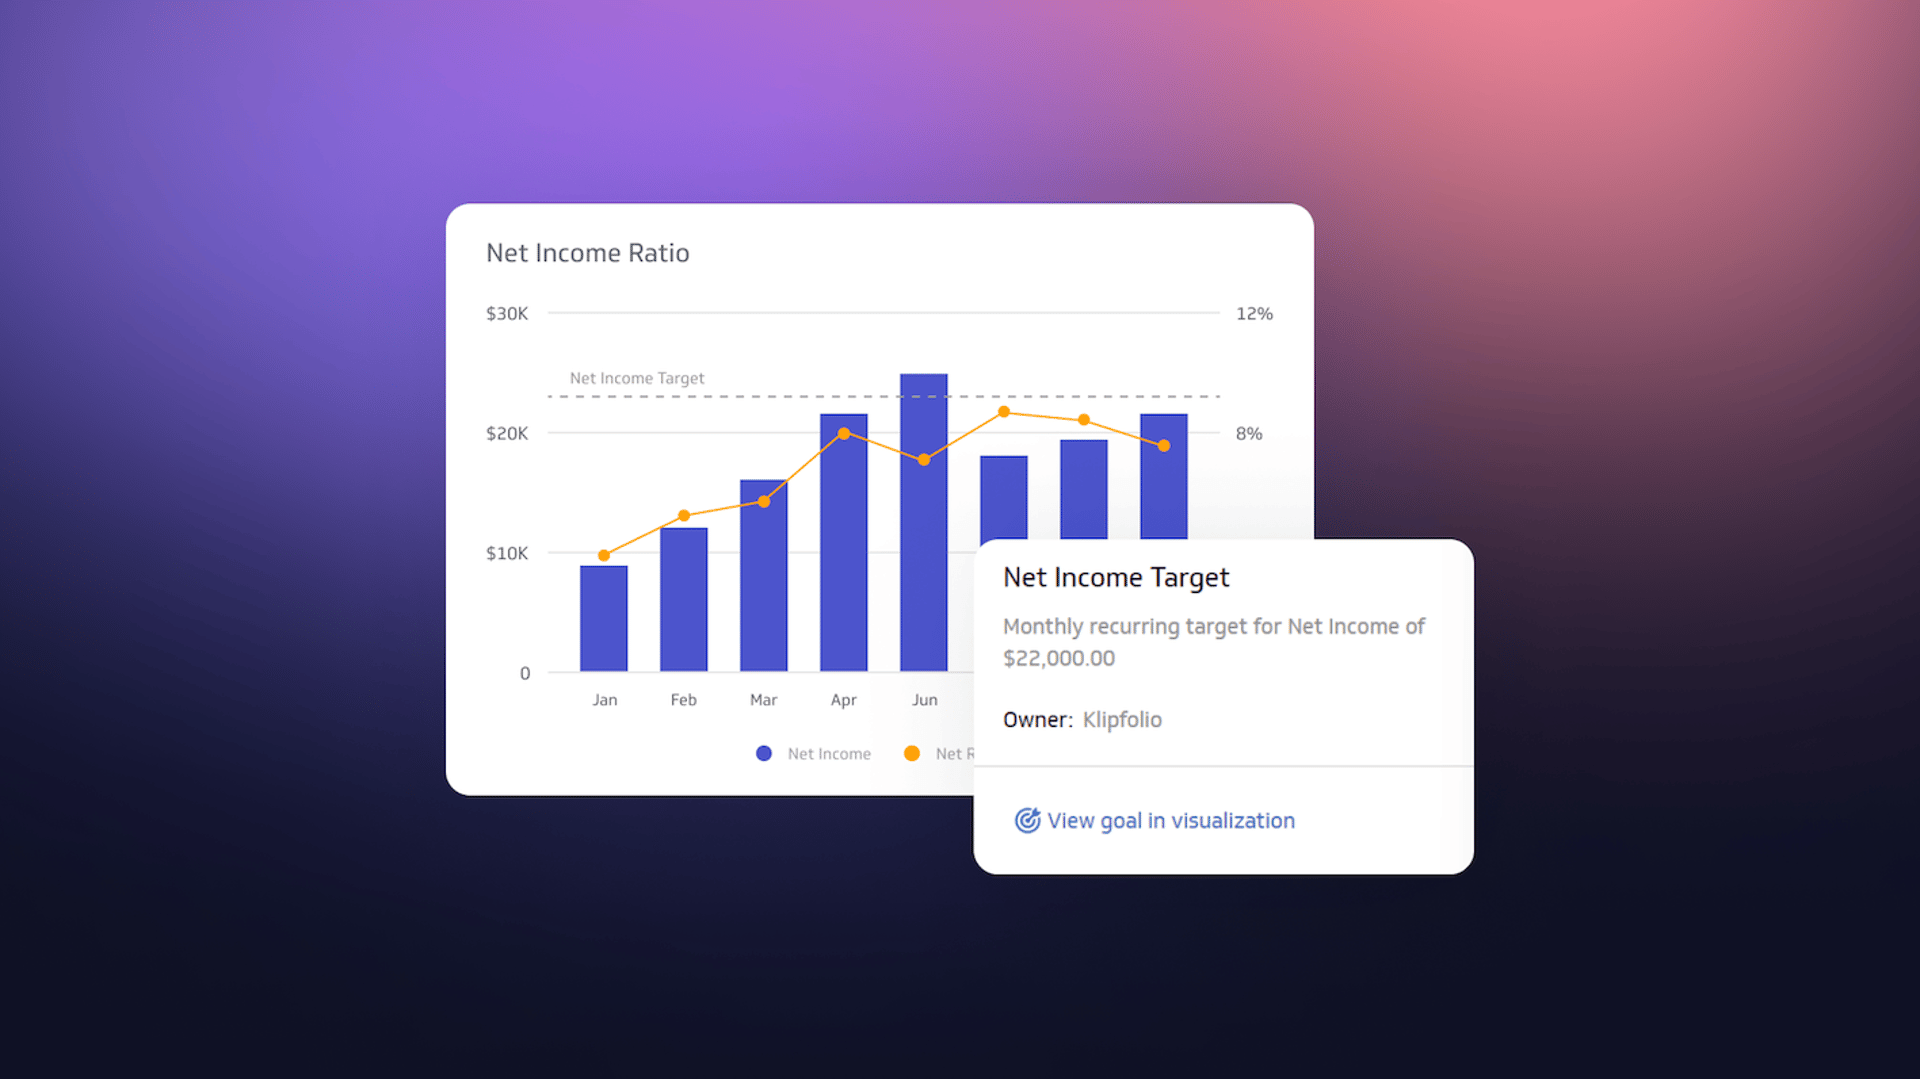
Applying a goal to a metric will notify the user when it has met the target or missed the mark:
Metrics effectively combine data from multiple sources
Most analyses require data from different sources. Given the single value nature of metrics, you might think metrics don’t lend themselves to building complex, multi-value, reports and dashboards. Nothing could be further from the truth.
Combining data from multiple sources into a single report can be challenging. You need to ensure each value in the report is queried correctly so that its context matches that of the report. If you don’t do this, the report can be misleading or inaccurate. For success, the report author needs to define all query elements.
Accurate multi-value reports rely on clean, organized data. In traditional BI, data is usually organized in the data set, model, or directly in the report. Not only does this method require a lot of upfront work, it also increases the risk of errors being made and the burden of upkeep as the data changes over time.
By design, metrics help you build contextually consistent multi-value reports. Each metric is centered around a single set of values with a universal context. All metrics have time values. Using this common context, the system can relate values from different metrics. If dimensions are shared between metrics, they can also be used to relate values. This is true even when the metrics are defined from different sources of data.
Unlike querying a traditional data model or data set (that relies on the data being correctly organized in the source) joining data from multiple metrics occurs after the query is run on each metric. Since metrics have their data aggregation rules built in, the query results are always correct even as the overall context (such as filters or time scale) changes or new data is ingested. The system automatically combines the metrics, making building complex reports natural and intuitive. All you need to do is choose the metrics, filters, and breakdowns to include and metrics brings everything together into a consolidated, accurate report.
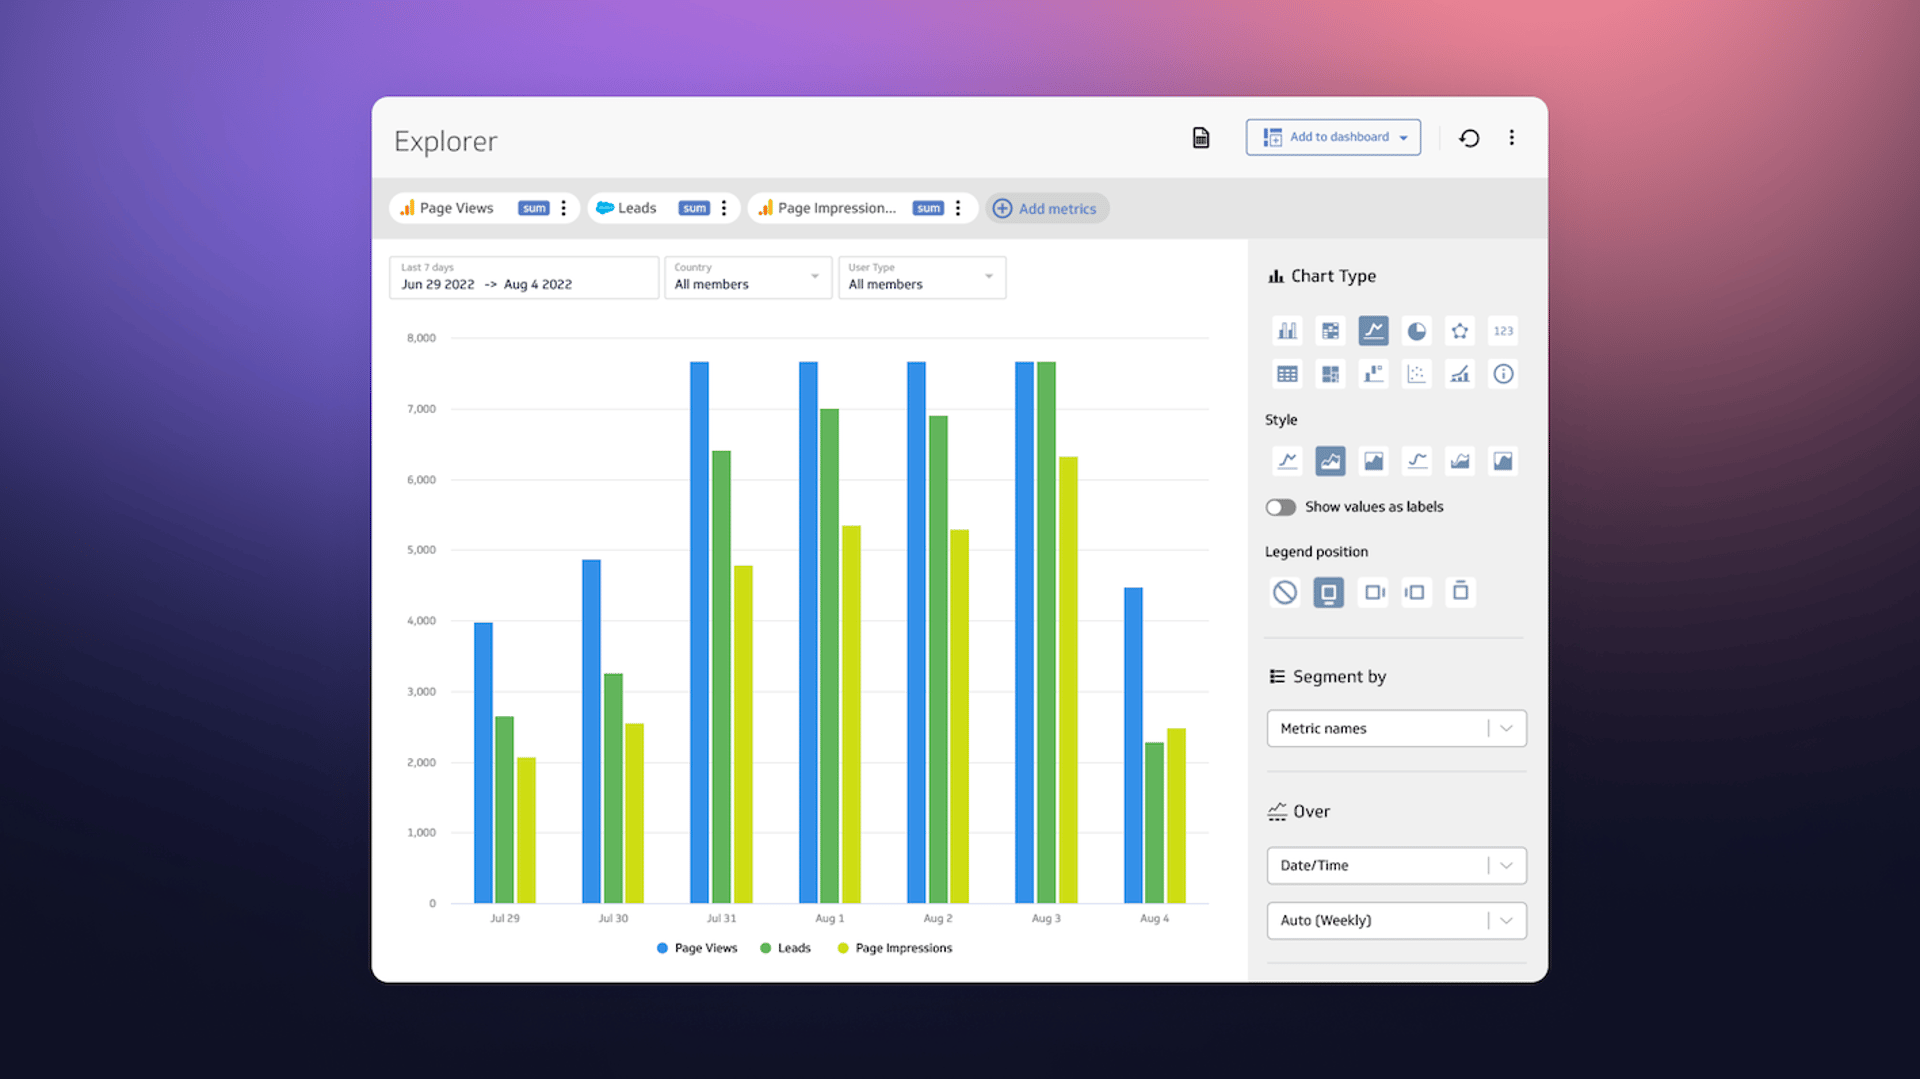
Combining different metrics in one visualization and multi-value reports is easy given the universal structure of metrics:
Metrics as building blocks for calculations
Metrics can be combined to create new metrics using a formula (see what PowerMetrics does with calculated metrics). This is possible due to the common structure within all metrics. The formula is applied to the results of each metric query. For example, if the “Profit” metric is defined as “revenue minus expenses”, then the January value for profit is the January value for revenue minus the January value for expenses. It’s as simple as that. Other operations, such as filtering by a particular country value, also work this way as the filter is applied to each of the metrics used in the calculation.
Visualizing your data with ease
Visualization is key to understanding data. Each type of visualization (line, bar, pie charts, etc.) surfaces different patterns in your data. So, it’s important to choose the right visualizations to convey the desired message in your reports. Configuring visualizations properly can be difficult using traditional BI tools because of the vast number of ways the data can be combined and set up within a visualization. Even second-generation BI tools with auto-visualization capabilities require you to hunt through data sets, put the correct data within the visualizations, and define aggregation and grouping settings.
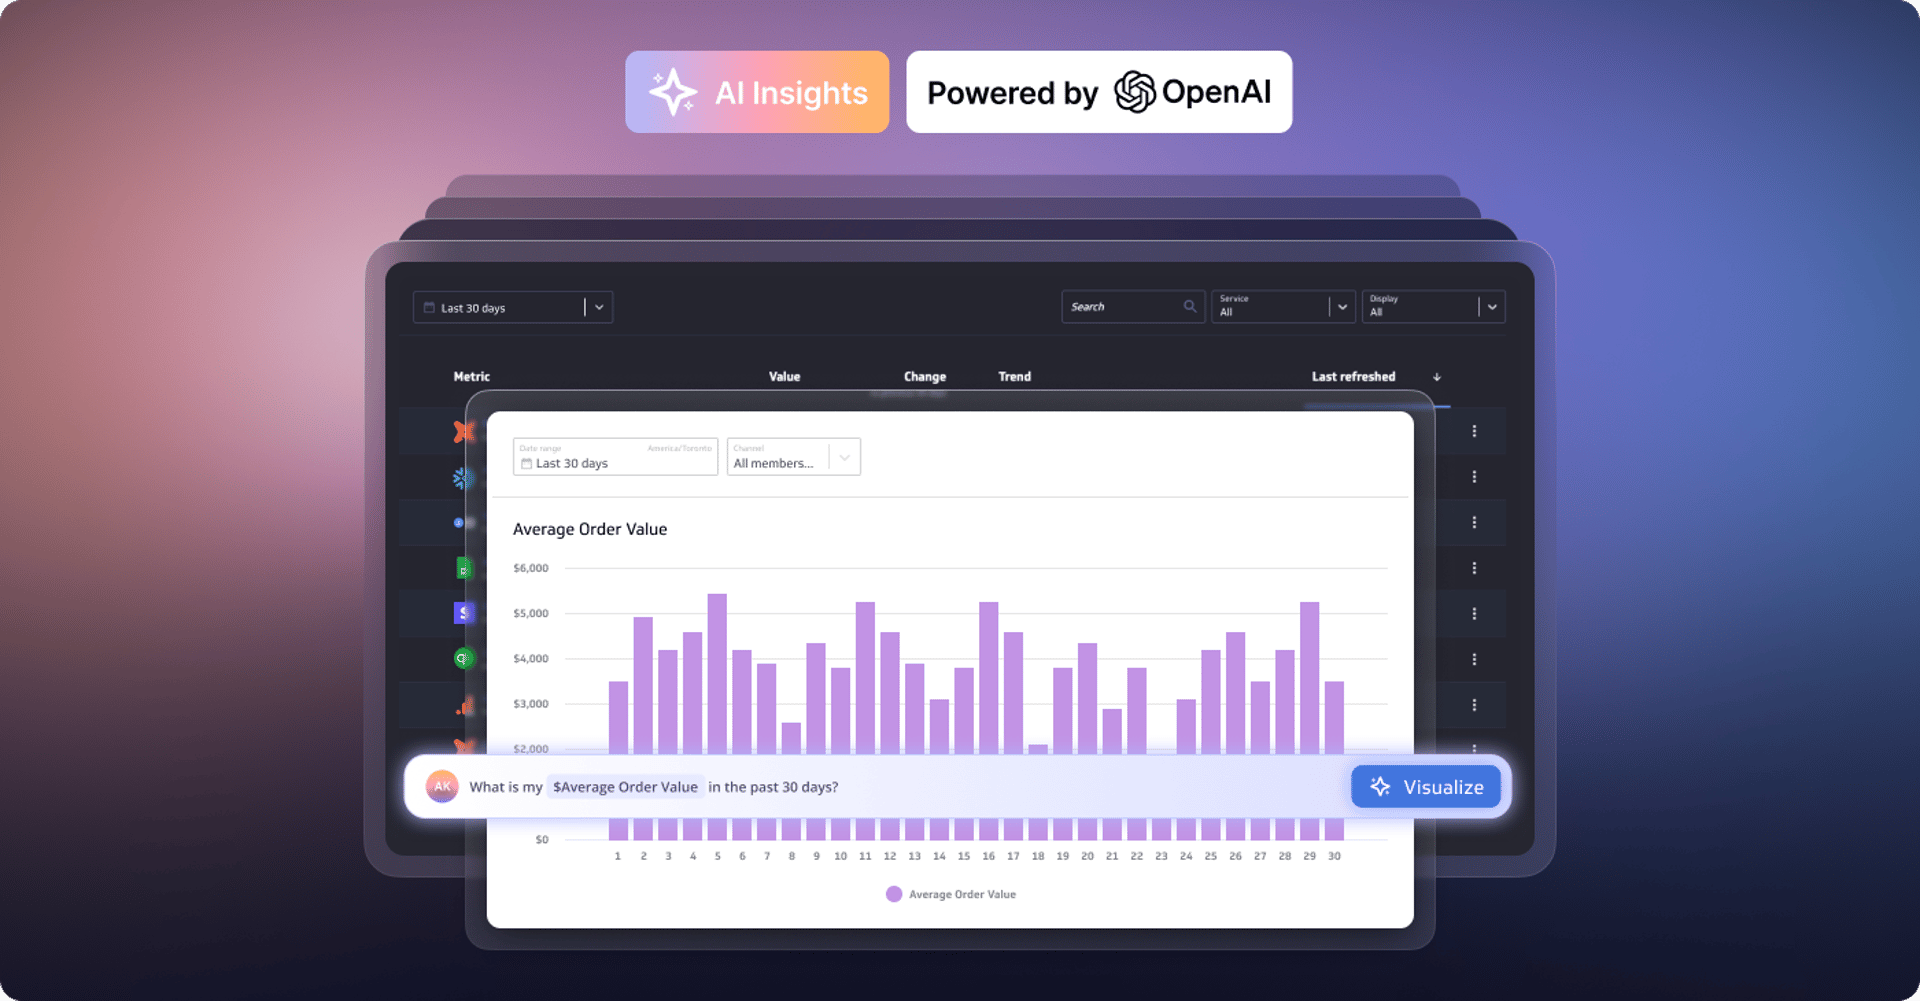
Alternatively, the focused nature of each metric means that when you choose a metric, you’re also choosing the data to be visualized. After selecting the metric, all you need to do is choose the desired visualization type (or use an automatically-generated default as mentioned below). Then you can decide if you want to further restrict the context using filters or breakdowns. Query details, such as the grouping rules and aggregation types, are built into the metric so don’t need to be defined in the visualization. You choose what data to visualize and how you want to see it but don’t have to worry about configuring the data.
PowerMetrics is purpose-built for metric visualization and analysis. You see the whole picture with automatically-generated metric homepages, where a single metric displays using up to seven different visualization types. Fully customizable in just a few clicks, it’s a great starting point for learning about your metric. Again, all of this is possible due to the innate universal structure and focused purpose of each metric.
An automatically-generated metric homepage is a curated overview of a metric’s performance. It shows the metric’s current value, historical performance, segmentations and multiple chart types:
Data analysis for all your teams
Extracting meaningful insights often means deep diving into your data. This level of investigation requires expertise to build analyses and know how to interpret results. Consequently, many organizations have specialized roles, such as data scientists, to perform analysis on their data. Because data is often scattered throughout the organization and isn’t always clean, data scientists end up spending a lot of time finding, cleaning, and transforming data to prepare it for analysis. This is not only time consuming but can also be error prone.
However, when an organization uses predefined metrics, there’s a single place to go and get the data. The results returned from a query against a metric are clean and have a predictable structure meaning the data does not need to be transformed to use for analysis. This means data analysts can focus on what they do best – analyzing results and uncovering insights. A metric-centric analytics solution, like PowerMetrics, takes this benefit even further. Its code-free analytics layer allows business users and decision makers to analyze metrics, freeing up time for the data analytics team to answer new and complex data questions.
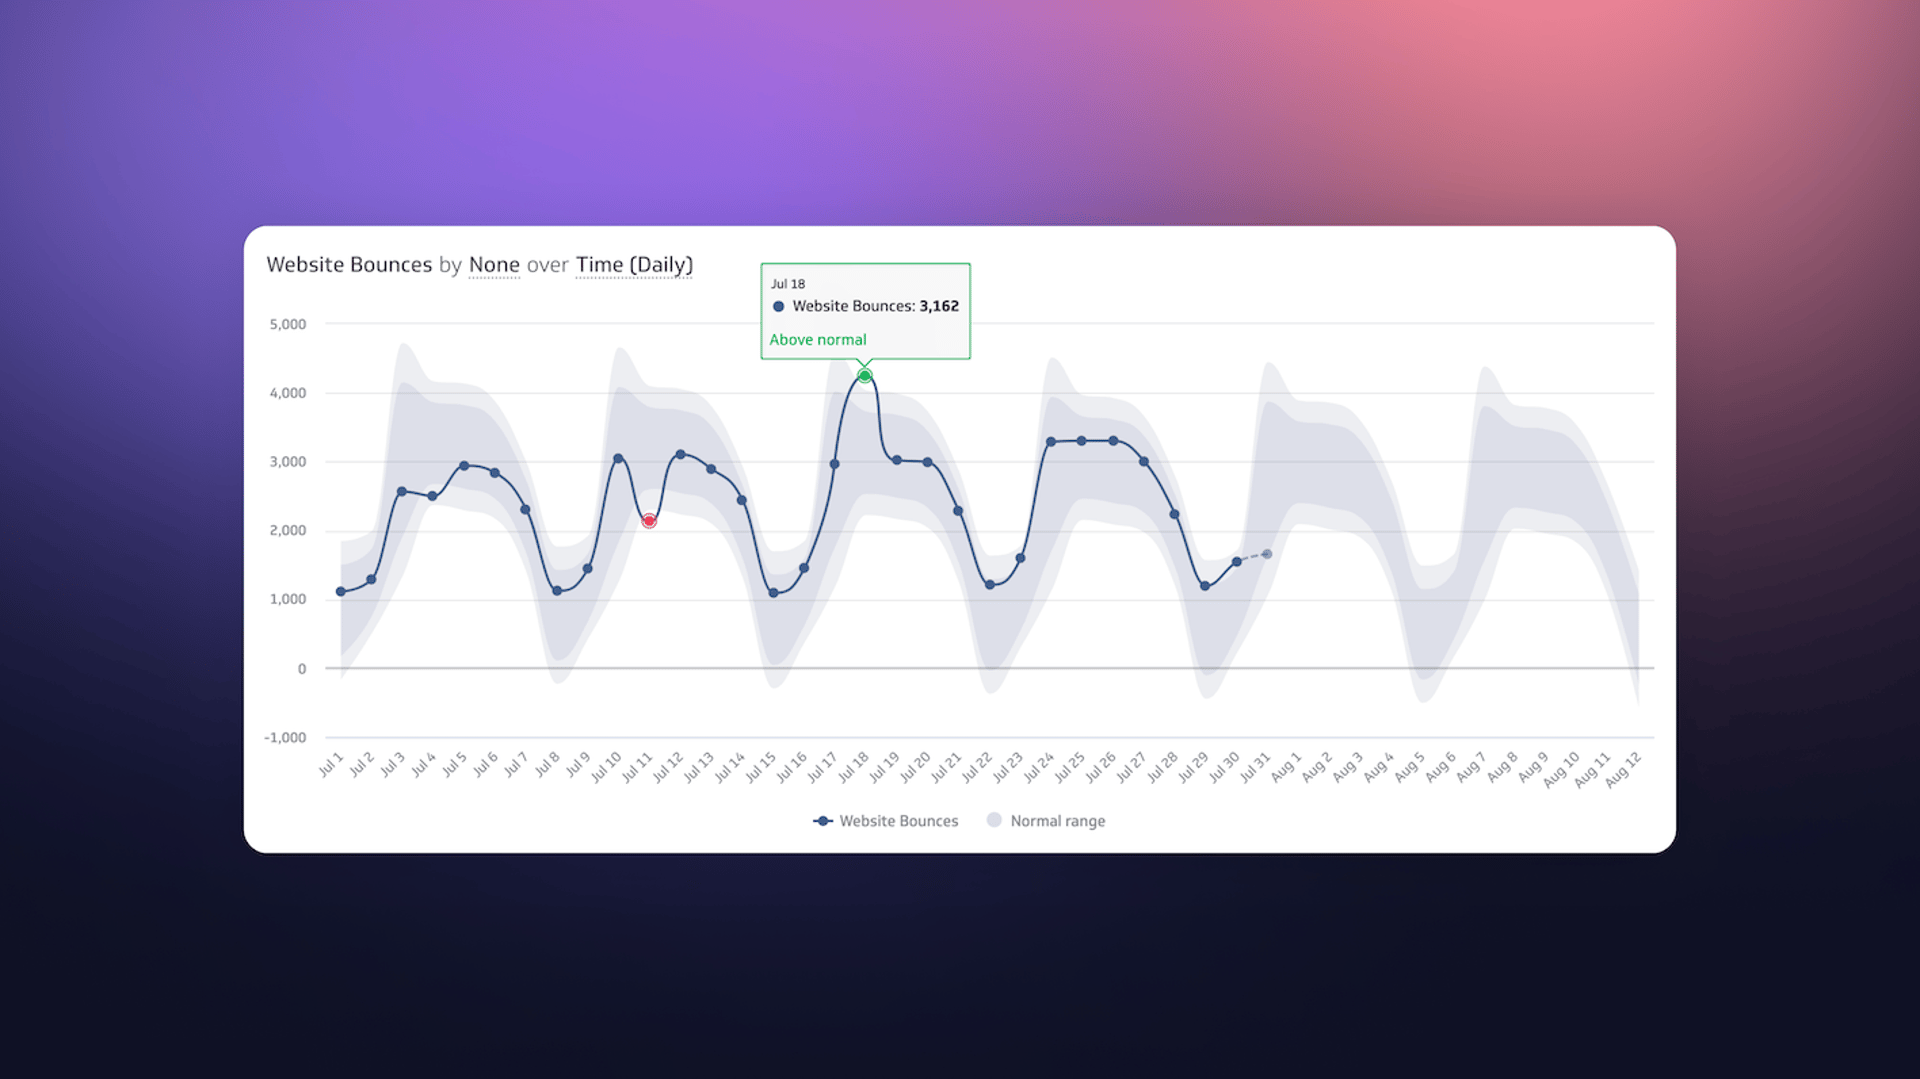
The predictable structure of a metric and the built-in history allows PowerMetrics to perform data analyses such as visualizing the expected range of a metric and identifying when the values are outside of the normal range of the data:
Metrics – A better way to consume data
Metrics represent a fundamental shift in how data is structured within an organization. Metrics aren’t simply defined based on the data that’s available, they’re defined based on the needs of decision makers. This personalized approach to data enables companies to be information-driven and empowers business teams to make the right decisions, tailored to their organization, based on their metric data.
The universal structure of data in metrics is perfectly suited to the common types of operations done in analytics. By their innate nature and design, metrics simultaneously bring depth and simplicity to your analytics - something traditional BI often fails to do.
Related Articles
Metrics provide rich context for better AI: Introducing the new PowerMetrics AI experience
By David Mennie — June 21st, 2024
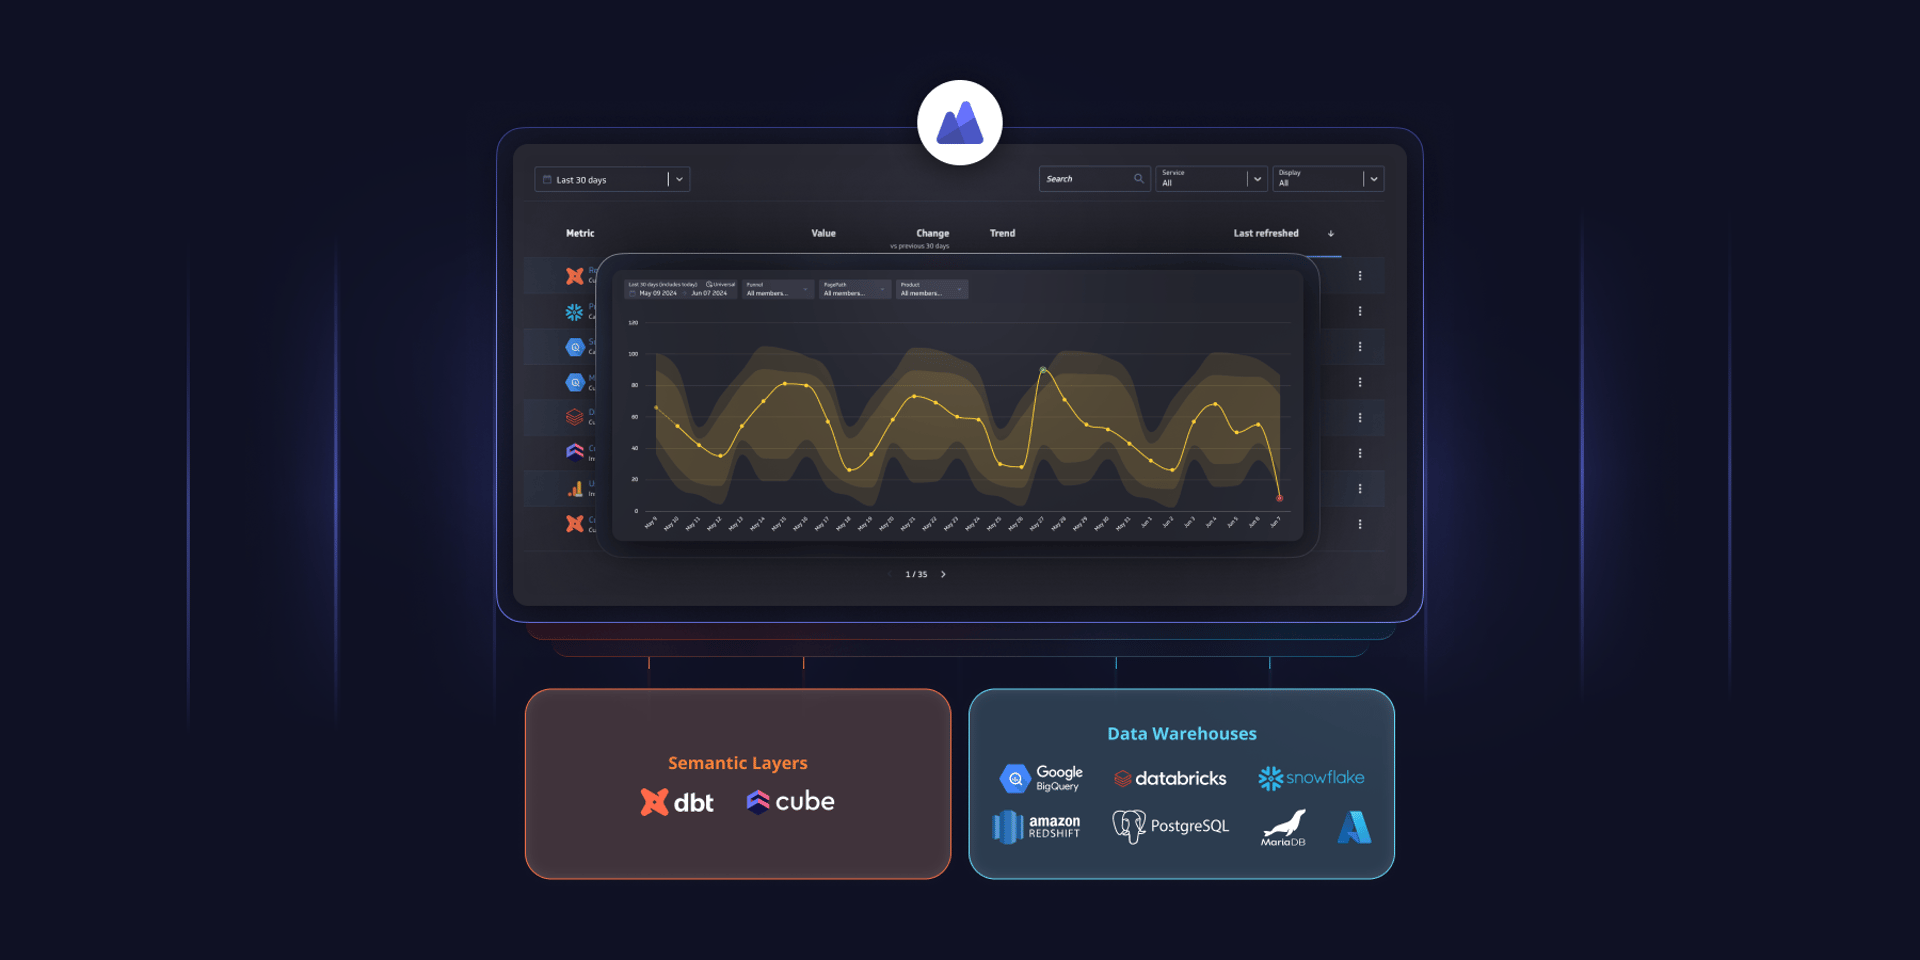
PowerMetrics - New data warehouse integrations and Cube semantic layer support
By David Mennie — June 14th, 2024

Partner Case Study: Eyeful
By Cathrin Schneider — May 21st, 2024

Partner Case Study: The Project Booth
By Cathrin Schneider — April 11th, 2024