

Data-driven agency series, chapter 3: The power of agency reporting
Dashboard reporting offers more value than your competition. It gives clients live access to the same core facts you track every day, saves time, reduces manual effort, and builds trust through transparency. This chapter covers how agencies can use lead generation, marketing performance, project management, financial, and client alerts dashboards to win new customers, reclaim hours, and grow client relationships.

Dashboard reporting is a distinct way to offer more value than your competition
What is dashboard reporting?
Traditional reports are one-off documents compiled after analysis. Dashboard reporting gives clients live access to the same core facts you track every day. The difference isn't just format: it's whether your clients know what's happening before they have to ask.
You save time. You reduce manual effort. And when you get it right, clients stop wondering if the numbers are current, because they can see for themselves.
For example, take agency partner RootedElm, who worked closely with A&W Restaurants.
A&W: A data-driven 100th birthday
Partners prove that success can be driven by data and clear reporting processes. With Klipfolio Klips, RootedElm supported A&W's marketing efforts, acting as a trusted advisor on projects such as their MugClub email marketing campaign.
Using data modelled into dashboards and delivered through dashboard reports, A&W expanded subscriber reach and enhanced engagement as they headed toward celebrating their 100th birthday.
Three ways dashboard reporting adds value to a digital marketing agency
Lead generation: win new customers by standing out
Organisation: reclaim hours and increase team performance
Transparency: use open communication to build trust
Win new customers by standing out
Reporting in real time gives clients access to their data every day of the month, so they are involved every step of the way. No surprises at month end. That constant visibility builds confidence on both sides, and confidence is what keeps clients from looking elsewhere.
A practical move many agencies still skip is adopting reporting practices that put clients in the driver's seat. Clients can react in real time and make smarter decisions backed by current data, without waiting for someone to pull a number or paste figures into a chatbot and hope for the best.
Another RootedElm client, Elise from Lexington Podiatry, changed how the team works because of this shift.
"Dashboard reporting helps me know when it's time to worry or when things are running smoothly with just a quick glance. Decision making on the fly has never been easier."
This is how you stand out. This is how you help clients grow revenue.
Lead generation dashboard
Many agencies have no formal process for managing client acquisition or reading the signals in their data. Without a clear picture, it's easy to mistake activity for progress.
Build a lead generation dashboard to track and report on onboarding. You'll see which tactics work and where to adjust. Consider these metrics on your lead generation dashboard:
Page views
Average time on site
Session duration
Goal conversions
Bounce rate
Conversion rate
Page performance
Create custom dashboards for you and your team.
Get started with KlipsReclaim hours in your day
With data at your fingertips, you can act quickly. The team gets more organised and more productive, because everyone is working from the same picture instead of reconciling different versions of the truth.
With better internal transparency and shared context, your team spots trends as they happen. Campaigns and creative work improve in real time. Your approach shifts from reactive to proactive, and that shift is visible to clients.
This is where a marketing performance dashboard fits.
Marketing performance dashboard
Agencies often place clients front and centre and lose sight of their own objectives. Track your own performance to protect capacity and output across marketing activities. Start with:
Campaign performance
Web traffic targets
Return on investment (ROI)
Content strategist Andy Crestodina helped prototype this marketing performance dashboard. Agencies use it to see which content attracts and converts, and where new opportunities sit.
Strong performance needs solid project management
As an agency, you juggle many clients and deliverables. There is a difference between reporting and monitoring. Business dashboards let teams access a client's key data in a click or two, without sifting through spreadsheets or screenshots parked in shared drives.
Dashboards let you combine data sets any way you need. That helps project management at the team and organisation level. Everyone gets a clear picture of the project and its moving parts.
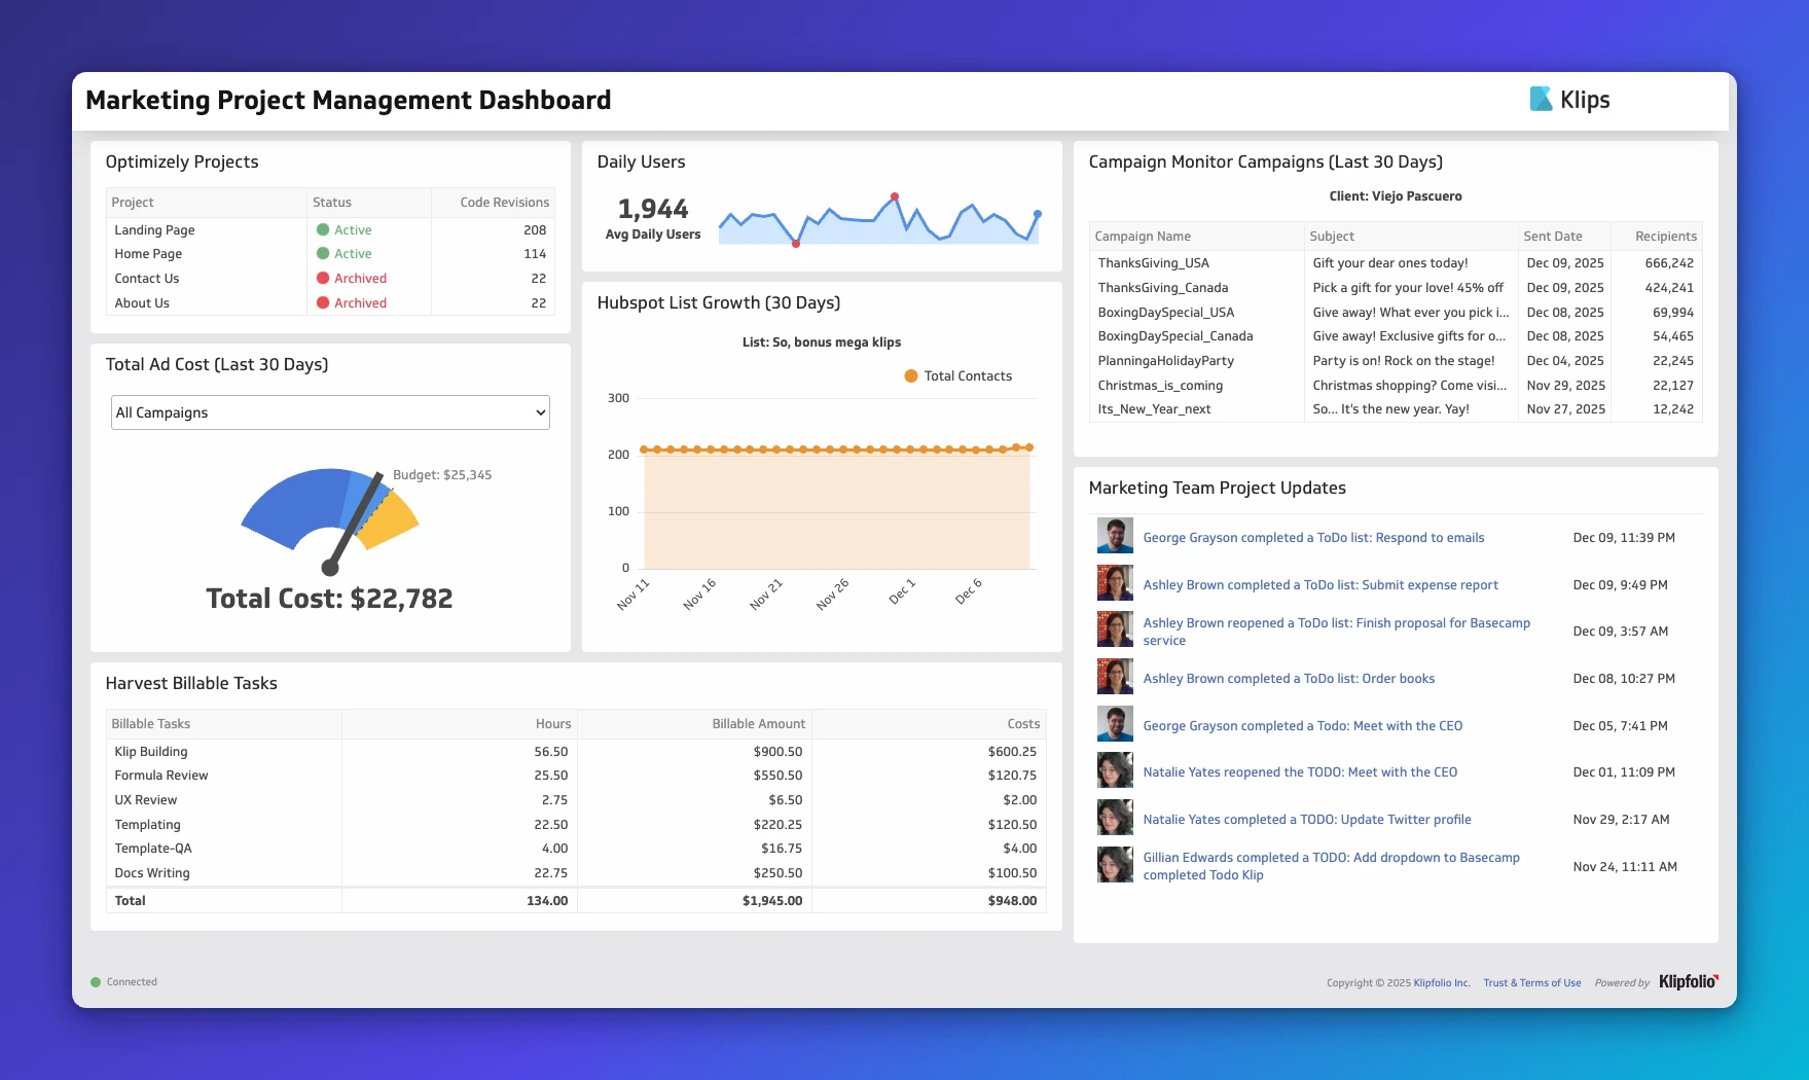
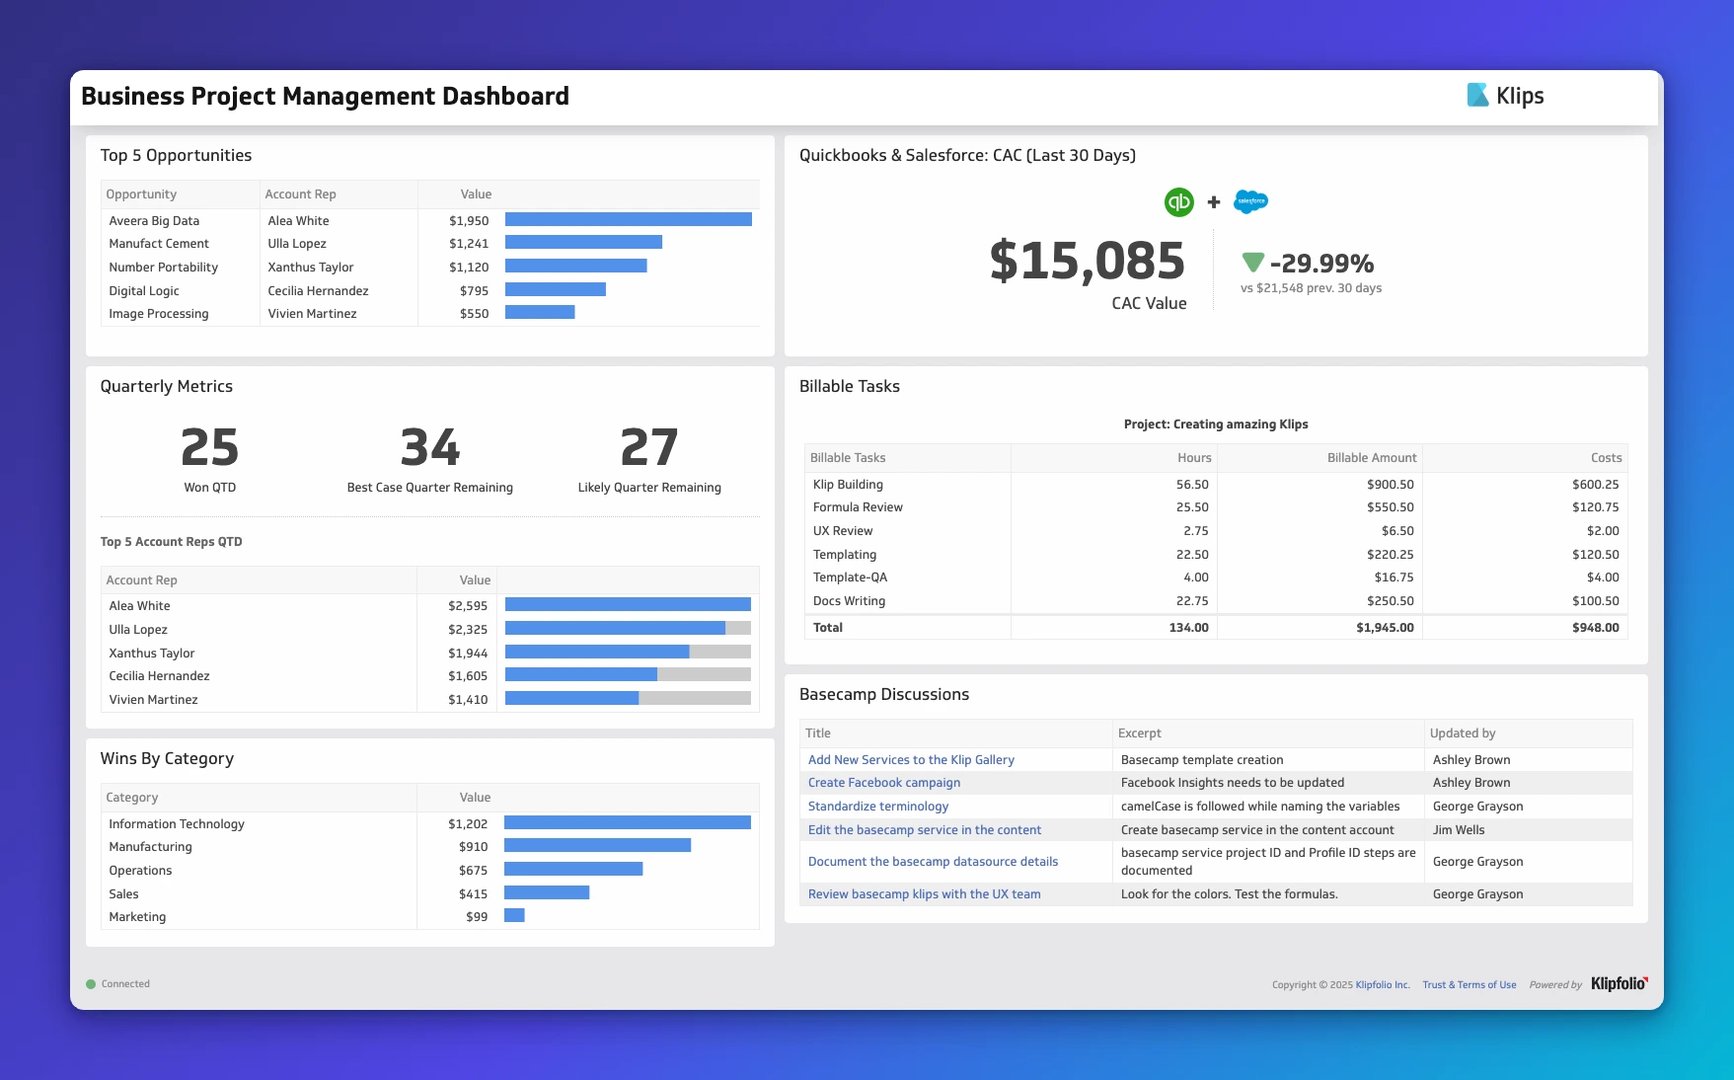
Project management dashboard
Growing agencies manage dozens of projects across multiple clients. Keeping that straight is hard, and the cost of losing track is measured in missed deadlines and unhappy clients.
A project management dashboard consolidates the process into a single view and lets you associate targets with deliverables. Track these metrics for each project:
Create multiple dashboards if that helps. For example, one for marketing project management and one for business project management.
Use open communication to build a culture of trust
Clients want to see and interact with their data in real time, not just hear about it. When the numbers are always available and always reliable, you spend less time defending your work and more time doing it.
Data transparency builds trust. A stronger relationship delivers better service and creates loyal clients who refer others.
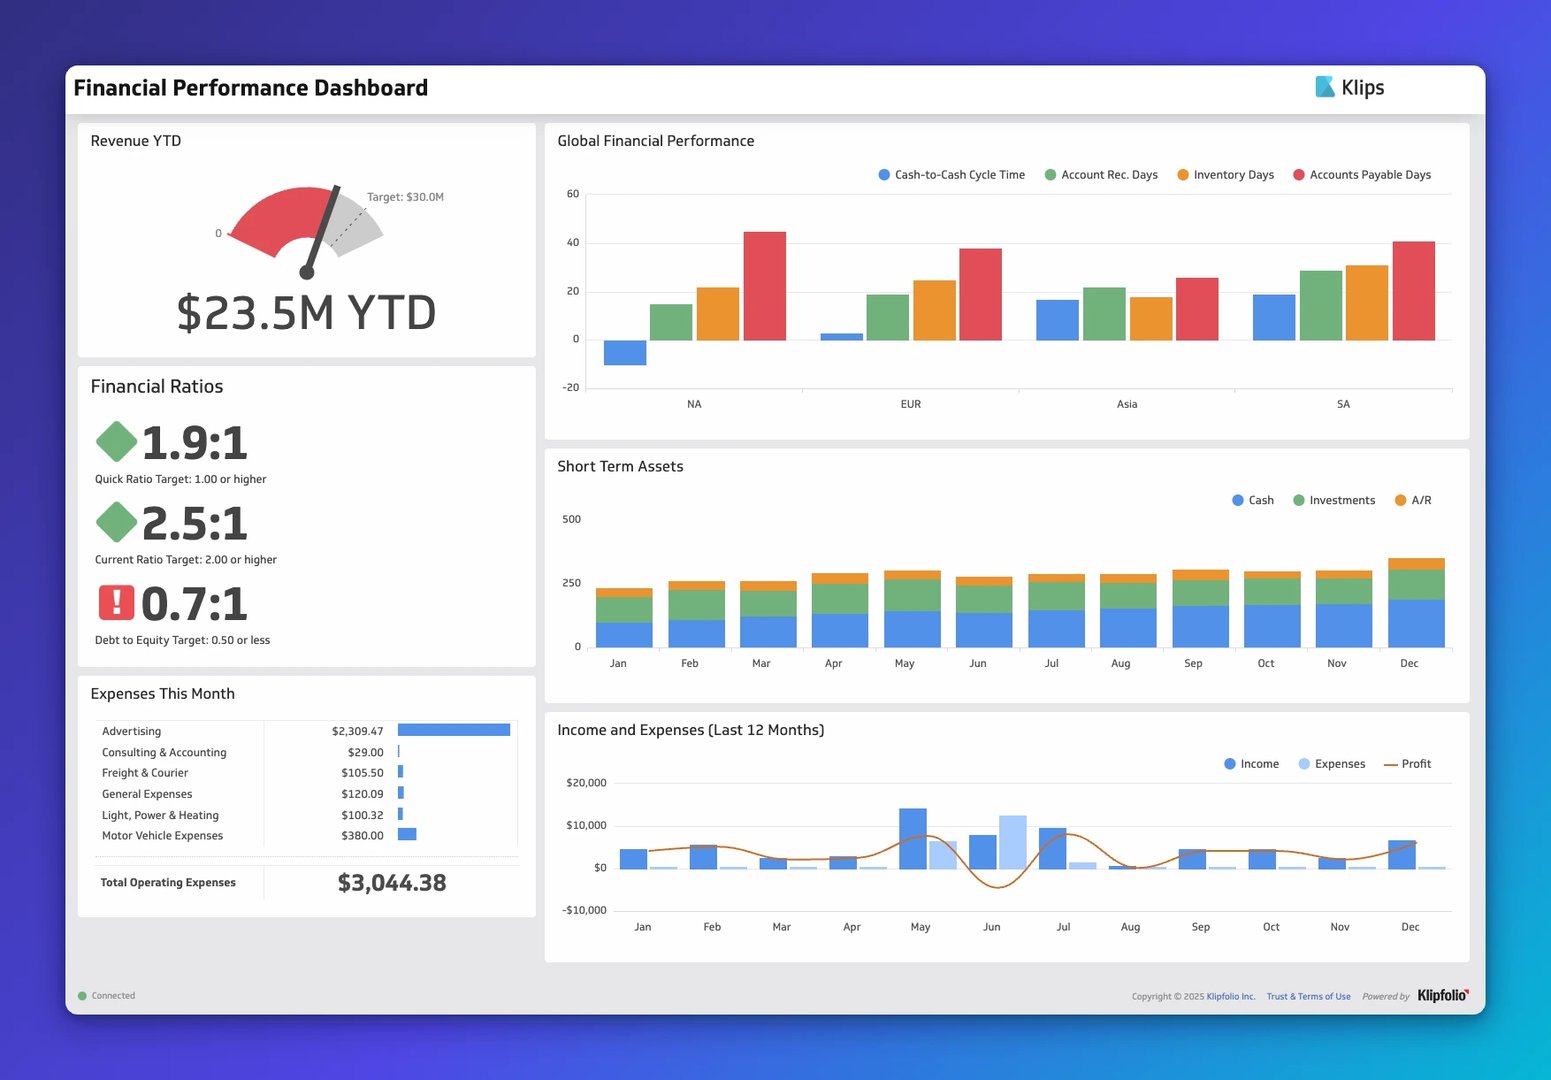
Financial management dashboard
Beyond marketing performance, agencies need to manage billing and account health. Juggling multiple clients and account types requires systems and process. A financial management dashboard gives the team shared visibility, so billing gaps and overdue invoices don't slip through.
Focus your financial management dashboard on:
Total advertising costs
Transparency grows from clear, open communication
One of the most overlooked benefits of dashboards for agencies is better communication. With concise data visualisations, managers get a clear picture of client performance, which makes delegating easier.
Transparency also improves across the organisation because each person understands what others are doing. A leader focused on SEO can glance at a dashboard and understand what data is coming from a CRM without asking a CRM specialist to export it. That's a small thing that saves real time, every week.
Client alerts dashboard
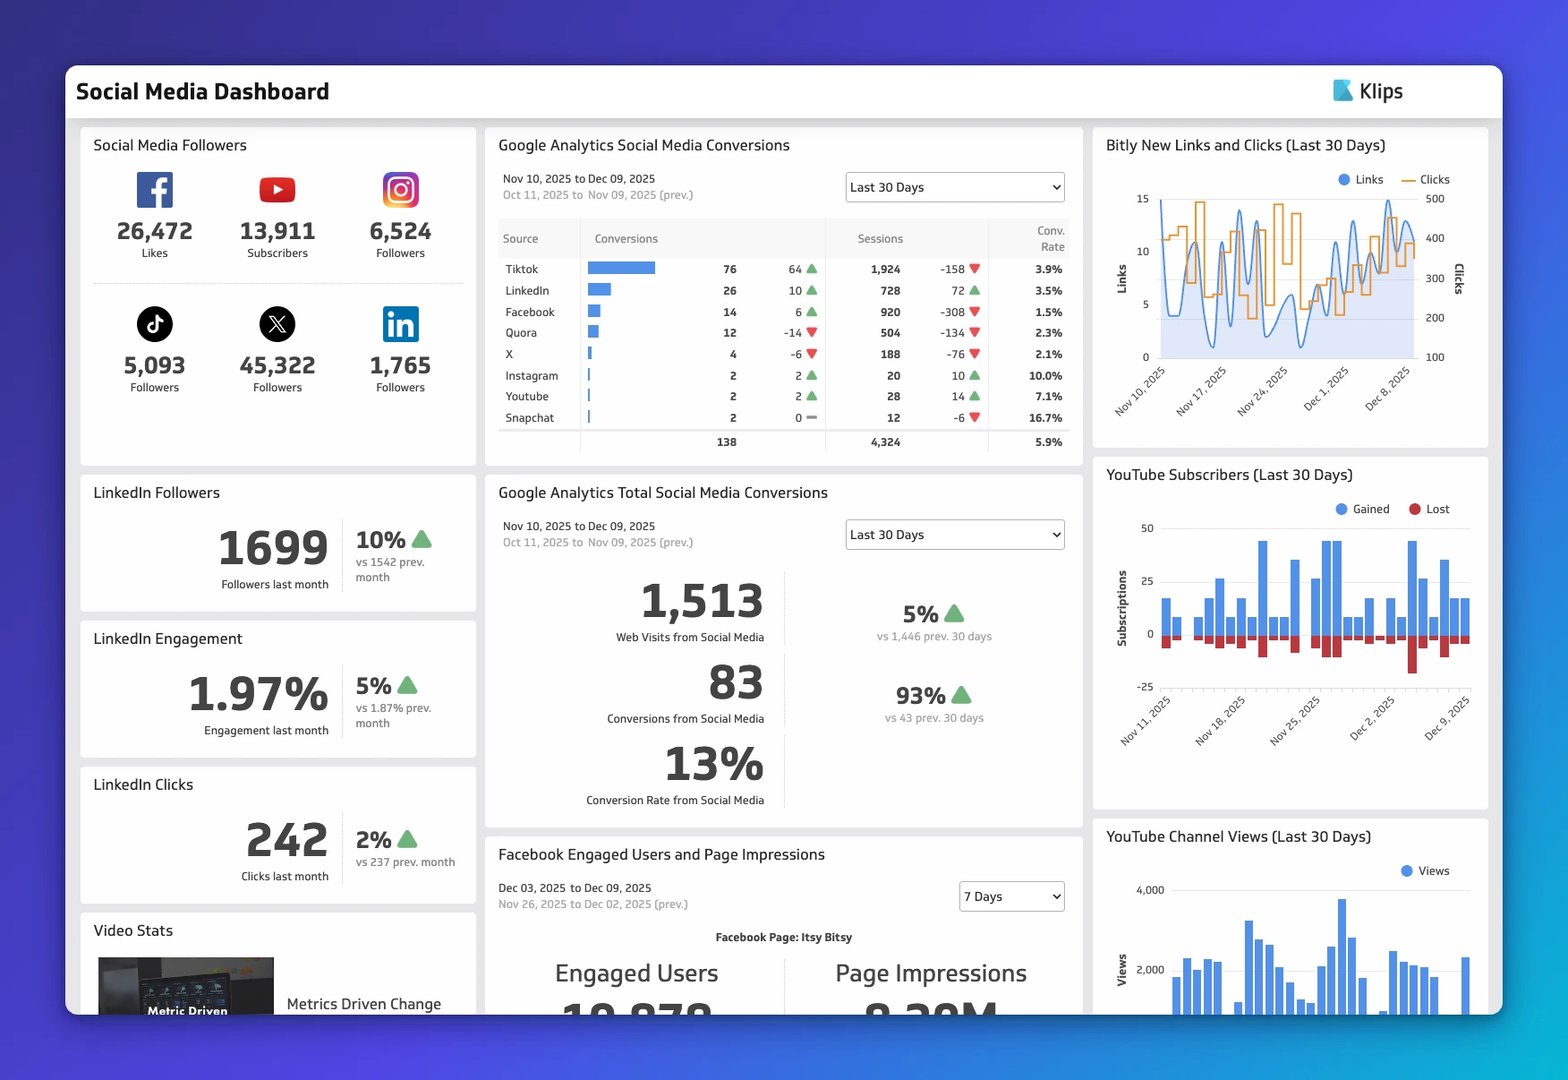
A client alerts dashboard helps you monitor client performance without waiting for someone to flag a problem. Get creative here. Agencies run TV dashboards for social channels and add client growth metrics so the whole team stays oriented.
Metrics to showcase on client-facing dashboards:
Social mentions (X)
Social media followers
Brand awareness or client testimonials
Net Promoter Score (NPS)
Social media command centre
Easy to set up with a pre-built connection and simple to use, a Social Command Centre keeps each client front and centre. No pasting numbers into a spreadsheet. No explaining your client's channel mix to a tool that doesn't know them. The data is there, consistent and current, every time someone looks.
Next up
Updated 2026-09-08
More in Agency Analytics

5 common dashboards among over 800 digital agencies

Data-Driven Agency Series, Chapter 4: The essentials of an agency pitch

Data-Driven Agency Series, Chapter 2: Using data to foster lasting customer relationships

How digital marketing agencies can use business dashboards

How we automated reporting for 50+ clients

Data-Driven Agency Series, Chapter 1: Best KPIs for Marketing Agencies
Most recent
- SEP 25What SOC 2 taught a small team about trust
- SEP 15The AI race: progress, humanity, and trust
- SEP 9The good advisor
- AUG 11Beyond simple sign-ups: how True Trials and Activation predict growth
- JUL 7Why business leaders miss important trends in their dashboards
- JUN 19The best chart for the job: Visualizing data for non-technical users